Des Moines County, Iowa
Des Moines County is a county located in the U.S. state of Iowa. As of the 2010 census, the population was 40,325.[1] The county seat and largest city is Burlington.[2] It is one of Iowa's two original counties along with Dubuque County; both were organized by the Michigan Territorial legislature in 1834.
Des Moines County | |
|---|---|
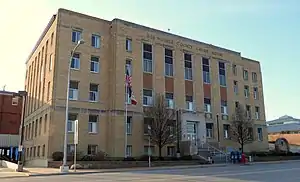 Des Moines County Courthouse | |
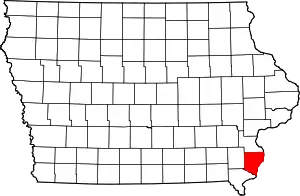 Location within the U.S. state of Iowa | |
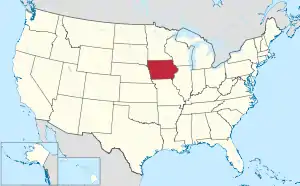 Iowa's location within the U.S. | |
| Coordinates: 40°55′40″N 91°11′02″W | |
| Country | |
| State | |
| Founded | 1834 |
| Named for | Des Moines River |
| Seat | Burlington |
| Largest city | Burlington |
| Area | |
| • Total | 430 sq mi (1,100 km2) |
| • Land | 416 sq mi (1,080 km2) |
| • Water | 14 sq mi (40 km2) 3.2% |
| Population (2010) | |
| • Total | 40,325 |
| • Estimate (2018) | 39,138 |
| • Density | 94/sq mi (36/km2) |
| Time zone | UTC−6 (Central) |
| • Summer (DST) | UTC−5 (CDT) |
| Congressional district | 2nd |
| Website | dmcounty |
Des Moines County is part of the Burlington, IA–IL Micropolitan Statistical Area.
Des Moines County should not be confused with the city of Des Moines, which is the capital of Iowa. Des Moines County sits on Iowa's eastern border alongside the Mississippi River. The city of Des Moines is in Polk County in central Iowa. Both places derive their name from the Des Moines River, which flows through the city of Des Moines and originally flowed through the county. When the county was divided early in Iowa's history, the river ended up further west, forming the border between Lee County, Iowa and the state of Missouri.
History
At an extra session of the Sixth Legislative Assembly of Michigan Territory held in September, 1834, the Iowa District was divided into two counties by running a line due west from the lower end of Rock Island in the Mississippi River. The territory north of this line (which started just south of the present-day Davenport) was named Dubuque County, and all south of it was Demoine County. It was named after the Des Moines River.[3] From July 3, 1836 until July 3, 1838, Des Moines County was part of Wisconsin Territory. The county underwent various border changes during this time. July 4, 1838, the named county became part of Iowa Territory (later the state of Iowa).[4]
The current Des Moines County Court House was completed in 1940.[5]
Geography

According to the U.S. Census Bureau, the county has a total area of 430 square miles (1,100 km2), of which 416 square miles (1,080 km2) is land and 14 square miles (36 km2) (3.2%) is water.[6] The Mississippi River forms the east border; Skunk River, the south border; and the county is drained by Flint Creek.[7]
Major highways
Airport
The Southeast Iowa Regional Airport (IATA code BRL), is located on the southern side of Burlington. Commercial service is provided through Air Choice One. This service offers two weekday daily flights to St. Louis and Chicago, while offering single flights on weekends.
Adjacent counties
- Louisa County (north)
- Hancock County, Illinois (southeast)
- Henderson County, Illinois (east)
- Lee County (south)
- Henry County (west)
Demographics
| Historical population | |||
|---|---|---|---|
| Census | Pop. | %± | |
| 1850 | 12,988 | — | |
| 1860 | 19,611 | 51.0% | |
| 1870 | 27,256 | 39.0% | |
| 1880 | 33,099 | 21.4% | |
| 1890 | 35,324 | 6.7% | |
| 1900 | 35,989 | 1.9% | |
| 1910 | 36,145 | 0.4% | |
| 1920 | 35,520 | −1.7% | |
| 1930 | 38,162 | 7.4% | |
| 1940 | 36,804 | −3.6% | |
| 1950 | 42,056 | 14.3% | |
| 1960 | 44,605 | 6.1% | |
| 1970 | 46,982 | 5.3% | |
| 1980 | 46,203 | −1.7% | |
| 1990 | 42,614 | −7.8% | |
| 2000 | 42,351 | −0.6% | |
| 2010 | 40,325 | −4.8% | |
| 2018 (est.) | 39,138 | [8] | −2.9% |
| U.S. Decennial Census[9] 1790-1960[10] 1900-1990[11] 1990-2000[12] 2010-2018[1] | |||
2010 census
The 2010 census recorded a population of 40,325 in the county, with a population density of 96.9002/sq mi (37.4134/km2). There were 18,535 housing units, of which 17,003 were occupied.[13]
2000 census
As of the 2000 census,[14] there were 42,351 people, 17,270 households, and 11,536 families residing in the county. The population density was 102 people per square mile (39/km2). There were 18,643 housing units at an average density of 45 per square mile (17/km2). The racial makeup of the county was 93.69% White, 3.57% Black or African American, 0.25% Native American, 0.59% Asian, 0.04% Pacific Islander, 0.68% from other races, and 1.18% from two or more races. 1.75% of the population were Hispanic or Latino of any race.
There were 17,270 households, out of which 29.60% had children under the age of 18 living with them, 52.70% were married couples living together, 10.50% had a female householder with no husband present, and 33.20% were non-families. 28.60% of all households were made up of individuals, and 12.60% had someone living alone who was 65 years of age or older. The average household size was 2.40 and the average family size was 2.94.
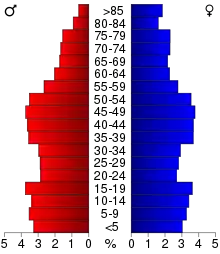
In the county, the population was spread out, with 24.40% under the age of 18, 8.50% from 18 to 24, 26.10% from 25 to 44, 24.30% from 45 to 64, and 16.70% who were 65 years of age or older. The median age was 39 years. For every 100 females, there were 93.50 males. For every 100 females age 18 and over, there were 90.30 males.
The median income for a household in the county was $36,790, and the median income for a family was $45,089. Males had a median income of $34,880 versus $22,530 for females. The per capita income for the county was $19,701. About 8.20% of families and 10.70% of the population were below the poverty line, including 17.30% of those under age 18 and 7.40% of those age 65 or over.
Communities
Census-designated place
Other unincorporated communities
Townships
- Benton
- Concordia
- Danville
- Flint River
- Franklin
- Huron
- Jackson
- Pleasant Grove
- Tama
- Union
- Washington
- Yellow Springs
Population ranking
The population ranking of the following table is based on the 2010 census of Des Moines County.[15]
† county seat
| Rank | City/Town/etc. | Municipal type | Population (2010 Census) |
|---|---|---|---|
| 1 | † Burlington | City | 25,663 |
| 2 | West Burlington | City | 2,968 |
| 3 | Mediapolis | City | 1,560 |
| 4 | Beaverdale | CDP | 952 |
| 5 | Danville | City | 934 |
| 6 | Middletown | City | 318 |
Politics
From 1896 through 1960, Des Moines County was a primarily Republican county, backing Democratic nominees only four times in the period (Woodrow Wilson in 1912, with a low plurality; Franklin Roosevelt in his two landslides in 1932 and 1936; and Harry Truman in 1948). From 1964 through 2012, it became a Democratic stronghold, backing the Democratic nominee in every election in this period save in Nixon's 1972 landslide. In 2016, Donald Trump became the first Republican since 1972 to carry the county, despite narrowly losing the overall national popular vote; the county swung over 25% in his favor relative to its 2012 vote.[16] In 2020, Trump again carried the county, with an increased vote share, the first time the county has voted Republican twice in a row since 1956 and 1960.
| Year | Republican | Democratic | Third Parties |
|---|---|---|---|
| 2020 | 53.1% 10,592 | 44.6% 8,893 | 2.3% 471 |
| 2016 | 49.9% 9,529 | 43.0% 8,212 | 7.1% 1,362 |
| 2012 | 39.9% 8,136 | 58.3% 11,888 | 1.8% 361 |
| 2008 | 37.5% 7,721 | 60.6% 12,462 | 1.9% 391 |
| 2004 | 39.4% 8,221 | 59.7% 12,456 | 0.9% 197 |
| 2000 | 38.1% 7,385 | 58.6% 11,351 | 3.3% 629 |
| 1996 | 31.1% 5,778 | 57.9% 10,761 | 11.0% 2,035 |
| 1992 | 30.1% 6,378 | 53.4% 11,309 | 16.5% 3,503 |
| 1988 | 39.5% 7,652 | 59.8% 11,593 | 0.7% 129 |
| 1984 | 45.9% 9,559 | 53.6% 11,173 | 0.6% 118 |
| 1980 | 44.9% 9,158 | 48.9% 9,977 | 6.3% 1,282 |
| 1976 | 43.9% 9,023 | 54.9% 11,268 | 1.2% 245 |
| 1972 | 52.8% 10,216 | 45.8% 8,869 | 1.4% 273 |
| 1968 | 42.3% 8,452 | 50.9% 10,164 | 6.8% 1,363 |
| 1964 | 29.5% 5,830 | 70.3% 13,894 | 0.2% 38 |
| 1960 | 51.9% 10,678 | 47.9% 9,872 | 0.2% 41 |
| 1956 | 55.9% 11,152 | 44.0% 8,781 | 0.1% 25 |
| 1952 | 58.1% 12,182 | 41.5% 8,686 | 0.4% 89 |
| 1948 | 45.6% 7,621 | 52.6% 8,792 | 1.9% 316 |
| 1944 | 55.2% 9,488 | 43.9% 7,543 | 0.9% 146 |
| 1940 | 62.3% 10,988 | 37.3% 6,578 | 0.3% 59 |
| 1936 | 43.1% 6,763 | 44.6% 7,011 | 12.3% 1,931 |
| 1932 | 35.7% 5,590 | 59.9% 9,395 | 4.4% 690 |
| 1928 | 64.7% 10,547 | 34.2% 5,578 | 1.1% 177 |
| 1924 | 54.0% 7,995 | 17.7% 2,616 | 28.4% 4,199 |
| 1920 | 63.8% 8,287 | 26.5% 3,449 | 9.7% 1,261 |
| 1916 | 49.5% 4,132 | 45.9% 3,827 | 4.6% 386 |
| 1912 | 26.5% 2,136 | 39.3% 3,169 | 34.2% 2,759 |
| 1908 | 48.9% 4,153 | 46.8% 3,975 | 4.3% 361 |
| 1904 | 54.2% 4,496 | 36.7% 3,043 | 9.2% 760 |
| 1900 | 50.7% 4,315 | 45.9% 3,909 | 3.3% 284 |
| 1896 | 53.1% 4,549 | 43.6% 3,741 | 3.3% 284 |
References
- "State & County QuickFacts". United States Census Bureau. Archived from the original on June 7, 2011. Retrieved July 16, 2014.
- "Find a County". National Association of Counties. Archived from the original on May 31, 2011. Retrieved June 7, 2011.
- Des Moines County Archived July 3, 2007, at Archive.today
- "WI: Individual County Chronologies". publications.newberry.org. Retrieved September 28, 2016.
- Svendsen, Marlvs A. "PWA-Era County Courthouses of IA MPS". National Park Service. Retrieved February 9, 2011.
- "US Gazetteer files: 2010, 2000, and 1990". United States Census Bureau. February 12, 2011. Retrieved April 23, 2011.
- Ripley, George; Dana, Charles A., eds. (1879). . The American Cyclopædia.
- "Population and Housing Unit Estimates". Retrieved June 20, 2019.
- "U.S. Decennial Census". United States Census Bureau. Retrieved July 16, 2014.
- "Historical Census Browser". University of Virginia Library. Retrieved July 16, 2014.
- "Population of Counties by Decennial Census: 1900 to 1990". United States Census Bureau. Retrieved July 16, 2014.
- "Census 2000 PHC-T-4. Ranking Tables for Counties: 1990 and 2000" (PDF). United States Census Bureau. Retrieved July 16, 2014.
- "Population & Housing Occupancy Status 2010". United States Census Bureau American FactFinder. Retrieved May 9, 2011.
- "U.S. Census website". United States Census Bureau. Retrieved January 31, 2008.
- "Archived copy". Retrieved February 10, 2013.
- "Here's a map of the US counties that flipped to Trump from Democrats". www.cnbc.com. Retrieved 2021-01-11.
- Leip, David. "Dave Leip's Atlas of U.S. Presidential Elections". uselectionatlas.org. Retrieved April 25, 2018.
Further reading
- Antrobus, Augustine M (1915). History of Des Moines County, Iowa and its People : Illustrated : Volume 1. Chicago: S.J. Clarke Publishing Company. Retrieved April 20, 2014.
- Antrobus, Augustine M (1915). History of Des Moines County, Iowa and its People : Illustrated : Volume 2. Chicago: S.J. Clarke Publishing Company. Retrieved April 20, 2014.
External links
| Wikimedia Commons has media related to Des Moines County, Iowa. |
Places adjacent to Des Moines County, Iowa | ||||||||||
|---|---|---|---|---|---|---|---|---|---|---|
| ||||||||||
Municipalities and communities of Des Moines County, Iowa, United States | ||
|---|---|---|
| Cities | Map of Iowa highlighting Des Moines County | |
| Townships |
| |
| CDP | ||
| Other unincorporated communities | ||
| ||

| Authority control |
|---|