Chickasaw County, Iowa
Chickasaw County is a county located in the U.S. state of Iowa. As of the 2010 census, the population was 12,439.[1] Its county seat is New Hampton.[2] The county was named for the southern Indian Nation whose chief was Bradford.
Chickasaw County | |
|---|---|
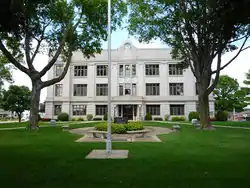 Chickasaw County court house built in 1929 | |
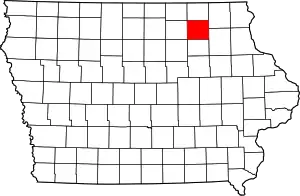 Location within the U.S. state of Iowa | |
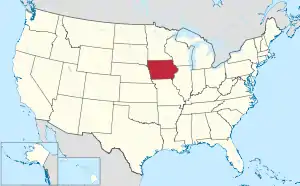 Iowa's location within the U.S. | |
| Coordinates: 43°03′36″N 92°19′08″W | |
| Country | |
| State | |
| Founded | January 15, 1851 |
| Named for | Chickasaw people |
| Seat | New Hampton |
| Largest city | New Hampton |
| Area | |
| • Total | 506 sq mi (1,310 km2) |
| • Land | 504 sq mi (1,310 km2) |
| • Water | 1.3 sq mi (3 km2) 0.3% |
| Population (2010) | |
| • Total | 12,439 |
| • Estimate (2018) | 11,964 |
| • Density | 25/sq mi (9.5/km2) |
| Time zone | UTC−6 (Central) |
| • Summer (DST) | UTC−5 (CDT) |
| Congressional district | 4th |
History
Chickasaw County was founded in January 1851. It was named after the Chickasaw tribe, which lived in the Southern United States at the time.
The first nonindigenous settlers arrived in 1848 and the first county seat was from 1854 in Bradford, in the southwestern corner of the county. In the spring of 1857, the seat was moved to New Hampton, located near the geographic center, and was then called Chickasaw Center. The first county offices were housed in private houses and in the school building. The first courthouse, a wood-frame building, was erected in 1865. That building was enlarged in 1876, but a fire on March 26, 1880 destroyed it (townspeople managed to save the records).[3] A brick/stone replacement structure was completed in 1881, and included a soaring clock tower. This building was enlarged in 1905 and again in 1906, but by the twenties it again was too small. The present structure, featuring Bedford stone, was built in 1929 and put into use in 1930.
Geography
According to the US Census Bureau, the county has a total area of 506 square miles (1,310 km2), of which 504 square miles (1,310 km2) is land and 1.3 square miles (3.4 km2) (0.3%) is water.[4]
Adjacent counties
- Bremer County (south)
- Butler County (southwest)
- Fayette County (southeast)
- Floyd County (west)
- Howard County (north)
- Mitchell County (northwest)
- Winneshiek County (northeast)
Highways
.svg.png.webp) U.S. Highway 18
U.S. Highway 18.svg.png.webp) U.S. Highway 63
U.S. Highway 63.svg.png.webp) U.S. Highway 218
U.S. Highway 218 Iowa Highway 24
 Iowa Highway 27
 Iowa Highway 346
Demographics
| Historical population | |||
|---|---|---|---|
| Census | Pop. | %± | |
| 1860 | 4,336 | — | |
| 1870 | 10,180 | 134.8% | |
| 1880 | 14,534 | 42.8% | |
| 1890 | 15,019 | 3.3% | |
| 1900 | 17,037 | 13.4% | |
| 1910 | 15,375 | −9.8% | |
| 1920 | 15,431 | 0.4% | |
| 1930 | 14,637 | −5.1% | |
| 1940 | 15,227 | 4.0% | |
| 1950 | 15,228 | 0.0% | |
| 1960 | 15,034 | −1.3% | |
| 1970 | 14,969 | −0.4% | |
| 1980 | 15,437 | 3.1% | |
| 1990 | 13,295 | −13.9% | |
| 2000 | 13,095 | −1.5% | |
| 2010 | 12,439 | −5.0% | |
| 2018 (est.) | 11,964 | [5] | −3.8% |
| U.S. Decennial Census[6] 1790-1960[7] 1900-1990[8] 1990-2000[9] 2010-2018[1] | |||
2010 census
The 2010 census recorded a population of 12,439 in the county, with a population density of 24.632/sq mi (9.510/km2). There were 5,679 housing units, of which 5,204 were occupied.[10]
2000 census
As of the census[11] of 2000, there were 13,095 people, 5,192 households, and 3,644 families residing in the county. The population density was 26 people per square mile (10/km2). There were 5,593 housing units at an average density of 11 per square mile (4/km2). The racial makeup of the county was 98.75% White, 0.05% Black or African American, 0.03% Native American, 0.27% Asian, 0.01% Pacific Islander, 0.29% from other races, and 0.60% from two or more races. 0.63% of the population were Hispanic or Latino of any race.
There were 5,192 households, out of which 31.90% had children under the age of 18 living with them, 60.70% were married couples living together, 6.30% had a female householder with no husband present, and 29.80% were non-families. 26.10% of all households were made up of individuals, and 13.70% had someone living alone who was 65 years of age or older. The average household size was 2.48 and the average family size was 3.00.
In the county, the population was spread out, with 26.10% under the age of 18, 6.90% from 18 to 24, 25.60% from 25 to 44, 23.40% from 45 to 64, and 17.90% who were 65 years of age or older. The median age was 40 years. For every 100 females there were 100.10 males. For every 100 females age 18 and over, there were 96.50 males.
The median income for a household in the county was $37,649, and the median income for a family was $44,306. Males had a median income of $30,099 versus $21,309 for females. The per capita income for the county was $18,237. About 5.90% of families and 8.30% of the population were below the poverty line, including 9.90% of those under age 18 and 7.70% of those age 65 or over.
Chickasaw County posted the highest county unemployment rate in Iowa in the 2000 Census with 8% of the workforce unemployed. This figure, however, was still relatively low compared to the problems faced by many other counties in the Midwest.
Communities
Townships
Population ranking
The population ranking of the following table is based on the 2010 census of Chickasaw County.[13]
† county seat
| Rank | City/Town/etc. | Municipal type | Population (2010 Census) |
|---|---|---|---|
| 1 | † New Hampton | City | 3,571 |
| 2 | Nashua (partially in Floyd County) | City | 1,663 |
| 3 | Fredericksburg | City | 931 |
| 4 | Lawler | City | 439 |
| 5 | Ionia | City | 291 |
| 6 | Protivin (mostly in Howard County) | City | 283 |
| 7 | Alta Vista | City | 266 |
| 8 | North Washington | City | 117 |
| 9 | Bassett | City | 66 |
Politics
| Year | Republican | Democratic | Third Parties |
|---|---|---|---|
| 2016 | 58.2% 3,742 | 35.2% 2,266 | 6.6% 427 |
| 2012 | 43.7% 2,836 | 54.8% 3,554 | 1.5% 94 |
| 2008 | 38.8% 2,557 | 59.6% 3,923 | 1.6% 106 |
| 2004 | 44.7% 3,040 | 54.5% 3,708 | 0.9% 58 |
| 2000 | 44.6% 2,936 | 52.2% 3,435 | 3.2% 213 |
| 1996 | 34.5% 2,191 | 52.8% 3,355 | 12.8% 814 |
| 1992 | 32.1% 2,129 | 43.9% 2,913 | 24.1% 1,598 |
| 1988 | 41.5% 2,549 | 57.5% 3,530 | 0.9% 57 |
| 1984 | 52.9% 3,661 | 46.1% 3,186 | 1.0% 70 |
| 1980 | 52.9% 3,929 | 39.5% 2,935 | 7.7% 569 |
| 1976 | 49.1% 3,432 | 50.1% 3,503 | 0.8% 53 |
| 1972 | 54.6% 3,836 | 44.6% 3,134 | 0.9% 60 |
| 1968 | 51.9% 3,510 | 43.9% 2,966 | 4.3% 288 |
| 1964 | 36.7% 2,632 | 63.3% 4,545 | 0.1% 5 |
| 1960 | 48.5% 3,822 | 51.5% 4,063 | 0.1% 4 |
| 1956 | 56.1% 4,205 | 43.7% 3,275 | 0.2% 15 |
| 1952 | 63.2% 5,022 | 36.8% 2,921 | 0.1% 6 |
| 1948 | 45.5% 3,449 | 53.6% 4,071 | 0.9% 69 |
| 1944 | 51.6% 3,575 | 48.0% 3,328 | 0.4% 26 |
| 1940 | 52.7% 4,440 | 47.3% 3,981 | 0.0% 2 |
| 1936 | 40.0% 3,143 | 56.7% 4,458 | 3.4% 265 |
| 1932 | 33.7% 2,585 | 65.8% 5,047 | 0.6% 44 |
| 1928 | 50.2% 3,712 | 49.6% 3,665 | 0.2% 17 |
| 1924 | 46.5% 3,416 | 23.6% 1,736 | 29.9% 2,195 |
| 1920 | 67.0% 4,517 | 32.2% 2,171 | 0.8% 56 |
| 1916 | 53.6% 1,999 | 45.5% 1,697 | 0.9% 33 |
| 1912 | 28.2% 1,022 | 52.1% 1,891 | 19.8% 718 |
| 1908 | 44.9% 1,571 | 53.6% 1,877 | 1.5% 53 |
| 1904 | 51.7% 1,972 | 47.0% 1,790 | 1.3% 49 |
| 1900 | 49.7% 2,085 | 49.2% 2,063 | 1.1% 46 |
| 1896 | 48.2% 1,967 | 51.1% 2,084 | 0.7% 30 |
See also
References
- "State & County QuickFacts". US Census Bureau. Archived from the original on July 8, 2011. Retrieved July 14, 2014.
- "Find a County". National Association of Counties. Archived from the original on June 26, 2015. Retrieved June 7, 2011.
- Chickasaw County
- "US Gazetteer files: 2010, 2000, and 1990". US Census Bureau. February 12, 2011. Retrieved April 23, 2011.
- "Population and Housing Unit Estimates". Retrieved June 27, 2019.
- "US Decennial Census". US Census Bureau. Retrieved July 14, 2014.
- "Historical Census Browser". University of Virginia Library. Retrieved July 14, 2014.
- "Population of Counties by Decennial Census: 1900 to 1990". US Census Bureau. Retrieved July 14, 2014.
- "Census 2000 PHC-T-4. Ranking Tables for Counties: 1990 and 2000" (PDF). US Census Bureau. Retrieved July 14, 2014.
- "Population and Housing Occupancy Status: 2010 - State -- County". US Census Bureau – American FactFinder. Retrieved March 9, 2011.
- "U.S. Census website". US Census Bureau. Retrieved January 31, 2008.
- Chickasaw County - Google Maps (accessed August 15, 2018)
- "Archived copy". Retrieved February 10, 2013.
- Leip, David. "Dave Leip's Atlas of U.S. Presidential Elections". uselectionatlas.org. Retrieved April 25, 2018.
| Wikimedia Commons has media related to Chickasaw County, Iowa. |
Places adjacent to Chickasaw County, Iowa | ||||||||||
|---|---|---|---|---|---|---|---|---|---|---|
| ||||||||||
Municipalities and communities of Chickasaw County, Iowa, United States | ||
|---|---|---|
| Cities | Map of Iowa highlighting Chickasaw County | |
| Townships | ||
| Unincorporated communities | ||
| Footnotes | ‡This populated place also has portions in an adjacent county or counties | |
| ||

| Authority control |
|---|