Calhoun County, Iowa
Calhoun County is a county located in the U.S. state of Iowa. As of the 2010 census, the population was 9,670.[1] Its county seat is Rockwell City.[2]
Calhoun County | |
|---|---|
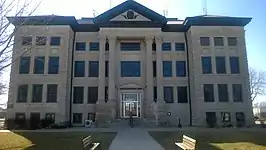 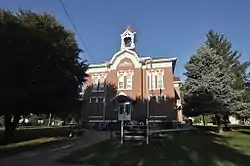 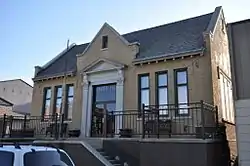 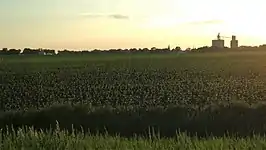 Clockwise from top: Calhoun County Courthouse in Rockwell City, the former Lake City Public Library, a grain elevator in the small town of Somers rises from a field at sunset, and the historic Central School in Lake City | |
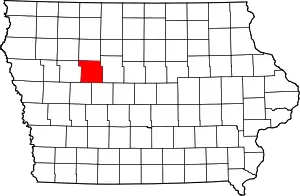 Location within the U.S. state of Iowa | |
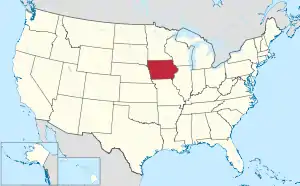 Iowa's location within the U.S. | |
| Coordinates: 42°23′10″N 94°38′50″W | |
| Country | |
| State | |
| Founded | 1855 |
| Named for | John C. Calhoun |
| Seat | Rockwell City |
| Largest city | Lake City |
| Area | |
| • Total | 572 sq mi (1,480 km2) |
| • Land | 570 sq mi (1,500 km2) |
| • Water | 2.1 sq mi (5 km2) 0.4% |
| Population (2010) | |
| • Total | 9,670 |
| • Estimate (2018) | 9,699 |
| • Density | 17/sq mi (6.5/km2) |
| Time zone | UTC−6 (Central) |
| • Summer (DST) | UTC−5 (CDT) |
| Congressional district | 4th |
| Website | www |
History
Calhoun County was formed on January 15, 1851 from open land originally named Fox County. It was renamed in 1853 after the seventh US Vice President secessionist John C. Calhoun. When the tracks of the Illinois Central Railroad were laid through the county in 1870, the county seat was moved from Lake City to Rockwell City. The first train reached Rockwell City on August 7, 1882 and the population count doubled in the same year. The first courthouse, built of wood, burned to the ground in 1884 and the county government moved into a nearby hotel. In 1913, the current courthouse was built.
On July 6, 1893, Pomeroy was struck by a tornado that measured F5 on the Fujita scale. With a damage path 500 yards (460 m) wide and 55 miles (89 km) long, the tornado destroyed about 80% of the homes in Pomeroy. The tornado killed 71 people and injured 200.
Geography
According to the U.S. Census Bureau, the county has a total area of 572 square miles (1,480 km2), of which 570 square miles (1,500 km2) is land and 2.1 square miles (5.4 km2) (0.4%) is water.[3]
Ecology
Calhoun County is located entirely within the Des Moines Lobe of the Western Corn Belt Plains ecoregion, as defined by the United States Environmental Protection Agency (EPA). One of the flattest regions in Iowa, the Des Moines Lobe ecoregion is a distinctive area naturally defined by Wisconsin glaciation but modified by humans for extensive agriculture. In general, the land is level to gently rolling with some areas of relief defined by glacial features like moraines, hummocky knobs, and kettles, and outwash deposits. The lobe does not have any loess deposits like the Loess Hills to the west.
The stream network is poorly developed and widely spaced, with major rivers carving valleys that are relatively deep and steep-sided. Almost all of the natural lakes of Iowa are found in the northern part of this region (the Iowa Great Lakes). Most of the region has been converted from wet prairie to agricultural use with substantial surface water drainage. Only a small fraction of the wetlands remain, and many natural lakes have been drained as a result of agricultural drainage projects via drainage tiles or ditches.[4]
Major highways
Adjacent counties
- Pocahontas County (north)
- Webster County (east)
- Greene County (southeast)
- Carroll County (southwest)
- Sac County (west)
Demographics
| Historical population | |||
|---|---|---|---|
| Census | Pop. | %± | |
| 1860 | 147 | — | |
| 1870 | 1,602 | 989.8% | |
| 1880 | 5,595 | 249.3% | |
| 1890 | 13,107 | 134.3% | |
| 1900 | 18,569 | 41.7% | |
| 1910 | 17,090 | −8.0% | |
| 1920 | 17,783 | 4.1% | |
| 1930 | 17,605 | −1.0% | |
| 1940 | 17,584 | −0.1% | |
| 1950 | 16,925 | −3.7% | |
| 1960 | 15,923 | −5.9% | |
| 1970 | 14,287 | −10.3% | |
| 1980 | 13,542 | −5.2% | |
| 1990 | 11,508 | −15.0% | |
| 2000 | 11,115 | −3.4% | |
| 2010 | 9,670 | −13.0% | |
| 2018 (est.) | 9,699 | [5] | 0.3% |
| U.S. Decennial Census[6] 1790-1960[7] 1900-1990[8] 1990-2000[9] 2010-2018[1] | |||
2010 census
The 2010 census recorded a population of 9,670 in the county, with a population density of 16.96/sq mi (6.55/km2). There were 5,108 housing units, of which 4,242 were occupied.[10]
2000 census
As of the census[11] of 2000, there were 11,115 people, 4,513 households, and 3,014 families residing in the county. The population density was 20 people per square mile (8/km2). There were 5,219 housing units at an average density of 9 per square mile (4/km2). The racial makeup of the county was 98.06% White, 0.69% Black or African American, 0.20% Native American, 0.18% Asian, 0.01% Pacific Islander, 0.34% from other races, and 0.52% from two or more races. 0.90% of the population were Hispanic or Latino of any race.
There were 4,513 households, out of which 27.80% had children under the age of 18 living with them, 57.90% were married couples living together, 6.60% had a female householder with no husband present, and 33.20% were non-families. 30.50% of all households were made up of individuals, and 17.80% had someone living alone who was 65 years of age or older. The average household size was 2.31 and the average family size was 2.87.
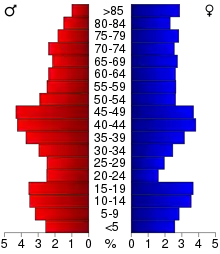
In the county, the population was spread out, with 23.10% under the age of 18, 6.40% from 18 to 24, 24.80% from 25 to 44, 23.70% from 45 to 64, and 22.10% who were 65 years of age or older. The median age was 42 years. For every 100 females there were 98.10 males. For every 100 females age 18 and over, there were 97.60 males.
The median income for a household in the county was $33,286, and the median income for a family was $41,583. Males had a median income of $28,787 versus $20,095 for females. The per capita income for the county was $17,498. 10.10% of the population and 7.10% of families were below the poverty line. Out of the total population, 13.50% of those under the age of 18 and 8.50% of those 65 and older were living below the poverty line.
Communities
Cities
Unincorporated communities
Townships
Calhoun County is divided into sixteen townships:
Population ranking
The population ranking of the following table is based on the 2010 census of Calhoun County.[12]
† county seat
| Rank | City/Town/etc. | Municipal type | Population (2010 Census) |
|---|---|---|---|
| 1 | Lake City | City | 1,727 |
| 2 | † Rockwell City | City | 1,709 |
| 3 | Manson | City | 1,690 |
| 4 | Pomeroy | City | 662 |
| 5 | Farnhamville (partially in Webster County) | City | 371 (371 total) |
| 6 | Lohrville | City | 368 |
| 7 | Twin Lakes | CDP | 334 |
| 9 | Somers | City | 113 |
| 10 | Knierim | City | 60 |
| 11 | Rinard | City | 52 |
| 8 | Lytton (mostly in Sac County) | City | 43 (315 total) |
| 12 | Jolley | City | 41 |
| 13 | Yetter | City | 34 |
Politics
Politically, Calhoun County has favoured the Republicans since 1896, usually only voting Democrat when the party won national victories. It first voted for the Democrats in 1932 when Franklin D. Roosevelt won in a landslide victory against Herbert Hoover. In 2000, Calhoun County voted for George W. Bush and has voted for the Republicans ever since. In 2016 Donald Trump won 67.7% percent of the vote in Calhoun County, the highest vote share since Dwight D. Eisenhower’s victory in 1952.
| Year | Republican | Democratic | Third Parties |
|---|---|---|---|
| 2020 | 70.2% 3,689 | 28.0% 1,470 | 1.9% 99 |
| 2016 | 67.2% 3,468 | 27.1% 1,398 | 5.7% 293 |
| 2012 | 55.3% 2,891 | 42.8% 2,238 | 1.9% 101 |
| 2008 | 52.8% 2,741 | 45.1% 2,341 | 2.2% 113 |
| 2004 | 58.7% 3,255 | 40.5% 2,243 | 0.8% 44 |
| 2000 | 55.1% 2,776 | 42.3% 2,132 | 2.6% 133 |
| 1996 | 43.5% 2,077 | 45.9% 2,193 | 10.7% 509 |
| 1992 | 41.1% 2,169 | 40.6% 2,140 | 18.3% 965 |
| 1988 | 44.9% 2,474 | 54.3% 2,990 | 0.7% 41 |
| 1984 | 56.1% 3,311 | 43.1% 2,541 | 0.8% 46 |
| 1980 | 57.4% 3,633 | 34.0% 2,150 | 8.6% 545 |
| 1976 | 51.0% 3,215 | 47.6% 3,001 | 1.3% 84 |
| 1972 | 60.0% 3,821 | 38.4% 2,446 | 1.6% 101 |
| 1968 | 57.5% 3,715 | 36.6% 2,361 | 5.9% 382 |
| 1964 | 35.4% 2,422 | 64.5% 4,407 | 0.1% 8 |
| 1960 | 58.9% 4,485 | 41.0% 3,123 | 0.1% 7 |
| 1956 | 57.5% 4,409 | 38.8% 2,972 | 3.8% 288 |
| 1952 | 67.7% 5,391 | 30.3% 2,411 | 2.1% 164 |
| 1948 | 48.2% 3,083 | 49.5% 3,164 | 2.4% 151 |
| 1944 | 48.6% 3,375 | 51.0% 3,544 | 0.4% 27 |
| 1940 | 46.5% 3,792 | 53.2% 4,344 | 0.3% 25 |
| 1936 | 39.3% 3,027 | 59.0% 4,544 | 1.7% 128 |
| 1932 | 34.5% 2,404 | 62.6% 4,368 | 2.9% 205 |
| 1928 | 60.2% 4,136 | 39.1% 2,681 | 0.7% 49 |
| 1924 | 53.2% 3,529 | 10.8% 714 | 36.0% 2,389 |
| 1920 | 77.0% 5,277 | 21.6% 1,479 | 1.5% 102 |
| 1916 | 58.3% 2,276 | 38.8% 1,515 | 2.8% 110 |
| 1912 | 26.6% 963 | 32.7% 1,182 | 40.7% 1,474 |
| 1908 | 63.0% 2,353 | 30.9% 1,152 | 6.1% 228 |
| 1904 | 67.4% 2,479 | 23.7% 870 | 8.9% 327 |
| 1900 | 69.6% 2,973 | 28.7% 1,224 | 1.7% 74 |
| 1896 | 67.3% 2,698 | 31.9% 1,280 | 0.9% 34 |
See also
References
- "State & County QuickFacts". United States Census Bureau. Archived from the original on July 7, 2011. Retrieved July 14, 2014.
- "Find a County". National Association of Counties. Archived from the original on May 31, 2011. Retrieved June 7, 2011.
- "US Gazetteer files: 2010, 2000, and 1990". United States Census Bureau. February 12, 2011. Retrieved April 23, 2011.
-
 This article incorporates public domain material from the United States Geological Survey document: Chapman, S.S., Omernik, J.M., Griffith, G.E.; et al. "Ecoregions of Iowa and Missouri" (PDF).CS1 maint: multiple names: authors list (link) (color poster with map, descriptive text, summary tables, and photographs)
 - "Population and Housing Unit Estimates". Retrieved June 24, 2019.
- "U.S. Decennial Census". United States Census Bureau. Retrieved July 14, 2014.
- "Historical Census Browser". University of Virginia Library. Retrieved July 14, 2014.
- "Population of Counties by Decennial Census: 1900 to 1990". United States Census Bureau. Retrieved July 14, 2014.
- "Census 2000 PHC-T-4. Ranking Tables for Counties: 1990 and 2000" (PDF). United States Census Bureau. Retrieved July 14, 2014.
- "Population and Housing Occupancy Status: 2010 - State -- County". United States Census Bureau American FactFinder. Retrieved March 8, 2011.
- "U.S. Census website". United States Census Bureau. Retrieved January 31, 2008.
- "Archived copy". Retrieved February 10, 2013.
- Leip, David. "Dave Leip's Atlas of U.S. Presidential Elections". uselectionatlas.org. Retrieved April 25, 2018.
External links
| Wikimedia Commons has media related to Calhoun County, Iowa. |
Places adjacent to Calhoun County, Iowa | ||||||||||
|---|---|---|---|---|---|---|---|---|---|---|
| ||||||||||
Municipalities and communities of Calhoun County, Iowa, United States | ||
|---|---|---|
| Cities | Map of Iowa highlighting Calhoun County | |
| Townships | ||
| CDP | ||
| Other unincorporated communities | ||
| Footnotes | ‡This populated place also has portions in an adjacent county or counties | |
| ||

| Authority control |
|---|