Burt County, Nebraska
Burt County is a county in the U.S. state of Nebraska, bordering the west bank of the upper Missouri River. As of the 2010 United States Census, the population was 6,858.[1] Its county seat is Tekamah.[2] The county was formed in 1854 and named after Francis Burt, the first governor of Nebraska Territory.[3]
Burt County | |
|---|---|
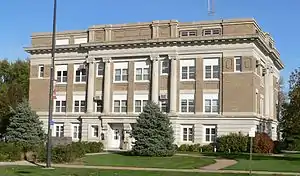 Burt County Courthouse in Tekamah | |
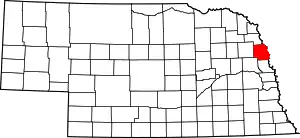 Location within the U.S. state of Nebraska | |
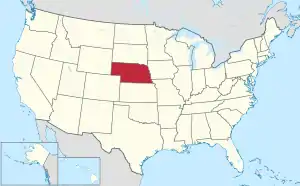 Nebraska's location within the U.S. | |
| Coordinates: 41°51′N 96°19′W | |
| Country | |
| State | |
| Founded | 1854 |
| Named for | Francis Burt |
| Seat | Tekamah |
| Largest city | Tekamah |
| Area | |
| • Total | 497 sq mi (1,290 km2) |
| • Land | 492 sq mi (1,270 km2) |
| • Water | 5.5 sq mi (14 km2) 1.1%% |
| Population | |
| • Estimate (2018) | 6,488 |
| • Density | 13.3/sq mi (5.1/km2) |
| Time zone | UTC−6 (Central) |
| • Summer (DST) | UTC−5 (CDT) |
| Congressional district | 1st |
| Website | www |
In the Nebraska license plate system, Burt County is represented by the prefix 31 (it had the 31st-largest number of vehicles registered in the county when the license plate system was established in 1922).
Geography
According to the US Census Bureau, the county has an area of 497 square miles (1,290 km2), of which 492 square miles (1,270 km2) is land and 5.5 square miles (14 km2) (1.1%) is water.[4] Its east boundary line is formed by the western border of the state of Iowa, a boundary mostly aligning with the Missouri River. Because of shifts in the river over time, small portions of the county are now located on the eastern bank of the river.
Major highways
Adjacent counties
- Thurston County - north
- Monona County, Iowa - northeast
- Harrison County, Iowa - southeast
- Washington County - south
- Dodge County - southwest
- Cuming County - west
Demographics
| Historical population | |||
|---|---|---|---|
| Census | Pop. | %± | |
| 1860 | 388 | — | |
| 1870 | 2,847 | 633.8% | |
| 1880 | 6,937 | 143.7% | |
| 1890 | 11,609 | 67.3% | |
| 1900 | 13,040 | 12.3% | |
| 1910 | 12,726 | −2.4% | |
| 1920 | 12,559 | −1.3% | |
| 1930 | 13,062 | 4.0% | |
| 1940 | 12,546 | −4.0% | |
| 1950 | 11,536 | −8.1% | |
| 1960 | 10,192 | −11.7% | |
| 1970 | 9,247 | −9.3% | |
| 1980 | 8,813 | −4.7% | |
| 1990 | 7,868 | −10.7% | |
| 2000 | 7,791 | −1.0% | |
| 2010 | 6,858 | −12.0% | |
| 2018 (est.) | 6,488 | [5] | −5.4% |
| US Decennial Census[6] 1790-1960[7] 1900-1990[8] 1990-2000[9] 2010-2013[1] | |||
As of the 2000 United States Census,[10] there were 7,791 people, 3,155 households, and 2,240 families in the county. The population density was 16 people per square mile (6/km2). There were 3,723 housing units at an average density of 8 per square mile (3/km2). The racial makeup of the county was 97.63% White, 0.18% Black or African American, 1.07% Native American, 0.19% Asian, 0.03% Pacific Islander, 0.22% from other races, and 0.69% from two or more races. 1.26% of the population were Hispanic or Latino of any race. 33.7% were of German, 13.9% Swedish, 10.1% Irish, 8.8% American, 7.0% English and 5.4% Danish ancestry according to Census 2000.
There were 3,155 households, out of which 29.50% had children under the age of 18 living with them, 61.30% were married couples living together, 6.20% had a female householder with no husband present, and 29.00% were non-families. 26.50% of all households were made up of individuals, and 15.60% had someone living alone who was 65 years of age or older. The average household size was 2.43 and the average family size was 2.93.
The county population contained 25.70% under the age of 18, 5.40% from 18 to 24, 23.40% from 25 to 44, 23.80% from 45 to 64, and 21.80% who were 65 years of age or older. The median age was 42 years. For every 100 females there were 93.80 males. For every 100 females age 18 and over, there were 91.80 males.
The median income for a household in the county was $33,954, and the median income for a family was $40,515. Males had a median income of $28,750 versus $20,663 for females. The per capita income for the county was $16,654. About 6.60% of families and 8.90% of the population were below the poverty line, including 11.80% of those under age 18 and 8.30% of those age 65 or over.
Communities
Townships
Politics
Burt County voters have historically voted Republican. No Democratic Party candidate has carried the county in a national election since 1936.
| Year | Republican | Democratic | Third Parties |
|---|---|---|---|
| 2016 | 66.5% 2,367 | 26.1% 930 | 7.3% 261 |
| 2012 | 60.1% 2,029 | 38.3% 1,291 | 1.6% 55 |
| 2008 | 56.3% 1,907 | 41.7% 1,413 | 2.0% 67 |
| 2004 | 64.0% 2,349 | 34.7% 1,272 | 1.3% 47 |
| 2000 | 60.6% 2,056 | 36.1% 1,223 | 3.3% 113 |
| 1996 | 48.8% 1,707 | 35.4% 1,237 | 15.8% 552 |
| 1992 | 42.6% 1,667 | 31.3% 1,224 | 26.1% 1,021 |
| 1988 | 58.1% 2,050 | 41.3% 1,458 | 0.7% 23 |
| 1984 | 71.1% 2,645 | 28.3% 1,054 | 0.6% 22 |
| 1980 | 72.1% 2,806 | 20.9% 814 | 7.0% 273 |
| 1976 | 63.3% 2,510 | 34.7% 1,375 | 2.1% 82 |
| 1972 | 76.5% 2,937 | 23.5% 900 | |
| 1968 | 68.6% 2,615 | 24.6% 937 | 6.9% 263 |
| 1964 | 54.3% 2,459 | 45.8% 2,074 | |
| 1960 | 72.6% 3,613 | 27.4% 1,366 | |
| 1956 | 69.5% 3,459 | 30.5% 1,519 | |
| 1952 | 77.0% 4,154 | 23.0% 1,243 | |
| 1948 | 58.3% 2,656 | 41.7% 1,900 | |
| 1944 | 59.6% 3,189 | 40.4% 2,162 | |
| 1940 | 57.1% 3,443 | 42.9% 2,589 | |
| 1936 | 45.9% 2,710 | 52.9% 3,120 | 1.2% 71 |
| 1932 | 32.8% 1,857 | 66.0% 3,734 | 1.2% 65 |
| 1928 | 66.3% 3,551 | 33.3% 1,783 | 0.4% 19 |
| 1924 | 54.3% 2,813 | 36.1% 1,870 | 9.6% 496 |
| 1920 | 70.2% 2,969 | 28.2% 1,194 | 1.5% 65 |
| 1916 | 50.3% 1,508 | 47.6% 1,425 | 2.1% 63 |
| 1912 | 29.1% 865 | 35.0% 1,040 | 35.8% 1,064[12] |
| 1908 | 59.5% 1,880 | 38.5% 1,215 | 2.0% 63 |
| 1904 | 72.2% 2,081 | 18.3% 528 | 9.4% 272 |
| 1900 | 61.3% 1,929 | 37.3% 1,174 | 1.4% 44 |
References
- "State & County QuickFacts". US Census Bureau. Archived from the original on July 7, 2011. Retrieved September 17, 2013.
- "Find a County". National Association of Counties. Archived from the original on May 31, 2011. Retrieved June 7, 2011.
- "Archived copy". Archived from the original on July 20, 2008. Retrieved March 15, 2008.CS1 maint: archived copy as title (link)
- "2010 Census Gazetteer Files". US Census Bureau. August 22, 2012. Archived from the original on November 13, 2013. Retrieved December 6, 2014.
- "Population and Housing Unit Estimates". Retrieved December 28, 2019.
- "US Decennial Census". US Census Bureau. Retrieved December 6, 2014.
- "Historical Census Browser". University of Virginia Library. Retrieved December 6, 2014.
- "Population of Counties by Decennial Census: 1900 to 1990". US Census Bureau. Retrieved December 6, 2014.
- "Census 2000 PHC-T-4. Ranking Tables for Counties: 1990 and 2000" (PDF). US Census Bureau. Retrieved December 6, 2014.
- "U.S. Census website". US Census Bureau. Retrieved January 31, 2008.
- Election Results
- The leading "other" candidate, Progressive Theodore Roosevelt, received 1,003 votes, while Socialist candidate Eugene Debs received 41 votes and Prohibition Eugene Chafin received 20 votes.
Places adjacent to Burt County, Nebraska | ||||||||||
|---|---|---|---|---|---|---|---|---|---|---|
| ||||||||||
Municipalities and communities of Burt County, Nebraska, United States | ||
|---|---|---|
| Cities | Map of Nebraska highlighting Burt County | |
| Villages | ||
| Unincorporated communities | ||
| Townships | ||
| Indian reservations | ||
| Ghost towns | ||
| Footnotes | ‡This populated place also has portions in an adjacent county or counties | |
| ||
| Authority control |
|---|