Hitchcock County, Nebraska
Hitchcock County is a county in the U.S. state of Nebraska. As of the 2010 United States Census, the population was 2,908.[1] Its county seat is Trenton.[2]
Hitchcock County | |
|---|---|
_courthouse_from_SW.JPG.webp) Hitchcock County courthouse in Trenton | |
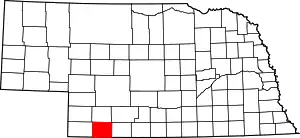 Location within the U.S. state of Nebraska | |
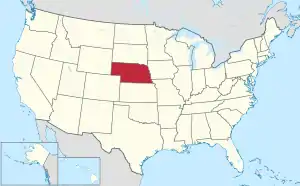 Nebraska's location within the U.S. | |
| Coordinates: 40°11′N 101°02′W | |
| Country | |
| State | |
| Founded | 1873 |
| Named for | Phineas Hitchcock |
| Seat | Trenton |
| Largest village | Culbertson |
| Area | |
| • Total | 718 sq mi (1,860 km2) |
| • Land | 710 sq mi (1,800 km2) |
| • Water | 8.5 sq mi (22 km2) 1.2%% |
| Population | |
| • Estimate (2017) | 2,834 |
| • Density | 4.0/sq mi (1.5/km2) |
| Time zone | UTC−6 (Central) |
| • Summer (DST) | UTC−5 (CDT) |
| Congressional district | 3rd |
| Website | www |
In the Nebraska license plate system, Hitchcock County is represented by the prefix 67 (it had the sixty-seventh-largest number of vehicles registered in the county when the license plate system was established in 1922).
History
Hitchcock County was formed in 1873.[3] It was named for US Senator Phineas Warren Hitchcock.[4]
The Massacre Canyon battle between Sioux and Pawnee took place on August 5, 1873 at a spot three miles east of Trenton.
Geography
The terrain of Hitchcock County consists of rolling low hills. The flattened hilltops are used for agriculture; mostly dry farming with some center pivot irrigation. The Republican River flows eastward through the central part of the county. The county has a total area of 718 square miles (1,860 km2), of which 710 square miles (1,800 km2) is land and 8.5 square miles (22 km2) (1.2%) is water.[5]
The eastern two-thirds of the state of Nebraska observes Central Time; the western portion of the state observes Mountain Time. Hitchcock County is the westernmost county to observe Central Time.[6]
Lakes
- Swanson Lake: formed by a dam on the Republican River, between Stratton and Trenton.
Major highways
Adjacent counties
- Red Willow County – east
- Rawlins County, Kansas – south
- Dundy County – west (Mountain Time border)
- Hayes County – north
- Frontier County –northeast
Demographics
| Historical population | |||
|---|---|---|---|
| Census | Pop. | %± | |
| 1880 | 1,012 | — | |
| 1890 | 5,799 | 473.0% | |
| 1900 | 4,409 | −24.0% | |
| 1910 | 5,415 | 22.8% | |
| 1920 | 6,045 | 11.6% | |
| 1930 | 7,269 | 20.2% | |
| 1940 | 6,404 | −11.9% | |
| 1950 | 5,867 | −8.4% | |
| 1960 | 4,829 | −17.7% | |
| 1970 | 4,051 | −16.1% | |
| 1980 | 4,079 | 0.7% | |
| 1990 | 3,750 | −8.1% | |
| 2000 | 3,111 | −17.0% | |
| 2010 | 2,908 | −6.5% | |
| 2017 (est.) | 2,834 | [7] | −2.5% |
| US Decennial Census[8] 1790-1960[9] 1900-1990[10] 1990-2000[11] 2010-2013[1] | |||
As of the 2000 United States Census,[12] there were 3,111 people, 1,287 households, and 899 families in the county. The population density was 4 people per square mile (2/km2). There were 1,675 housing units at an average density of 2 per square mile (1/km2). The racial makeup of the county was 98.36% White, 0.10% Black or African American, 0.29% Native American, 0.13% Asian, 0.29% from other races, and 0.84% from two or more races. 1.41% of the population were Hispanic or Latino of any race.
There were 1,287 households, out of which 28.00% had children under the age of 18 living with them, 61.10% were married couples living together, 6.40% had a female householder with no husband present, and 30.10% were non-families. 27.40% of all households were made up of individuals, and 15.50% had someone living alone who was 65 years of age or older. The average household size was 2.37 and the average family size was 2.89.
The county population contained 23.80% under the age of 18, 5.90% from 18 to 24, 22.60% from 25 to 44, 25.40% from 45 to 64, and 22.30% who were 65 years of age or older. The median age was 44 years. For every 100 females there were 95.00 males. For every 100 females age 18 and over, there were 92.60 males.
The median income for a household in the county was $28,287, and the median income for a family was $34,490. Males had a median income of $25,833 versus $18,879 for females. The per capita income for the county was $14,804. About 10.90% of families and 14.90% of the population were below the poverty line, including 22.90% of those under age 18 and 8.40% of those age 65 or over.
Communities
- Culbertson
- Palisade (partial)
- Stratton
- Trenton (county seat)
Politics
Hitchcock County is strongly Republican in presidential elections. Since 1900, the county has failed to back the Republican candidate in only five presidential elections, most recently in 1936 in the midst of Franklin D. Roosevelt's national landslide victory. Republicans also hold a voter registration advantage of 1,326 registered Republicans compared with just 262 registered Democrats in Hitchcock County as of 2021.[15]
| Year | Republican | Democratic | Third Parties |
|---|---|---|---|
| 2020 | 86.0% 1,264 | 11.9% 175 | 2.1% 31 |
| 2016 | 83.9% 1,232 | 11.0% 161 | 5.1% 75 |
| 2012 | 78.8% 1,178 | 18.3% 274 | 2.9% 43 |
| 2008 | 72.6% 1,001 | 25.1% 346 | 2.3% 32 |
| 2004 | 78.8% 1,171 | 19.9% 296 | 1.3% 19 |
| 2000 | 76.1% 1,126 | 21.1% 312 | 2.8% 42 |
| 1996 | 62.3% 977 | 26.1% 409 | 11.7% 183 |
| 1992 | 47.6% 824 | 20.7% 359 | 31.7% 548 |
| 1988 | 69.5% 1,132 | 29.5% 480 | 1.1% 18 |
| 1984 | 80.0% 1,391 | 19.6% 341 | 0.4% 7 |
| 1980 | 75.1% 1,474 | 16.8% 329 | 8.2% 160 |
| 1976 | 51.9% 898 | 45.4% 786 | 2.8% 48 |
| 1972 | 78.6% 1,339 | 21.4% 364 | |
| 1968 | 66.9% 1,173 | 22.1% 387 | 11.0% 193 |
| 1964 | 54.8% 1,149 | 45.2% 946 | |
| 1960 | 70.7% 1,634 | 29.3% 678 | |
| 1956 | 67.9% 1,570 | 32.1% 741 | |
| 1952 | 75.0% 2,008 | 25.0% 669 | |
| 1948 | 56.7% 1,208 | 43.3% 923 | |
| 1944 | 64.0% 1,556 | 36.1% 877 | |
| 1940 | 58.3% 1,663 | 41.7% 1,188 | |
| 1936 | 42.2% 1,285 | 57.1% 1,738 | 0.7% 22 |
| 1932 | 39.2% 1,168 | 59.4% 1,772 | 1.4% 43 |
| 1928 | 73.7% 2,022 | 25.5% 698 | 0.8% 23 |
| 1924 | 45.8% 987 | 29.4% 633 | 24.8% 535 |
| 1920 | 61.6% 1,127 | 33.6% 615 | 4.8% 88 |
| 1916 | 36.2% 435 | 60.9% 733 | 2.9% 35 |
| 1912 | 12.1% 128 | 44.6% 471 | 43.3% 458 |
| 1908 | 48.8% 633 | 48.8% 632 | 2.4% 31 |
| 1904 | 61.1% 598 | 17.0% 166 | 22.0% 215 |
| 1900 | 45.4% 450 | 53.2% 528 | 1.4% 14 |
References
- "State & County QuickFacts". United States Census Bureau. Archived from the original on June 7, 2011. Retrieved September 20, 2013.
- "Find a County". National Association of Counties. Archived from the original on 31 May 2011. Retrieved 7 June 2011.
- Burr, George L. (1921). History of Hamilton and Clay Counties, Nebraska, Vol. 1. S.J. Clarke Pub. Co. p. 118.
- Gannett, Henry (1905). The Origin of Certain Place Names in the United States. Govt. Print. Off. p. 157.
- "2010 Census Gazetteer Files". US Census Bureau. August 22, 2012. Archived from the original on November 13, 2013. Retrieved December 8, 2014.
- "Map of Central/Mountain Time Zone Division Line". Retrieved January 22, 2019.
- "Population and Housing Unit Estimates". Retrieved 21 January 2019.
- "US Decennial Census". US Census Bureau. Retrieved December 8, 2014.
- "Historical Census Browser". University of Virginia Library. Retrieved December 8, 2014.
- "Population of Counties by Decennial Census: 1900 to 1990". US Census Bureau. Retrieved December 8, 2014.
- "Census 2000 PHC-T-4. Ranking Tables for Counties: 1990 and 2000" (PDF). US Census Bureau. Retrieved December 8, 2014.
- "U.S. Census website". US Census Bureau. Retrieved 31 January 2008.
- Cornell (Hitchcock County) NE
- Cornell Church Google Maps (accessed 22 January 2019)
- "2021 Eligible Voter Statistics". Nebraska Secretary of State. January 8, 2021. Retrieved January 18, 2021.
- Election Results
External links
| Wikimedia Commons has media related to Hitchcock County, Nebraska. |
Places adjacent to Hitchcock County, Nebraska | ||||||||||
|---|---|---|---|---|---|---|---|---|---|---|
| ||||||||||
Municipalities and communities of Hitchcock County, Nebraska, United States | ||
|---|---|---|
| Villages | Map of Nebraska highlighting Hitchcock County | |
| Unincorporated community | ||
| Footnotes | ‡This populated place also has portions in an adjacent county or counties | |
| ||