Grant County, Nebraska
Grant County is a county in the U.S. state of Nebraska. As of the 2010 United States Census, the population was 614,[1] making it the fourth-least populous county in Nebraska and the ninth-least populous county in the United States. Its county seat is Hyannis.[2] The county was founded in 1887 and named for Ulysses S. Grant, 18th President of the United States.[3]
Grant County | |
|---|---|
 Grant County Courthouse in Hyannis | |
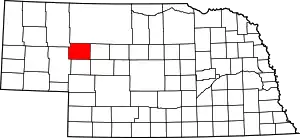 Location within the U.S. state of Nebraska | |
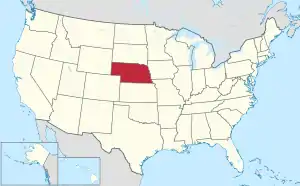 Nebraska's location within the U.S. | |
| Coordinates: 41°55′N 101°44′W | |
| Country | |
| State | |
| Founded | 31 March 1887 |
| Named for | Ulysses S. Grant |
| Seat | Hyannis |
| Largest village | Hyannis |
| Area | |
| • Total | 783 sq mi (2,030 km2) |
| • Land | 776 sq mi (2,010 km2) |
| • Water | 7.0 sq mi (18 km2) 0.9%% |
| Population | |
| • Estimate (2017) | 649 |
| • Density | 0.8/sq mi (0.3/km2) |
| Time zone | UTC−7 (Mountain) |
| • Summer (DST) | UTC−6 (MDT) |
| Congressional district | 3rd |
In the Nebraska license plate system, Grant County is represented by the prefix 92 (it had the ninety-second-largest number of vehicles registered in the county when the license plate system was established in 1922).
Geography
Grant County terrain is characterized by continuous waves of east–west oriented rolling hillocks on otherwise flat areas. As a result, the county is dotted with small lakes and reservoirs.[4]
According to the US Census Bureau, the county has a total area of 783 square miles (2,030 km2), of which 776 square miles (2,010 km2) is land and 7.0 square miles (18 km2) (0.9%) is water.[5]
Major highways
Adjacent counties
- Cherry County (north)
- Hooker County (east)
- Arthur County (south)
- Garden County (west)
- Sheridan County (northwest)
Demographics
| Historical population | |||
|---|---|---|---|
| Census | Pop. | %± | |
| 1890 | 458 | — | |
| 1900 | 763 | 66.6% | |
| 1910 | 1,097 | 43.8% | |
| 1920 | 1,486 | 35.5% | |
| 1930 | 1,427 | −4.0% | |
| 1940 | 1,327 | −7.0% | |
| 1950 | 1,057 | −20.3% | |
| 1960 | 1,009 | −4.5% | |
| 1970 | 1,019 | 1.0% | |
| 1980 | 877 | −13.9% | |
| 1990 | 769 | −12.3% | |
| 2000 | 747 | −2.9% | |
| 2010 | 614 | −17.8% | |
| 2017 (est.) | 649 | [6] | 5.7% |
| US Decennial Census[7] 1790-1960[8] 1900-1990[9] 1990-2000[10] 2010-2013[1] | |||
As of the 2000 United States Census,[11] there were 747 people, 292 households, and 226 families residing in the county. The population density was 0.95 people per square mile (0.37/km2). There were 449 housing units at an average density of 0.57 per square mile (0.22/km2). The racial makeup of the county was 98.80% White, 0.13% Native American, 0.27% Asian, 0.80% from other races. 1.34% of the population were Hispanic or Latino of any race.
There were 292 households, out of which 37.00% had children under the age of 18 living with them, 67.50% were married couples living together, 6.50% had a female householder with no husband present, and 22.60% were non-families. 22.30% of all households were made up of individuals, and 8.90% had someone living alone who was 65 years of age or older. The average household size was 2.56 and the average family size was 2.98.
The county population contained 29.20% under the age of 18, 5.20% from 18 to 24, 24.40% from 25 to 44, 27.60% from 45 to 64, and 13.70% who were 65 years of age or older. The median age was 40 years. For every 100 females there were 114.00 males. For every 100 females age 18 and over, there were 105.80 males.
The median income for a household in the county was $34,821, and the median income for a family was $37,011. Males had a median income of $26,319 versus $14,417 for females. The per capita income for the county was $14,815. About 8.20% of families and 9.70% of the population were below the poverty line, including 16.70% of those under age 18 and 0.00% of those age 65 or over.
Politics
Grant County voters are strongly Republican. In no national election since 1936 has the county selected the Democratic Party candidate. In 2020, Donald Trump won the highest share of the vote ever in the county at 93.3%.
| Year | Republican | Democratic | Third Parties |
|---|---|---|---|
| 2020 | 93.3% 375 | 5.0% 20 | 1.7% 7 |
| 2016 | 90.6% 367 | 4.9% 20 | 4.4% 18 |
| 2012 | 88.7% 322 | 8.3% 30 | 3.0% 11 |
| 2008 | 86.7% 318 | 11.2% 41 | 2.2% 8 |
| 2004 | 88.9% 352 | 10.4% 41 | 0.8% 3 |
| 2000 | 84.2% 324 | 12.7% 49 | 3.1% 12 |
| 1996 | 64.8% 258 | 21.1% 84 | 14.1% 56 |
| 1992 | 55.0% 247 | 16.7% 75 | 28.3% 127 |
| 1988 | 76.8% 301 | 22.7% 89 | 0.5% 2 |
| 1984 | 88.5% 406 | 11.1% 51 | 0.4% 2 |
| 1980 | 80.2% 373 | 16.3% 76 | 3.5% 16 |
| 1976 | 70.4% 314 | 26.0% 116 | 3.6% 16 |
| 1972 | 84.5% 376 | 15.5% 69 | |
| 1968 | 74.9% 311 | 20.2% 84 | 4.8% 20 |
| 1964 | 60.4% 304 | 39.6% 199 | |
| 1960 | 76.4% 410 | 23.7% 127 | |
| 1956 | 83.3% 433 | 16.7% 87 | |
| 1952 | 81.2% 452 | 18.9% 105 | |
| 1948 | 66.3% 273 | 33.7% 139 | |
| 1944 | 65.5% 327 | 34.5% 172 | |
| 1940 | 63.5% 423 | 36.5% 243 | |
| 1936 | 45.3% 267 | 54.4% 321 | 0.3% 2 |
| 1932 | 37.4% 251 | 58.9% 395 | 3.7% 25 |
| 1928 | 70.9% 398 | 28.5% 160 | 0.5% 3 |
| 1924 | 48.7% 260 | 35.8% 191 | 15.6% 83 |
| 1920 | 64.2% 256 | 35.3% 141 | 0.5% 2 |
| 1916 | 38.6% 157 | 59.2% 241 | 2.2% 9 |
| 1912 | 34.8% 82 | 39.4% 93 | 25.8% 61 |
| 1908 | 47.7% 93 | 51.8% 101 | 0.5% 1 |
| 1904 | 66.9% 113 | 29.0% 49 | 4.1% 7 |
| 1900 | 59.2% 148 | 38.8% 97 | 2.0% 5 |
References
- "State & County QuickFacts". US Census Bureau. Archived from the original on June 7, 2011. Retrieved September 20, 2013.
- "Find a County". National Association of Counties. Archived from the original on 31 May 2011. Retrieved 7 June 2011.
- Gannett, Henry (1905). The Origin of Certain Place Names in the United States. Govt. Print. Off. p. 141.
- Grant County Google Maps (accessed 21 January 2019)
- "2010 Census Gazetteer Files". US Census Bureau. August 22, 2012. Archived from the original on November 13, 2013. Retrieved December 7, 2014.
- "Population and Housing Unit Estimates". Retrieved 21 January 2019.
- "US Decennial Census". US Census Bureau. Retrieved December 7, 2014.
- "Historical Census Browser". University of Virginia Library. Retrieved December 7, 2014.
- "Population of Counties by Decennial Census: 1900 to 1990". US Census Bureau. Retrieved December 7, 2014.
- "Census 2000 PHC-T-4. Ranking Tables for Counties: 1990 and 2000" (PDF). US Census Bureau. Retrieved December 7, 2014.
- "U.S. Census website". US Census Bureau. Retrieved 31 January 2008.
- Election Results
Places adjacent to Grant County, Nebraska | ||||||||||
|---|---|---|---|---|---|---|---|---|---|---|
| ||||||||||
Municipalities and communities of Grant County, Nebraska, United States | ||
|---|---|---|
| Village | Map of Nebraska highlighting Grant County | |
| Unincorporated communities | ||
| ||

| Authority control |
|---|