Boyd County, Nebraska
Boyd County is a county in the State of Nebraska. As of the 2010 United States Census, the population was 2,099.[1] Its county seat is Butte.[2] The county was formed in 1891[3] and named after James E. Boyd, the Nebraska Governor at the time.[4]
Boyd County | |
|---|---|
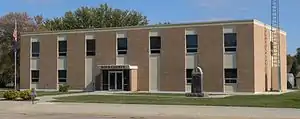 Boyd County Courthouse in Butte | |
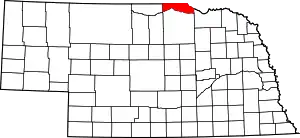 Location within the U.S. state of Nebraska | |
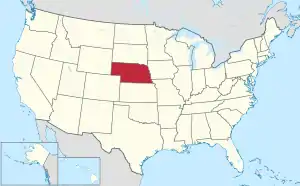 Nebraska's location within the U.S. | |
| Coordinates: 42°54′N 98°46′W | |
| Country | |
| State | |
| Founded | March 20, 1891 |
| Named for | James E. Boyd |
| Seat | Butte |
| Largest village | Spencer |
| Area | |
| • Total | 545 sq mi (1,410 km2) |
| • Land | 540 sq mi (1,400 km2) |
| • Water | 4.6 sq mi (12 km2) 0.8%% |
| Population | |
| • Estimate (2018) | 1,955 |
| • Density | 3.66/sq mi (1.41/km2) |
| Time zone | UTC−6 (Central) |
| • Summer (DST) | UTC−5 (CDT) |
| Congressional district | 3rd |
| Website | www |
In the Nebraska license plate system, Boyd County is represented by the prefix 63 (it had the 63rd-largest number of vehicles registered in the county when the license plate system was established in 1922).
In the 2010 United States Census, three incorporated villages had populations of fewer than 10 people: Anoka, population 6, Gross, population 2, and Monowi, population 1. Monowi was the only incorporated city in the United States with only one resident at the 2010 census.[5]
All land north of the Keya Paha River (which includes most of Boyd County and a smaller portion of neighboring Keya Paha County) was not originally part of Nebraska at the time of statehood, but was transferred from Dakota Territory in 1882.
Geography
According to the US Census Bureau, the county has an area of 545 square miles (1,410 km2), of which 540 square miles (1,400 km2) is land and 4.6 square miles (12 km2) (0.8%) is water.[6]
Boyd County is in Nebraska's Outback region.[7]
Major highways
 U.S. Highway 281
 Nebraska Highway 11
 Nebraska Highway 12
Adjacent counties
- Charles Mix County, South Dakota - northeast
- Knox County - southeast
- Holt County - south
- Rock County - southwest
- Keya Paha County - west
- Gregory County, South Dakota - northwest
National protected areas
Demographics
| Historical population | |||
|---|---|---|---|
| Census | Pop. | %± | |
| 1890 | 695 | — | |
| 1900 | 7,332 | 955.0% | |
| 1910 | 8,826 | 20.4% | |
| 1920 | 8,243 | −6.6% | |
| 1930 | 7,169 | −13.0% | |
| 1940 | 6,060 | −15.5% | |
| 1950 | 4,911 | −19.0% | |
| 1960 | 4,513 | −8.1% | |
| 1970 | 3,752 | −16.9% | |
| 1980 | 3,331 | −11.2% | |
| 1990 | 2,835 | −14.9% | |
| 2000 | 2,438 | −14.0% | |
| 2010 | 2,099 | −13.9% | |
| 2018 (est.) | 1,955 | [8] | −6.9% |
| US Decennial Census[9] 1790-1960[10] 1900-1990[11] 1990-2000[12] 2010-2013[1] | |||
As of the 2000 United States Census, there were 2,438 people, 1,014 households, and 670 families in the county. The population density was 4 people per square mile (2/km2). There were 1,406 housing units at an average density of 3 per square mile (1/km2). The racial makeup of the county was 98.89% White, 0.57% Native American, 0.16% Asian, and 0.37% from two or more races. 0.08% of the population were Hispanic or Latino of any race. 45.2% were of German, 10.0% American, 9.3% Czech, 7.8% Irish, 6.9% English and 5.9% Swedish ancestry.
There were 1,014 households, out of which 29.00% had children under the age of 18 living with them, 59.40% were married couples living together, 3.70% had a female householder with no husband present, and 33.90% were non-families. 32.00% of all households were made up of individuals, and 19.60% had someone living alone who was 65 years of age or older. The average household size was 2.36 and the average family size was 2.98.
The county population contained 25.00% under the age of 18, 5.40% from 18 to 24, 21.20% from 25 to 44, 24.10% from 45 to 64, and 24.30% who were 65 years of age or older. The median age was 44 years. For every 100 females there were 93.30 males. For every 100 females age 18 and over, there were 94.60 males.
The median income for a household in the county was $26,075, and the median income for a family was $32,000. Males had a median income of $20,859 versus $17,688 for females. The per capita income for the county was $13,840. About 12.90% of families and 15.20% of the population were below the poverty line, including 19.60% of those under age 18 and 11.20% of those age 65 or over.
Communities
Politics
| Year | Republican | Democratic | Third Parties |
|---|---|---|---|
| 2020 | 87.5% 1,010 | 11.7% 135 | 0.9% 10 |
| 2016 | 85.0% 983 | 11.1% 128 | 3.9% 45 |
| 2012 | 81.5% 873 | 17.6% 188 | 0.9% 10 |
| 2008 | 75.6% 839 | 22.5% 250 | 1.9% 21 |
| 2004 | 79.4% 911 | 19.9% 228 | 0.8% 9 |
| 2000 | 75.0% 931 | 21.3% 265 | 3.7% 46 |
| 1996 | 58.0% 778 | 27.7% 372 | 14.3% 192 |
| 1992 | 47.4% 744 | 22.5% 353 | 30.2% 474 |
| 1988 | 65.9% 967 | 32.7% 480 | 1.4% 20 |
| 1984 | 78.5% 1,175 | 20.6% 308 | 0.9% 13 |
| 1980 | 72.8% 1,261 | 21.7% 376 | 5.5% 96 |
| 1976 | 55.1% 1,004 | 43.5% 792 | 1.4% 25 |
| 1972 | 73.7% 1,419 | 26.3% 506 | 0.0% 0 |
| 1968 | 64.6% 1,250 | 22.6% 437 | 12.8% 247 |
| 1964 | 54.8% 1,100 | 45.2% 908 | 0.0% 0 |
| 1960 | 64.5% 1,393 | 35.5% 768 | 0.0% 0 |
| 1956 | 62.5% 1,414 | 37.5% 848 | 0.0% 0 |
| 1952 | 68.6% 1,656 | 31.4% 757 | 0.0% 0 |
| 1948 | 50.6% 1,060 | 49.4% 1,035 | 0.0% 0 |
| 1944 | 61.9% 1,456 | 38.1% 895 | 0.0% 0 |
| 1940 | 62.1% 1,734 | 37.9% 1,057 | 0.0% 0 |
| 1936 | 44.5% 1,290 | 53.6% 1,555 | 1.9% 55 |
| 1932 | 27.3% 808 | 71.0% 2,098 | 1.7% 51 |
| 1928 | 58.7% 1,653 | 40.6% 1,143 | 0.7% 19 |
| 1924 | 37.6% 991 | 19.8% 522 | 42.7% 1,125 |
| 1920 | 70.0% 1,482 | 24.9% 527 | 5.1% 107 |
| 1916 | 47.0% 809 | 49.5% 852 | 3.5% 61 |
| 1912 | 16.9% 281 | 39.2% 651 | 44.0% 731[14] |
| 1908 | 50.1% 954 | 46.8% 891 | 3.2% 61 |
| 1904 | 64.4% 1,233 | 17.1% 328 | 18.5% 355 |
| 1900 | 47.5% 771 | 48.9% 795 | 3.6% 59 |
References
- "State & County QuickFacts". US Census Bureau. Archived from the original on July 7, 2011. Retrieved September 17, 2013.
- "Find a County". National Association of Counties. Archived from the original on May 31, 2011. Retrieved June 7, 2011.
- Fitzpatrick, Lillian L. (1960). Nebraska Place-Names. University of Nebraska Press. p. 21. ISBN 0803250606.
- History of the Origin of the Place Names in Nine Northwestern States. 1908. p. 12.
- Reuters, Monowi, Nebraska, Population: 1.
- "2010 Census Gazetteer Files". US Census Bureau. August 22, 2012. Archived from the original on November 13, 2013. Retrieved December 6, 2014.
- "About" Archived October 3, 2008, at the Wayback Machine, North Central RC&D.
- "Population and Housing Unit Estimates". Retrieved December 28, 2019.
- "US Decennial Census". US Census Bureau. Archived from the original on April 26, 2015. Retrieved December 6, 2014.
- "Historical Census Browser". University of Virginia Library. Retrieved December 6, 2014.
- "Population of Counties by Decennial Census: 1900 to 1990". US Census Bureau. Retrieved December 6, 2014.
- "Census 2000 PHC-T-4. Ranking Tables for Counties: 1990 and 2000" (PDF). US Census Bureau. Retrieved December 6, 2014.
- http://uselectionatlas.org/RESULTS
- The leading "other" candidate, Progressive Theodore Roosevelt, received 651 votes, same as Democrat Woodrow Wilson, while Socialist candidate Eugene Debs received 57 votes and Prohibition candidate Eugene Chafin received 23 votes.
Places adjacent to Boyd County, Nebraska | |
|---|---|
Municipalities and communities of Boyd County, Nebraska, United States | ||
|---|---|---|
| Villages | Map of Nebraska highlighting Boyd County | |
| Townships | ||
| Ghost towns | ||
| ||