Seward County, Nebraska
Seward County is a county in the U.S. state of Nebraska. As of the 2010 United States Census, the population was 16,750.[1] Its county seat is Seward.[2] The county was formed in 1855,[3] and was organized in 1867.[4][5] It was originally called Greene County, and in 1862 it was renamed for William H. Seward, United States Secretary of State under Abraham Lincoln and Andrew Johnson. Seward County is part of the Lincoln, NE Metropolitan Statistical Area.
Seward County | |
|---|---|
| County of Seward | |
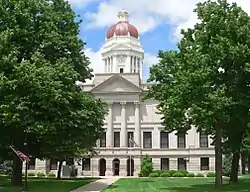 Seward County Courthouse in Seward | |
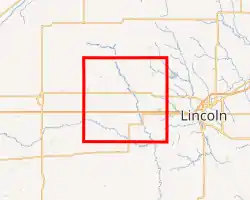
Interactive map of Seward County | |
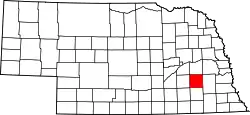 Location within the U.S. state of Nebraska | |
| Country | |
| State | |
| Established | March 16, 1855 |
| Organized | October 1865 |
| Named for | William H. Seward |
| County seat | Seward |
| Largest city | Seward |
| Area | |
| • Total | 576 sq mi (1,490 km2) |
| • Land | 571 sq mi (1,480 km2) |
| • Water | 4.5 sq mi (12 km2) 0.8% |
| Highest elevation | 1,598 ft (487 m) |
| Lowest elevation | 938 ft (286 m) |
| Population | |
| • Estimate (2018) | 17,318 |
| • Density | 30.1/sq mi (11.6/km2) |
| Time zone | UTC−6 (Central) |
| • Summer (DST) | UTC−5 (CDT) |
| Area code | 402/531 |
| FIPS code | 31159 |
| GNIS feature ID | 835901 |
| Website | countyofsewardne.com |
In the Nebraska license plate system, Seward County is represented by the prefix 16 (it had the sixteenth-largest number of vehicles registered in the county when the license plate system was established in 1922).
Geography
The Seward County terrain consists of low rolling hills, largely dedicated to agriculture including center pivot irrigation. The Big Blue River flows south-southeasterly through the central part of the county.[6] The county has a total area of 576 square miles (1,490 km2), of which 571 square miles (1,480 km2) is land and 4.5 square miles (12 km2) (0.8%) is water.[7]
Major highways
Adjacent counties
- Butler County – north
- Lancaster County – east
- Saline County – south
- Fillmore County – southwest
- York County – west
- Polk County – northwest
Demographics
| Historical population | |||
|---|---|---|---|
| Census | Pop. | %± | |
| 1870 | 2,953 | — | |
| 1880 | 11,147 | 277.5% | |
| 1890 | 16,140 | 44.8% | |
| 1900 | 15,690 | −2.8% | |
| 1910 | 15,895 | 1.3% | |
| 1920 | 15,867 | −0.2% | |
| 1930 | 15,938 | 0.4% | |
| 1940 | 14,167 | −11.1% | |
| 1950 | 13,155 | −7.1% | |
| 1960 | 13,581 | 3.2% | |
| 1970 | 14,460 | 6.5% | |
| 1980 | 15,789 | 9.2% | |
| 1990 | 15,450 | −2.1% | |
| 2000 | 16,496 | 6.8% | |
| 2010 | 16,750 | 1.5% | |
| 2018 (est.) | 17,318 | [13] | 3.4% |
| US Decennial Census[14] 1790-1960[15] 1900-1990[16] 1990-2000[17] 2010-2013[1] | |||
As of the 2000 United States Census,[18] there were 16,496 people, 6,013 households, and 4,215 families in the county. The population density was 29 people per square mile (11/km2). There were 6,428 housing units at an average density of 11 per square mile (4/km2). The racial makeup of the county was 98.05% White, 0.28% Black or African American, 0.21% Native American, 0.29% Asian, 0.05% Pacific Islander, 0.40% from other races, and 0.72% from two or more races. 1.09% of the population were Hispanic or Latino of any race.
There were 6,013 households, out of which 32.80% had children under the age of 18 living with them, 61.50% were married couples living together, 5.60% had a female householder with no husband present, and 29.90% were non-families. 24.90% of all households were made up of individuals, and 12.10% had someone living alone who was 65 years of age or older. The average household size was 2.53 and the average family size was 3.04.
The county population contained 24.70% under the age of 18, 14.30% from 18 to 24, 24.60% from 25 to 44, 21.20% from 45 to 64, and 15.20% who were 65 years of age or older. The median age was 36 years. For every 100 females, there were 103.20 males. For every 100 females age 18 and over, there were 102.50 males.
The median income for a household in the county was $42,700, and the median income for a family was $51,813. Males had a median income of $32,218 versus $22,329 for females. The per capita income for the county was $18,379. About 4.10% of families and 7.00% of the population were below the poverty line, including 6.20% of those under age 18 and 6.80% of those age 65 or over.
Communities
Census-designated place
Ghost town
Politics
Seward County voters are reliably Republican. In only one national election since 1936 has the county selected the Democratic Party candidate (as of 2016).
| Year | Republican | Democratic | Third Parties |
|---|---|---|---|
| 2016 | 68.9% 5,454 | 23.7% 1,875 | 7.5% 593 |
| 2012 | 66.1% 5,003 | 31.5% 2,386 | 2.4% 184 |
| 2008 | 61.7% 4,647 | 35.9% 2,703 | 2.4% 179 |
| 2004 | 70.8% 5,353 | 27.9% 2,114 | 1.3% 98 |
| 2000 | 63.5% 4,457 | 32.1% 2,250 | 4.4% 309 |
| 1996 | 51.9% 3,479 | 36.3% 2,432 | 11.9% 798 |
| 1992 | 44.1% 3,060 | 30.6% 2,121 | 25.3% 1,755 |
| 1988 | 55.9% 3,472 | 43.3% 2,690 | 0.8% 50 |
| 1984 | 67.1% 3,983 | 32.2% 1,911 | 0.7% 43 |
| 1980 | 59.1% 3,527 | 30.2% 1,803 | 10.7% 635 |
| 1976 | 54.1% 3,220 | 43.9% 2,610 | 2.0% 120 |
| 1972 | 64.0% 3,707 | 36.0% 2,087 | |
| 1968 | 60.6% 2,939 | 34.2% 1,658 | 5.2% 254 |
| 1964 | 39.9% 2,221 | 60.1% 3,347 | |
| 1960 | 63.1% 3,588 | 36.9% 2,095 | |
| 1956 | 65.9% 3,688 | 34.1% 1,910 | |
| 1952 | 71.6% 4,257 | 28.4% 1,685 | |
| 1948 | 56.2% 2,916 | 43.8% 2,274 | |
| 1944 | 64.1% 3,721 | 35.9% 2,083 | |
| 1940 | 62.0% 4,117 | 38.1% 2,529 | |
| 1936 | 44.4% 3,123 | 54.9% 3,866 | 0.7% 50 |
| 1932 | 35.0% 2,298 | 64.0% 4,208 | 1.0% 65 |
| 1928 | 59.7% 3,539 | 39.9% 2,367 | 0.4% 24 |
| 1924 | 49.2% 2,797 | 32.5% 1,848 | 18.3% 1,039 |
| 1920 | 70.0% 3,690 | 28.4% 1,497 | 1.6% 86 |
| 1916 | 50.1% 1,855 | 48.5% 1,797 | 1.4% 50 |
| 1912 | 23.3% 788 | 46.5% 1,573 | 30.2% 1,023 |
| 1908 | 48.2% 1,930 | 50.7% 2,029 | 1.1% 44 |
| 1904 | 61.6% 2,243 | 28.2% 1,027 | 10.1% 369 |
| 1900 | 50.3% 1,937 | 48.4% 1,865 | 1.3% 49 |
References
- "State & County QuickFacts". United States Census Bureau. Retrieved September 22, 2013.
- "Find a County". National Association of Counties. Retrieved 7 June 2011.
- Fitzpatrick, Lilian Linder (1925). Nebraska Place-Names. Lincoln: University of Nebraska Studies in Language, Literature, and Criticism. p. 131. Retrieved December 19, 2014.
- "Seward County Nebraska Historic Buildings Survey" (PDF). Nebraska State Historical Society. August 2007. Retrieved December 19, 2014.
- Andreas, A. T. (1882). "Andreas' History of the State of Nebraska". The Kansas Collection. Archived from the original on 2003-07-29. Retrieved December 19, 2014.
- Seward County NE Google Maps (accessed 26 January 2019)
- "2010 Census Gazetteer Files". US Census Bureau. August 22, 2012. Archived from the original on November 13, 2013. Retrieved December 11, 2014.
- Bur Oak State Wildlife Management Area, Seward NE Google Maps (accessed 26 January 2019)
- Freeman Lakes Waterfowl Production Area, Waco NE Google Maps (accessed 26 January 2019)
- North Lake Basin State Wildlife Management Area, Utica NE Google Maps (accessed 26 January 2019)
- Oak Glen State Wildlife Management Area, Garland NE Google Maps (accessed 26 January 2019)
- Tamora Waterfowl Production Area, Alvo Rd, Seward NE Google Maps (accessed 26 January 2019)
- "Population and Housing Unit Estimates". Retrieved December 26, 2019.
- "US Decennial Census". US Census Bureau. Retrieved December 11, 2014.
- "Historical Census Browser". University of Virginia Library. Retrieved December 11, 2014.
- "Population of Counties by Decennial Census: 1900 to 1990". US Census Bureau. Retrieved December 11, 2014.
- "Census 2000 PHC-T-4. Ranking Tables for Counties: 1990 and 2000" (PDF). US Census Bureau. Retrieved December 11, 2014.
- "U.S. Census website". US Census Bureau. Retrieved 31 January 2008.
- Election Results
External links
Places adjacent to Seward County, Nebraska | ||||||||||
|---|---|---|---|---|---|---|---|---|---|---|
| ||||||||||
Municipalities and communities of Seward County, Nebraska, United States | ||
|---|---|---|
| Cities | Map of Nebraska highlighting Seward County | |
| Villages | ||
| CDP | ||
| Unincorporated communities | ||
| Ghost town | ||
| ||
| Authority control |
|---|