Howard County, Nebraska
Howard County is a county in the state of Nebraska. As of the 2010 United States Census, the population was 6,274.[1] Its county seat is St. Paul.[2] The county was formed in 1871 and named after Civil War General Oliver Otis Howard.[3]
Howard County | |
|---|---|
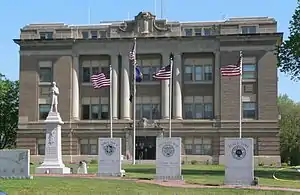 Howard County Courthouse in St. Paul | |
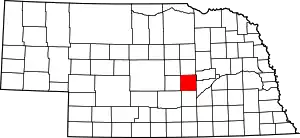 Location within the U.S. state of Nebraska | |
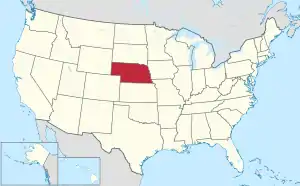 Nebraska's location within the U.S. | |
| Coordinates: 41°13′N 98°31′W | |
| Country | |
| State | |
| Founded | 1871 |
| Named for | Oliver O. Howard |
| Seat | St. Paul |
| Largest city | St. Paul |
| Area | |
| • Total | 576 sq mi (1,490 km2) |
| • Land | 569 sq mi (1,470 km2) |
| • Water | 6.3 sq mi (16 km2) 1.1%% |
| Population | |
| • Estimate (2017) | 6,437 |
| • Density | 11.3/sq mi (4.4/km2) |
| Time zone | UTC−6 (Central) |
| • Summer (DST) | UTC−5 (CDT) |
| Congressional district | 3rd |
| Website | www |
Howard County is part of the Grand Island, NE Metropolitan Statistical Area.
In the Nebraska license plate system, Howard County is represented by the prefix 49 (it had the 49th-largest number of vehicles registered in the state when the license plate system was established in 1922).
Geography
The terrain of Howard consists of low rolling hills. The leveled hilltops are mostly used for agriculture. The Upper Loup River flows southeastward into the county near its NW corner, turning eastward to flow toward its junction with Middle Loup River. The Middle Loup River flows northeastward into the county near its SW corner, turning north to join with the Upper Loup River near the county midpoint to form the Loup River, flowing eastward into Merrick County. The county has a total area of 576 square miles (1,490 km2), of which 569 square miles (1,470 km2) is land and 6.3 square miles (16 km2) (1.1%) is water.[4]
Major highways
 U.S. Highway 281
 Nebraska Highway 11
 Nebraska Highway 22
 Nebraska Highway 58
 Nebraska Highway 92
Adjacent counties
- Merrick County – east
- Hall County – south
- Buffalo County – southwest
- Sherman County – west
- Greeley County – north
Protected areas
- Loup Junction State Wildlife Management Area[5]
Demographics
| Historical population | |||
|---|---|---|---|
| Census | Pop. | %± | |
| 1880 | 4,391 | — | |
| 1890 | 9,430 | 114.8% | |
| 1900 | 10,343 | 9.7% | |
| 1910 | 10,783 | 4.3% | |
| 1920 | 10,739 | −0.4% | |
| 1930 | 10,020 | −6.7% | |
| 1940 | 8,422 | −15.9% | |
| 1950 | 7,226 | −14.2% | |
| 1960 | 6,541 | −9.5% | |
| 1970 | 6,807 | 4.1% | |
| 1980 | 6,773 | −0.5% | |
| 1990 | 6,057 | −10.6% | |
| 2000 | 6,567 | 8.4% | |
| 2010 | 6,274 | −4.5% | |
| 2017 (est.) | 6,437 | [6] | 2.6% |
| US Decennial Census[7] 1790-1960[8] 1900-1990[9] 1990-2000[10] 2010-2013[1] | |||
As of the 2000 United States Census,[11] there were 6,567 people, 2,546 households, and 1,797 families in the county. The population density was 12 people per square mile (4/km2). There were 2,782 housing units at an average density of 5 per square mile (2/km2). The racial makeup of the county was 98.69% White, 0.30% Black or African American, 0.24% Native American, 0.09% Asian, 0.03% Pacific Islander, 0.32% from other races, and 0.32% from two or more races. 1.01% of the population were Hispanic or Latino of any race.
There were 2,546 households, out of which 33.80% had children under the age of 18 living with them, 61.00% were married couples living together, 6.20% had a female householder with no husband present, and 29.40% were non-families. 26.00% of all households were made up of individuals, and 15.00% had someone living alone who was 65 years of age or older. The average household size was 2.56 and the average family size was 3.09.
The county population contained 28.30% under the age of 18, 6.60% from 18 to 24, 25.30% from 25 to 44, 22.60% from 45 to 64, and 17.10% who were 65 years of age or older. The median age was 38 years. For every 100 females, there were 101.00 males. For every 100 females age 18 and over, there were 97.30 males.
The median income for a household in the county was $33,305, and the median income for a family was $40,259. Males had a median income of $27,270 versus $19,587 for females. The per capita income for the county was $15,535. About 8.50% of families and 11.70% of the population were below the poverty line, including 14.30% of those under age 18 and 15.00% of those age 65 or over.
Politics
Howard County voters have usually voted Republican for several decades. In only one national election since 1948 has the county selected the Democratic Party candidate.
| Year | Republican | Democratic | Third Parties |
|---|---|---|---|
| 2016 | 76.3% 2,284 | 18.2% 544 | 5.5% 166 |
| 2012 | 65.9% 1,890 | 31.9% 914 | 2.3% 66 |
| 2008 | 61.7% 1,847 | 36.2% 1,083 | 2.2% 66 |
| 2004 | 67.8% 2,020 | 30.2% 900 | 2.0% 59 |
| 2000 | 62.3% 1,760 | 33.8% 955 | 4.0% 112 |
| 1996 | 50.1% 1,294 | 33.0% 853 | 16.9% 436 |
| 1992 | 39.7% 1,138 | 27.1% 778 | 33.2% 954 |
| 1988 | 55.6% 1,526 | 43.2% 1,186 | 1.1% 31 |
| 1984 | 67.7% 1,899 | 31.6% 887 | 0.7% 20 |
| 1980 | 66.4% 1,971 | 26.6% 789 | 7.1% 210 |
| 1976 | 49.8% 1,362 | 48.1% 1,316 | 2.1% 58 |
| 1972 | 64.2% 1,691 | 35.9% 945 | |
| 1968 | 51.4% 1,256 | 41.0% 1,003 | 7.6% 186 |
| 1964 | 33.5% 1,019 | 66.5% 2,025 | |
| 1960 | 52.5% 1,676 | 47.5% 1,518 | |
| 1956 | 54.0% 1,701 | 46.0% 1,449 | |
| 1952 | 59.2% 2,115 | 40.8% 1,456 | |
| 1948 | 37.4% 1,133 | 62.6% 1,893 | |
| 1944 | 43.3% 1,556 | 56.8% 2,042 | |
| 1940 | 43.1% 1,696 | 56.9% 2,238 | |
| 1936 | 27.2% 1,223 | 70.1% 3,148 | 2.7% 123 |
| 1932 | 17.1% 734 | 79.2% 3,409 | 3.8% 163 |
| 1928 | 46.6% 1,937 | 52.9% 2,197 | 0.6% 23 |
| 1924 | 31.6% 1,091 | 41.5% 1,434 | 26.9% 930 |
| 1920 | 50.8% 1,508 | 44.1% 1,311 | 5.1% 152 |
| 1916 | 28.1% 698 | 68.2% 1,695 | 3.7% 93 |
| 1912 | 19.6% 431 | 50.8% 1,118 | 29.7% 653 |
| 1908 | 39.4% 977 | 57.8% 1,435 | 2.9% 71 |
| 1904 | 57.0% 1,259 | 21.5% 476 | 21.5% 475 |
| 1900 | 40.5% 908 | 57.2% 1,283 | 2.3% 52 |
References
- "State & County QuickFacts". US Census Bureau. Archived from the original on June 7, 2011. Retrieved September 20, 2013.
- "Find a County". National Association of Counties. Archived from the original on 31 May 2011. Retrieved 7 June 2011.
- "Archived copy". Archived from the original on 4 July 2008. Retrieved 15 March 2008.CS1 maint: archived copy as title (link)
- "2010 Census Gazetteer Files". US Census Bureau. August 22, 2012. Archived from the original on November 13, 2013. Retrieved December 8, 2014.
- Loup Junction State Wildlife Management Area, St Paul NE Google Maps (accessed 23 January 2019)
- "Population and Housing Unit Estimates". Retrieved 21 January 2019.
- "US Decennial Census". US Census Bureau. Retrieved December 8, 2014.
- "Historical Census Browser". University of Virginia Library. Retrieved December 8, 2014.
- "Population of Counties by Decennial Census: 1900 to 1990". US Census Bureau. Retrieved December 8, 2014.
- "Census 2000 PHC-T-4. Ranking Tables for Counties: 1990 and 2000" (PDF). US Census Bureau. Retrieved December 8, 2014.
- "U.S. Census website". United States Census Bureau. Retrieved 31 January 2008.
- Election Results
Places adjacent to Howard County, Nebraska | ||||||||||
|---|---|---|---|---|---|---|---|---|---|---|
| ||||||||||
Municipalities and communities of Howard County, Nebraska, United States | ||
|---|---|---|
| City | Map of Nebraska highlighting Howard County | |
| Villages | ||
| CDP | ||
| Unincorporated communities | ||
| Footnotes | ‡This populated place also has portions in an adjacent county or counties | |
| ||
| Authority control |
|---|