Bay of Quinte (electoral district)
Bay of Quinte (French: Baie de Quinte) is a federal electoral district in central Ontario, Canada, centred on the Bay of Quinte.
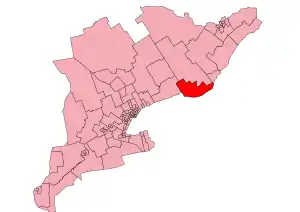 Bay of Quinte in relation to other electoral districts in Southern Ontario | |||
| Federal electoral district | |||
| Legislature | House of Commons | ||
| MP |
Liberal | ||
| District created | 2013 | ||
| First contested | 2015 | ||
| Last contested | 2019 | ||
| District webpage | profile, map | ||
| Demographics | |||
| Population (2016)[1] | 109,735 | ||
| Electors (2015) | 83,427 | ||
| Area (km²)[2] | 1,621.34 | ||
| Pop. density (per km²) | 67.7 | ||
| Census division(s) | Hastings, Prince Edward | ||
| Census subdivision(s) | Belleville, Prince Edward, Quinte West | ||
Bay of Quinte was created by the 2012 federal electoral boundaries redistribution and was legally defined in the 2013 representation order. It came into effect upon the call of the 42nd Canadian federal election, scheduled for 19 October 2015.[3] It was created out of parts of the electoral districts of Prince Edward—Hastings (62%) and Northumberland—Quinte West (38%).[4]
Demographics
- According to the Canada 2016 Census; 2013 representation[5][6]
Ethnic groups: 89.5% White, 6.6% Aboriginal
Languages: 92.4% English, 2.9% French
Religions (2011): 68.8% Christian (20.9% Catholic, 17.7% United Church, 10.9% Anglican, 2.8% Presbyterian, 2.5% Baptist, 1.7% Pentecostal, 12.2% Other), 29.6% No religion
Median income (2015): $31,144
Average income (2015): $40,294
Members of Parliament
This riding has elected the following Members of Parliament:
| Parliament | Years | Member | Party | |
|---|---|---|---|---|
| Bay of Quinte Riding created from Northumberland—Quinte West and Prince Edward—Hastings |
||||
| 42nd | 2015–2019 | Neil Ellis | Liberal | |
| 43rd | 2019–present | |||
Election results
| 2019 Canadian federal election | ||||||||
|---|---|---|---|---|---|---|---|---|
| Party | Candidate | Votes | % | ±% | Expenditures | |||
| Liberal | Neil Ellis | 24,099 | 39.16 | -11.58 | $96,721.36 | |||
| Conservative | Tim Durkin | 22,650 | 36.8 | +2.53 | $55,922.84 | |||
| New Democratic | Stephanie Bell | 9,851 | 16 | +3.87 | none listed | |||
| Green | Danny Celovsky | 3,740 | 6.08 | +3.87 | $592.37 | |||
| People's | Paul Bordonaro | 1,207 | 1.94 | none listed | ||||
| Total valid votes/Expense limit | 61,547 | 100.0 | ||||||
| Total rejected ballots | 464 | |||||||
| Turnout | 62,011 | 66.1 | ||||||
| Eligible voters | 93,859 | |||||||
| Source: Elections Canada[7][8] | ||||||||
| 2015 Canadian federal election | ||||||||
|---|---|---|---|---|---|---|---|---|
| Party | Candidate | Votes | % | ±% | Expenditures | |||
| Liberal | Neil Ellis | 29,281 | 50.74 | +29.86 | $118,473.86 | |||
| Conservative | Jodie Jenkins | 19,781 | 34.27 | −17.53 | $109,092.53 | |||
| New Democratic | Terry Cassidy | 7,001 | 12.13 | −10.88 | $21,205.50 | |||
| Green | Rachel Nelems | 1,278 | 2.21 | −1.56 | – | |||
| Independent | Trueman Tuck | 372 | 0.64 | – | $4,425.20 | |||
| Total valid votes/Expense limit | 57,713 | 99.64 | $221,051.99 | |||||
| Total rejected ballots | 211 | 0.36 | – | |||||
| Turnout | 57,924 | 68.99 | – | |||||
| Eligible voters | 83,954 | |||||||
| Liberal notional gain from Conservative | Swing | +23.69 | ||||||
| Source: Elections Canada[9][10] | ||||||||
| 2011 federal election redistributed results[11] | |||
|---|---|---|---|
| Party | Vote | % | |
| Conservative | 25,906 | 51.81 | |
| New Democratic | 11,508 | 23.01 | |
| Liberal | 10,441 | 20.88 | |
| Green | 1,886 | 3.77 | |
| Others | 265 | 0.53 | |
References
- Statistics Canada: 2017
- Statistics Canada: 2017
- Timeline for the Redistribution of Federal Electoral Districts
- Final Report – Ontario
- https://www12.statcan.gc.ca/census-recensement/2016/dp-pd/prof/details/page.cfm?Lang=E&Geo1=FED&Code1=35006&Geo2=PR&Code2=35&SearchText=Bay%20of%20Quinte&SearchType=Begins&SearchPR=01&B1=All&TABID=1&type=0
- https://www12.statcan.gc.ca/nhs-enm/2011/dp-pd/prof/details/page.cfm?Lang=E&Geo1=FED2013&Code1=35006&Data=Count&SearchText=Bay%20of%20Quinte&SearchType=Begins&SearchPR=01&A1=All&B1=All&Custom=&TABID=1
- "List of confirmed candidates". Elections Canada. Retrieved October 3, 2019.
- "Election Night Results". Elections Canada. Retrieved October 31, 2019.
- Elections Canada – Confirmed candidates for Bay of Quinte, 30 September 2015
- Elections Canada – Preliminary Election Expenses Limits for Candidates Archived 2015-08-15 at the Wayback Machine
- Pundits' Guide to Canadian Elections