Etobicoke North
Etobicoke North (French: Etobicoke-Nord) is a federal electoral district in Toronto, Ontario, Canada, that has been represented in the House of Commons of Canada since 1979. It covers the neighbourhood of Rexdale, in the northern part of the Etobicoke district of Toronto.
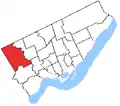
.png.webp) Etobicoke North in relation to other electoral districts in Toronto (2013 boundaries) | |||
| Federal electoral district | |||
| Legislature | House of Commons | ||
| MP |
Liberal | ||
| District created | 1976 | ||
| First contested | 1979 | ||
| Last contested | 2019 | ||
| District webpage | profile, map | ||
| Demographics | |||
| Population (2011)[1] | 117,601 | ||
| Electors (2015) | 67,544 | ||
| Area (km²)[1] | 51 | ||
| Pop. density (per km²) | 2,305.9 | ||
| Census division(s) | Toronto | ||
| Census subdivision(s) | Toronto | ||
.gif)
The riding was created in 1976 from parts of Etobicoke and York West. In the House of Commons, the riding has been represented by Liberal Kirsty Duncan since 2008.
Geography
The riding consists of the northwestern part of the City of Toronto. The eastern boundary is the Humber River East Branch and the Humber River from Steeles Avenue West south to a point just to the east of the Dixon Road. The southern boundary runs west from the Humber River along Dixon Road to Martin Grove Road to Eglinton Avenue to the western limit of the city. The western and northern limits of the ridings are formed by the city limits.
In addition to Rexdale, the riding also contains the neighbourhoods of The Elms, Humberwood, Kingsview Village, Thistletown, and Willowridge.
This riding gained territory from Etobicoke Centre during the 2012 electoral redistribution.
Demographics
According to the 2011 Census, Etobicoke North has a population of 56,625, an increase of 3.6% between 2006 and 2011. 47% of families are couples with children, while 28% of families are couple without children, and 25% are Lone-parent families. The most common structures of occupied private dwellings are single-detached houses at 39.5%, and Apartment buildings that have 5 or more storeys at 36.1%.[2]
The 2011 National Household Survey addressed households, immigration/migration, ethnocultural, education, labour force, and income/shelter factors. In terms of immigration, 54% of Etobicoke North residents are 1st generation, 30.9% are 2nd generation, and 14.6% are third generation Canadian or over. There were large waves of immigration to the area between 1991 and 2011, consisting of a total of 16560 people. The largest number of immigrants to the area were born in India at 8.7%, followed by Italy, Jamaica, Pakistan, Philippines, Guyana, Poland, United Kingdom, Sri Lanka, and Vietnam. The majority of recent immigrants residing in Etobicoke North were born in India, and 57.7% of the population are visible minorities.[3]
The top Mother tongue is English, followed by Italian, then Punjabi. 4.0% of the population has no knowledge of English or French.[2]
While 75% of residents of Etobicoke North have obtained a certificate, diploma, or degree, 25% of the population hold no certificate, diploma, or degree.[3]
The average household income in 2010 was $72,100, and the average individual income was $32,995, with an unemployment rate of 10.0%.[3]
Former boundaries
 1976 to 1987
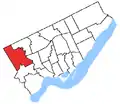 1987 to 1996
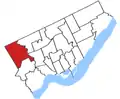 1996 to 2003
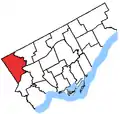 2003 to 2015
Members of Parliament
This riding has elected the following Members of Parliament:
| Parliament | Years | Member | Party | |
|---|---|---|---|---|
| Etobicoke North Riding created from Etobicoke and York West |
||||
| 31st | 1979–1980 | Roy MacLaren | Liberal | |
| 32nd | 1980–1984 | |||
| 33rd | 1984–1988 | Robert Pennock | Progressive Conservative | |
| 34th | 1988–1993 | Roy MacLaren | Liberal | |
| 35th | 1993–1996 | |||
| 1996–1997 | Roy Cullen | |||
| 36th | 1997–2000 | |||
| 37th | 2000–2004 | |||
| 38th | 2004–2006 | |||
| 39th | 2006–2008 | |||
| 40th | 2008–2011 | Kirsty Duncan | ||
| 41st | 2011–2015 | |||
| 42nd | 2015–2019 | |||
| 43rd | 2019–present | |||
Election results
| 2019 Canadian federal election | ||||||||
|---|---|---|---|---|---|---|---|---|
| Party | Candidate | Votes | % | ±% | Expenditures | |||
| Liberal | Kirsty Duncan | 26,388 | 61.4 | -1.01 | $67,270.39 | |||
| Conservative | Sarabjit Kaur | 9,524 | 22.2 | -0.80 | none listed | |||
| New Democratic | Naiima Farah | 4,654 | 10.8 | -1.61 | none listed | |||
| People's | Renata Ford | 1,196 | 2.8 | - | none listed | |||
| Green | Nancy Ghuman | 1,080 | 2.5 | +1.25 | none listed | |||
| Canada's Fourth Front | Sudhir Mehta | 104 | 0.2 | - | $0.00 | |||
| Total valid votes/Expense limit | 42,946 | 100.0 | ||||||
| Total rejected ballots | 565 | |||||||
| Turnout | 43,511 | 58.8 | ||||||
| Eligible voters | 73,970 | |||||||
| Source: Elections Canada[4][5] | ||||||||
| 2015 Canadian federal election | ||||||||
|---|---|---|---|---|---|---|---|---|
| Party | Candidate | Votes | % | ±% | Expenditures | |||
| Liberal | Kirsty Duncan | 26,251 | 62.41 | +19.84 | $69,670.96 | |||
| Conservative | Toyin Dada | 9,673 | 23.00 | -8.96 | $60,237.66 | |||
| New Democratic | Faisal Hassan | 5,220 | 12.41 | -11.21 | $37,513.09 | |||
| Green | Akhtar Ayub | 524 | 1.25 | +1.08 | $1,558.16 | |||
| Marxist–Leninist | Anna Di Carlo | 232 | 0.55 | – | ||||
| No affiliation | George Szebik | 164 | 0.39 | – | – | |||
| Total valid votes/Expense limit | 42,064 | 100.00 | $201,932.10 | |||||
| Total rejected ballots | 257 | 0.61 | – | |||||
| Turnout | 42,321 | 62.18 | – | |||||
| Eligible voters | 68,063 | |||||||
| Liberal hold | Swing | +14.40 | ||||||
| Source: Elections Canada[6][7] | ||||||||
| 2011 federal election redistributed results[8] | |||
|---|---|---|---|
| Party | Vote | % | |
| Liberal | 14,929 | 42.57 | |
| Conservative | 11,208 | 31.96 | |
| New Democratic | 8,283 | 23.62 | |
| Others | 594 | 1.69 | |
| Green | 59 | 0.17 | |
| 2011 Canadian federal election | ||||||||
|---|---|---|---|---|---|---|---|---|
| Party | Candidate | Votes | % | ±% | Expenditures | |||
| Liberal | Kirsty Duncan | 13,665 | 42.4 | -6.2 | ||||
| Conservative | Priti Lamba | 10,357 | 32.1 | +2.0 | ||||
| New Democratic | Diana Andrews | 7,630 | 23.7 | +8.0 | ||||
| Libertarian | Alex Dvornyak | 208 | 0.7 | -4.1 | ||||
| Marxist–Leninist | Anna Di Carlo | 189 | 0.6 | -0.4 | ||||
| Christian Heritage | John C. Gardner | 186 | 0.6 | – | ||||
| Total valid votes | 32,235 | 100.0 | ||||||
| Total rejected ballots | 279 | 0.9 | +0.2 | |||||
| Turnout | 32,514 | 52.5 | ||||||
| Eligible voters | 61,930 | – | – | |||||
| 2008 Canadian federal election | ||||||||
|---|---|---|---|---|---|---|---|---|
| Party | Candidate | Votes | % | ±% | Expenditures | |||
| Liberal | Kirsty Duncan | 15,244 | 48.6 | -13.0 | $54,827 | |||
| Conservative | Bob Saroya | 9,436 | 30.1 | +7.8 | $64,024 | |||
| New Democratic | Ali Naqvi | 4,940 | 15.7 | +5.1 | $35,653 | |||
| Green | Nigel Barriffe | 1,460 | 4.7 | +2.1 | $2,242 | |||
| Marxist–Leninist | Anna Di Carlo | 300 | 1.0 | +0.4 | ||||
| Total valid votes/Expense limit | 31,380 | 100.0 | $79,011 | |||||
| Total rejected ballots | 214 | 0.68 | ||||||
| Turnout | 31,594 | |||||||
| 2006 Canadian federal election | ||||||||
|---|---|---|---|---|---|---|---|---|
| Party | Candidate | Votes | % | ±% | ||||
| Liberal | Roy Cullen | 22,195 | 61.6 | -1.7 | ||||
| Conservative | Amanjit Khroad | 8,049 | 22.3 | +3.6 | ||||
| New Democratic | Ali Naqvi | 3,820 | 10.6 | -1.6 | ||||
| Green | Jan Havlovic | 950 | 2.6 | +0.6 | ||||
| Progressive Canadian | Alexander T. Bussmann | 526 | 1.5 | |||||
| Independent | George Szebik | 273 | 0.8 | -0.2 | ||||
| Marxist–Leninist | Anna Di Carlo | 205 | 0.6 | 0.0 | ||||
| Total number of valid votes | 36,018 | 100.0 | ||||||
| Rejected ballots | 246 | |||||||
| Total number of votes | 36,264 | |||||||
Note: Conservative vote is compared to the total of the Canadian Alliance vote and Progressive Conservative vote in 2000 election.
| 2004 Canadian federal election | ||||||||
|---|---|---|---|---|---|---|---|---|
| Party | Candidate | Votes | % | ±% | ||||
| Liberal | Roy Cullen | 19,450 | 63.3 | -9.3 | ||||
| Conservative | Rupinder Nannar | 5,737 | 18.7 | -0.8 | ||||
| New Democratic | Cesar Martello | 3,761 | 12.2 | +5.4 | ||||
| Christian Heritage | William Ubbens | 661 | 2.2 | |||||
| Green | Mir Kamal | 605 | 2.0 | |||||
| Independent | George Szebik | 309 | 1.0 | |||||
| Marxist–Leninist | Anna Di Carlo | 195 | 0.6 | |||||
| Total number of valid votes | 30,718 | 100.0 | ||||||
| 2000 Canadian federal election | ||||||||
|---|---|---|---|---|---|---|---|---|
| Party | Candidate | Votes | % | ±% | ||||
| Liberal | Roy Cullen | 23,335 | 72.6 | +10.7 | ||||
| Alliance | Mahmood Elahi | 6,273 | 19.5 | +3.9 | ||||
| New Democratic | Ana Maria Sapp | 2,200 | 6.8 | -2.5 | ||||
| Communist | Elizabeth Rowley | 347 | 1.1 | |||||
| Total valid votes | 32,155 | 100.0 | ||||||
Note: Canadian Alliance vote is compared to the Reform vote in 1997 election.
| 1997 Canadian federal election | ||||||||
|---|---|---|---|---|---|---|---|---|
| Party | Candidate | Votes | % | ±% | ||||
| Liberal | Roy Cullen | 22,236 | 61.8 | +15.5 | ||||
| Reform | Mario Luciani | 5,597 | 15.6 | -20.5 | ||||
| Progressive Conservative | Sam Basran | 4,276 | 11.9 | +1.3 | ||||
| New Democratic | Carmela Casso | 3,350 | 9.3 | +4.0 | ||||
| Natural Law | Marilyn Pepper | 174 | 0.5 | |||||
| Marxist–Leninist | Mag Carson | 168 | 0.5 | |||||
| Canadian Action | Paul Schiwkow | 156 | 0.4 | |||||
| Total valid votes | 35,957 | 100.0 | ||||||
| By-election on March 25, 1996 | ||||||
| Party | Candidate | Votes | % | ±% | ||
|---|---|---|---|---|---|---|
| Liberal | Roy Cullen | 12,290 | 46.3 | -9.3 | ||
| Reform | Joe Peschisolido | 9,563 | 36.0 | +17.2 | ||
| Progressive Conservative | Mario Annecchini | 2,812 | 10.6 | -8.2 | ||
| New Democratic | Maxine Caron | 1,400 | 5.3 | +1.6 | ||
| Christian Heritage | Ron Gray | 284 | 1.1 | |||
| Abolitionist | John Turmel | 104 | 0.4 | |||
| Independent | Sylvie Charbin | 96 | 0.4 | |||
| Total valid votes | 26,549 | 100.0 | ||||
| 1993 Canadian federal election | ||||||||
|---|---|---|---|---|---|---|---|---|
| Party | Candidate | Votes | % | ±% | ||||
| Liberal | Roy MacLaren | 28,015 | 55.6 | +10.3 | ||||
| Reform | Joe Peschisolido | 9,470 | 18.8 | |||||
| Progressive Conservative | Jane MacLaren | 9,470 | 18.8 | -15.8 | ||||
| New Democratic | Carmela Sasso | 1,839 | 3.7 | -13.7 | ||||
| National | Emanuele Danelon | 661 | 1.3 | |||||
| Libertarian | Daniel Hunt | 363 | 0.7 | -0.2 | ||||
| Natural Law | Marilyn Pepper | 353 | 0.7 | |||||
| Independent | Antonio De Felice | 105 | 0.2 | |||||
| Marxist–Leninist | David Greig | 104 | 0.2 | +0.1 | ||||
| Total valid votes | 50,380 | 100.0 | ||||||
| 1988 Canadian federal election | ||||||||
|---|---|---|---|---|---|---|---|---|
| Party | Candidate | Votes | % | ±% | ||||
| Liberal | Roy MacLaren | 22,618 | 45.3 | +6.4 | ||||
| Progressive Conservative | Bob Pennock | 17,261 | 34.6 | -5.9 | ||||
| New Democratic | Ted Humphreys | 8,645 | 17.3 | -2.5 | ||||
| Christian Heritage | William Ubbens | 849 | 1.7 | |||||
| Libertarian | Michael Beech | 452 | 0.9 | +0.2 | ||||
| Independent | Gurdev Singh | 75 | 0.2 | |||||
| Total valid votes | 49,900 | 100.0 | ||||||
| 1984 Canadian federal election | ||||||||
|---|---|---|---|---|---|---|---|---|
| Party | Candidate | Votes | % | ±% | ||||
| Progressive Conservative | Bob Pennock | 22,713 | 40.5 | +9.3 | ||||
| Liberal | Roy MacLaren | 21,840 | 38.9 | -8.5 | ||||
| New Democratic | David Robertson | 11,136 | 19.8 | -0.2 | ||||
| Libertarian | Roger Hemsley | 417 | 0.7 | -0.3 | ||||
| Total valid votes | 56,106 | 100.0 | ||||||
| 1980 Canadian federal election | ||||||||
|---|---|---|---|---|---|---|---|---|
| Party | Candidate | Votes | % | ±% | ||||
| Liberal | Roy MacLaren | 24,243 | 47.5 | +7.8 | ||||
| Progressive Conservative | David Lakie | 15,954 | 31.2 | -5.2 | ||||
| New Democratic | Adrian Dorn | 10,237 | 20.0 | -3.2 | ||||
| Libertarian | Alex Eaglesham | 524 | 1.0 | +0.5 | ||||
| Marxist–Leninist | Gurdev Singh | 75 | 0.1 | 0.0 | ||||
| Independent | Khurshed Wadud | 49 | 0.1 | |||||
| Total valid votes | 51,082 | 100.0 | ||||||
| 1979 Canadian federal election | ||||||||
|---|---|---|---|---|---|---|---|---|
| Party | Candidate | Votes | % | |||||
| Liberal | Roy MacLaren | 20,534 | 39.7 | |||||
| Progressive Conservative | John Noel Hanna | 18,886 | 36.5 | |||||
| New Democratic | Adrian Dorn | 12,017 | 23.2 | |||||
| Libertarian | Ronald Vaughan | 269 | 0.5 | |||||
| Marxist–Leninist | Gurdev Singh | 68 | 0.1 | |||||
| Total valid votes | 51,774 | 100.0 | ||||||
References
- "(Code 35024) Census Profile". 2011 census. Statistics Canada. 2012. Retrieved 2011-03-03.
- Federal riding history from the Library of Parliament
- 2011 Results from Elections Canada
- Campaign expense data from Elections Canada
Notes
- Statistics Canada: 2011
- (PDF) http://www1.toronto.ca/City%20Of%20Toronto/City%20Planning/Wards/Files/pdf/W/Ward%2002%20Profile%202011.pdf. Retrieved 17 November 2015. Missing or empty
|title=(help) - (PDF) http://www1.toronto.ca/City%20Of%20Toronto/City%20Planning/Wards/Files/pdf/W/Ward%2002%20NHS%20Profile%202011.pdf. Retrieved 17 November 2015. Missing or empty
|title=(help) - "List of confirmed candidates". Elections Canada. Retrieved October 4, 2019.
- "Election Night Results". Elections Canada. Retrieved November 5, 2019.
- "Voter Information Service - Who are the candidates in my electoral district?". www.elections.ca.
- Elections Canada – Final Candidates Election Expenses Limits
- Funke, Alice. "Etobicoke North, ON (2013 Rep. Order)". www.punditsguide.ca.