Parry Sound—Muskoka
Parry Sound—Muskoka is a federal electoral district in Ontario, Canada, that has been represented in the House of Commons of Canada since 1949.
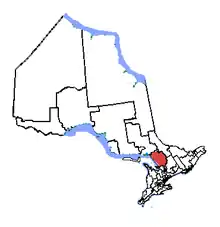 Parry Sound—Muskoka in relation to other Ontario electoral districts | |||
| Federal electoral district | |||
| Legislature | House of Commons | ||
| MP |
Conservative | ||
| District created | 1947 | ||
| First contested | 1949 | ||
| Last contested | 2019 | ||
| District webpage | profile, map | ||
| Demographics | |||
| Population (2011)[1] | 91,263 | ||
| Electors (2015) | 74,977 | ||
| Area (km²)[2] | 14,402 | ||
| Pop. density (per km²) | 6.3 | ||
| Census division(s) | Parry Sound, Muskoka | ||
| Census subdivision(s) | Huntsville, Bracebridge, Gravenhurst, Muskoka Lakes, Parry Sound, Seguin, Lake of Bays, McDougall, Georgian Bay, Perry | ||
The riding consists of the Territorial District of Parry Sound (excluding the Town of Powassan, the townships of Nipissing and North Himsworth, and the part of the Town of Killarney contained in the district), the District Municipality of Muskoka, and the part of the Town of Kearney lying in the Territorial District of Nipissing.
In 2004, Liberal Andy Mitchell was elected Member of Parliament for the district, and was the Minister of Agriculture. He was narrowly defeated in the 2006 election by Conservative Tony Clement, who was the President of the Treasury Board until November 4, 2015.
History
Parry Sound—Muskoka was created in 1947 from parts of Muskoka, Nipissing and Parry Sound ridings.
It consisted initially of the territorial districts of Parry Sound and Muskoka (excluding the township of Baxter), and the following townships in the territorial district of Nipissing: Ballantyne, Wilkes, Pentland, Boyd, Paxton, Biggar, Osler, Lister, Butt, Devine, Bishop, Freswick, McCraney, Hunter, McLaughlin, Bower, Finlayson, Peck, Canisbay and Sproule.
In 1966, it was redefined to consist of the territorial districts of Muskoka and Parry Sound, and Georgian Bay Islands National Park except Flower Pot Island.
In 1976, it was redefined to consist of the Territorial District of Parry Sound, the District Municipality of Muskoka, and the part of Territorial District of Nipissing lying south and west of and including the townships of Ballantyne, Boulter, Lauder, Boyd, Lister, Freswick, Bower and Sproule. In 1987, the Nipissing portions of the riding were removed.
In 1996, the riding was expanded to include the townships of Sherborne, McClintock, Livingstone, Lawrence and Nightingale in the County of Haliburton. The towns of Powassan and Trout Creek and the townships of Nipissing, North Himsworth and South Himsworth in the Territorial District of Parry Sound were excluded from the riding.
In 2003, it was given its current boundaries as described above. There were no changes after the 2012 electoral redistribution.
Members of Parliament
This riding has elected the following Members of Parliament:
| Parliament | Years | Member | Party | |
|---|---|---|---|---|
| Parry Sound—Muskoka Riding created from Muskoka, Nipissing and Parry Sound |
||||
| 21st | 1949–1953 | Wilfred McDonald | Liberal | |
| 22nd | 1953–1957 | |||
| 23rd | 1957–1958 | Gordon Aiken | Progressive Conservative | |
| 24th | 1958–1962 | |||
| 25th | 1962–1963 | |||
| 26th | 1963–1965 | |||
| 27th | 1965–1968 | |||
| 28th | 1968–1972 | |||
| 29th | 1972–1974 | Stan Darling | ||
| 30th | 1974–1979 | |||
| 31st | 1979–1980 | |||
| 32nd | 1980–1984 | |||
| 33rd | 1984–1988 | |||
| 34th | 1988–1993 | |||
| 35th | 1993–1997 | Andy Mitchell | Liberal | |
| 36th | 1997–2000 | |||
| 37th | 2000–2004 | |||
| 38th | 2004–2006 | |||
| 39th | 2006–2008 | Tony Clement | Conservative | |
| 40th | 2008–2011 | |||
| 41st | 2011–2015 | |||
| 42nd | 2015–2018 | |||
| 2018–2019 | Independent | |||
| 43rd | 2019–present | Scott Aitchison | Conservative | |
Election results
| 2019 Canadian federal election | ||||||||
|---|---|---|---|---|---|---|---|---|
| Party | Candidate | Votes | % | ±% | Expenditures | |||
| Conservative | Scott Aitchison | 22,845 | 41.8 | -1.50 | $77,914.80 | |||
| Liberal | Trisha Cowie | 16,615 | 30.4 | -8.48 | $71,267.46 | |||
| Green | Gord Miller | 8,409 | 15.4 | +8.18 | $55,284.74 | |||
| New Democratic | Tom Young | 6,417 | 11.7 | +1.59 | none listed | |||
| Independent | Daniel Predie Jr | 377 | 0.7 | – | none listed | |||
| Total valid votes/Expense limit | 54,663 | 100.0 | ||||||
| Total rejected ballots | 392 | |||||||
| Turnout | 55,055 | 66.4 | ||||||
| Eligible voters | 82,930 | |||||||
| Conservative hold | Swing | +3.49 | ||||||
| Source: Elections Canada[3][4] | ||||||||
| 2015 Canadian federal election | ||||||||
|---|---|---|---|---|---|---|---|---|
| Party | Candidate | Votes | % | ±% | Expenditures | |||
| Conservative | Tony Clement | 22,206 | 43.30 | -12.43 | $135,346.97 | |||
| Liberal | Trisha Cowie | 19,937 | 38.88 | +27.40 | $54,044.00 | |||
| New Democratic | Matthew McCarthy | 5,183 | 10.11 | -14.06 | $14,429.33 | |||
| Green | Glen Hodgson | 3,704 | 7.22 | -0.92 | $9,993.57 | |||
| Pirate | Duncan Bell | 121 | 0.24 | – | ||||
| Canadian Action | Gordie Merton | 88 | 0.17 | – | ||||
| Marxist–Leninist | Albert Gray Smith | 40 | 0.08 | -0.04 | – | |||
| Total valid votes/Expense limit | 51,279 | 100.00 | +10.49 | $221,183.08 | ||||
| Total rejected ballots | 134 | 0.26 | -0.03 | |||||
| Turnout | 51,413 | 67.96 | +2.85 | |||||
| Eligible voters | 75,642 | +4.43 | ||||||
| Conservative hold | Swing | -19.92 | ||||||
Source(s) | ||||||||
| 2011 Canadian federal election | ||||||||
|---|---|---|---|---|---|---|---|---|
| Party | Candidate | Votes | % | ±% | Expenditures | |||
| Conservative | Tony Clement | 25,864 | 55.73 | +5.55 | $ 68,527.11 | |||
| New Democratic | Wendy Wilson | 11,217 | 24.17 | +11.86 | 16.583.78 | |||
| Liberal | Cindy Waters | 5,330 | 11.48 | -13.51 | 25,599.58 | |||
| Green | Glen Hodgson | 3,776 | 8.14 | -3.63 | 12,055.16 | |||
| Independent | David Carmichael | 168 | 0.36 | 1,086.61 | ||||
| Marxist–Leninist | Albert Gray Smith | 54 | 0.12 | – | ||||
| Total valid votes/Expense limit | 46,409 | 100.00 | +6.68 | $ 89,717.72 | ||||
| Total rejected ballots | 133 | 0.29 | +0.07 | |||||
| Turnout | 46,542 | 65.11 | +2.40 | |||||
| Eligible voters | 71,477 | +2.82 | ||||||
| Conservative hold | Swing | -3.16 | ||||||
| 2008 Canadian federal election | ||||||||
|---|---|---|---|---|---|---|---|---|
| Party | Candidate | Votes | % | ±% | Expenditures | |||
| Conservative | Tony Clement | 21,831 | 50.19 | +10.09 | $ 85,379.18 | |||
| Liberal | Jamie McGarvey | 10,871 | 24.99 | −15.05 | 53,208.34 | |||
| New Democratic | Jo-Anne Boulding | 5,355 | 12.31 | +0.46 | 11,360.08 | |||
| Green | Glen Hodgson | 5,119 | 11.77 | +3.75 | 9,469.06 | |||
| Independent | David Rowland | 325 | 0.75 | 620.00 | ||||
| Total valid votes/Expense Limit | 43,501 | 100.0 | -5.78 | $ 86,569.39 | ||||
| Rejected, unmarked and declined ballots | 93 | 0.21 | −0.10 | |||||
| Turnout | 43,594 | 62.71 | −4.83 | |||||
| Electors on the lists | 69,514 | +1.37 | ||||||
| Conservative hold | Swing | +12.57 | ||||||
| 2006 Canadian federal election | ||||||||
|---|---|---|---|---|---|---|---|---|
| Party | Candidate | Votes | % | ±% | Expenditures | |||
| Conservative | Tony Clement | 18,513 | 40.10 | +3.75 | $ 78,455.14 | |||
| Liberal | Andy Mitchell | 18,485 | 40.04 | −3.82 | 76,877.80 | |||
| New Democratic | Jo-Anne Boulding | 5,472 | 11.85 | +0.08 | 17,712.85 | |||
| Green | Glen Hodgson | 3,701 | 8.02 | – | 4,700.60 | |||
| Total valid votes | 46,171 | 100.0 | +5.09 | $ 80,177.85 | ||||
| Rejected, unmarked and declined ballots | 147 | 0.32 | +0.03 | |||||
| Turnout | 46,318 | 67.54 | +3.51 | |||||
| Electors on the lists | 68,577 | -0.35 | ||||||
| Conservative gain from Liberal | Swing | +3.78 | ||||||
| 2004 Canadian federal election | ||||||||
|---|---|---|---|---|---|---|---|---|
| Party | Candidate | Votes | % | ±% | Expenditures | |||
| Liberal | Andy Mitchell | 19,271 | 43.86 | −3.73 | $73,114 | |||
| Conservative | Keith Montgomery | 15,970 | 36.35 | −7.57 | $64,246 | |||
| New Democratic | Jo-Anne Boulding | 5,171 | 11.77 | +7.31 | $10,914 | |||
| Green | Glen Hodgson | 3,524 | 8.02 | +3.99 | $4,271 | |||
| Total valid votes | 43,936 | 100.00 | ||||||
| Rejected, unmarked and declined ballots | 126 | 0.29 | −0.07 | |||||
| Turnout | 44,062 | 64.03 | +5.33 | |||||
| Electors on the lists | 68,819 | |||||||
| Percentage change figures are factored for redistribution. Conservative Party percentages are contrasted with the combined Canadian Alliance and Progressive Conservative percentages from 2000. | ||||||||
| Sources: Official Results, Elections Canada and Financial Returns, Elections Canada. | ||||||||
| 2000 Canadian federal election | ||||||||
|---|---|---|---|---|---|---|---|---|
| Party | Candidate | Votes | % | ±% | Expenditures | |||
| Liberal | Andy Mitchell | 17,911 | 47.52 | +5.92 | $50,894 | |||
| Alliance | George Stripe | 9,569 | 25.39 | −0.17 | $27,742 | |||
| Progressive Conservative | Keith Montgomery | 7,055 | 18.72 | −8.07 | $32,500 | |||
| New Democratic | Joanne Bury | 1,665 | 4.42 | +0.44 | $4,021 | |||
| Green | Richard Thomas | 1,495 | 3.97 | +2.77 | $1,893 | |||
| Total valid votes | 37,695 | 100.00 | ||||||
| Rejected, unmarked and declined ballots | 134 | 0.35 | +0.04 | |||||
| Turnout | 37,829 | 58.70 | −10.41 | |||||
| Electors on the lists | 64,448 | |||||||
| Sources: Official Results, Elections Canada and Financial Returns, Elections Canada. | ||||||||
| 1997 Canadian federal election | ||||||||
|---|---|---|---|---|---|---|---|---|
| Party | Candidate | Votes | % | ±% | Expenditures | |||
| Liberal | Andy Mitchell | 17,752 | 41.60 | −2.39 | $50,060 | |||
| Progressive Conservative | Lewis MacKenzie | 11,435 | 26.79 | +6.13 | $57,680 | |||
| Reform | Peter Spadzinski | 10,909 | 25.56 | −2.71 | $37,010 | |||
| New Democratic | Carl Wirth | 1,700 | 3.98 | −0.77 | $9,543 | |||
| Green | Glen Hodgson | 513 | 1.20 | $1,385 | ||||
| Canadian Action | Jackie Raney | 236 | 0.55 | $1,277 | ||||
| Natural Law | Rick Alexander | 133 | 0.31 | $0 | ||||
| Total valid votes | 42,678 | 100.00 | ||||||
| Rejected, unmarked and declined ballots | 135 | 0.32 | −0.15 | |||||
| Turnout | 42,813 | 69.11 | +0.01 | |||||
| Electors on the lists | 61,951 | |||||||
| Percentage change figures are factored for redistribution. | ||||||||
| Sources: Official Results, Elections Canada and Financial Returns, Elections Canada. | ||||||||
| 1993 Canadian federal election | ||||||||
|---|---|---|---|---|---|---|---|---|
| Party | Candidate | Votes | % | ±% | Expenditures | |||
| Liberal | Andy Mitchell | 20,427 | 44.22 | +13.13 | $35,935 | |||
| Reform | Jim Newman | 13,022 | 28.19 | $33,012 | ||||
| Progressive Conservative | Terry Clarke | 9,529 | 20.63 | −22.62 | $47,594 | |||
| New Democratic Party | Shirley Davy | 2,164 | 4.68 | −20.98 | $22,828 | |||
| National | John Marshall | 581 | 1.26 | $529 | ||||
| Natural Law | Russell Guest | 263 | 0.57 | $0 | ||||
| Independent | John Farr | 181 | 0.39 | $0 | ||||
| Abolitionist | Jim Journeau | 26 | 0.06 | $0 | ||||
| Total valid votes | 46,193 | 100.00 | ||||||
| Rejected, unmarked and declined ballots | 215 | 0.46 | 0.00 | |||||
| Turnout | 46,408 | 69.11 | −0.63 | |||||
| Electors on the lists | 67,150 | |||||||
| Source: Thirty-fifth General Election, 1993: Official Voting Results, Published by the Chief Electoral Officer of Canada. Financial figures taken from official contributions and expenses provided by Elections Canada. | ||||||||
| 1988 Canadian federal election | ||||||||
|---|---|---|---|---|---|---|---|---|
| Party | Candidate | Votes | % | ±% | Expenditures | |||
| Progressive Conservative | Stan Darling | 17,232 | 43.25 | $39,582 | ||||
| Liberal | Jamie McGarvey | 12,386 | 31.09 | – | $28,035 | |||
| New Democratic | Joanne Malchuk | 10,225 | 25.66 | $47,108 | ||||
| Total valid votes | 39,843 | 100.00 | ||||||
| Total rejected ballots | 187 | 0.47 | ||||||
| Turnout | 40,030 | 69.74 | ||||||
| Electors on the lists | 57,396 | |||||||
| Source: Report of the Chief Electoral Officer, Thirty-fourth General Election, 1988. | ||||||||
| 1984 Canadian federal election | ||||||||
|---|---|---|---|---|---|---|---|---|
| Party | Candidate | Votes | % | ±% | ||||
| Progressive Conservative | Stan Darling | 22,739 | 57.2 | +15.2 | ||||
| Liberal | Ed Fisher | 9,555 | 24.1 | -11.6 | ||||
| New Democratic | Dennis Hay | 7,113 | 17.9 | -4.4 | ||||
| Independent | John Kellock | 316 | 0.8 | |||||
| Total valid votes | 39,723 | 100.0 | ||||||
| 1980 Canadian federal election | ||||||||
|---|---|---|---|---|---|---|---|---|
| Party | Candidate | Votes | % | ±% | ||||
| Progressive Conservative | Stan Darling | 14,333 | 42.1 | -10.5 | ||||
| Liberal | Ed Fisher | 12,149 | 35.6 | +5.4 | ||||
| New Democratic | Dennis Hay | 7,603 | 22.3 | +5.2 | ||||
| Total valid votes | 34,085 | 100.0 | ||||||
| 1979 Canadian federal election | ||||||||
|---|---|---|---|---|---|---|---|---|
| Party | Candidate | Votes | % | ±% | ||||
| Progressive Conservative | Stan Darling | 19,223 | 52.6 | +8.3 | ||||
| Liberal | Ed Fisher | 11,070 | 30.3 | -6.0 | ||||
| New Democratic | Dennis Hay | 6,270 | 17.1 | -2.3 | ||||
| Total valid votes | 36,563 | 100.0 | ||||||
| 1974 Canadian federal election | ||||||||
|---|---|---|---|---|---|---|---|---|
| Party | Candidate | Votes | % | ±% | ||||
| Progressive Conservative | Stan Darling | 14,030 | 44.2 | -3.2 | ||||
| Liberal | Ted Leslie | 11,499 | 36.3 | +6.9 | ||||
| New Democratic | Anne Malton | 6,178 | 19.5 | -3.7 | ||||
| Total valid votes | 31,707 | 100.0 | ||||||
| 1972 Canadian federal election | ||||||||
|---|---|---|---|---|---|---|---|---|
| Party | Candidate | Votes | % | ±% | ||||
| Progressive Conservative | Stan Darling | 14,297 | 47.5 | -0.2 | ||||
| Liberal | Al Knapp | 8,828 | 29.3 | -8.8 | ||||
| New Democratic | Anne Malton | 6,983 | 23.2 | +9.1 | ||||
| Total valid votes | 30,108 | 100.0 | ||||||
| 1968 Canadian federal election | ||||||||
|---|---|---|---|---|---|---|---|---|
| Party | Candidate | Votes | % | ±% | ||||
| Progressive Conservative | Gordon Harvey Aiken | 12,045 | 47.7 | -4.7 | ||||
| Liberal | Gerald M. Taylor | 9,622 | 38.1 | +7.3 | ||||
| New Democratic | Hugh A. Bishop | 3,568 | 14.1 | -2.7 | ||||
| Total valid votes | 25,235 | 100.0 | ||||||
| 1965 Canadian federal election | ||||||||
|---|---|---|---|---|---|---|---|---|
| Party | Candidate | Votes | % | ±% | ||||
| Progressive Conservative | Gordon Harvey Aiken | 11,777 | 52.4 | +5.6 | ||||
| Liberal | Charles Barnett | 6,922 | 30.8 | -10.1 | ||||
| New Democratic | Hugh A. Bishop | 3,773 | 16.8 | +8.4 | ||||
| Total valid votes | 22,472 | 100.0 | ||||||
| 1963 Canadian federal election | ||||||||
|---|---|---|---|---|---|---|---|---|
| Party | Candidate | Votes | % | ±% | ||||
| Progressive Conservative | Gordon Harvey Aiken | 12,132 | 46.8 | -4.5 | ||||
| Liberal | Gerald M. Taylor | 10,598 | 40.9 | +3.2 | ||||
| New Democratic | Ward Agnew | 2,169 | 8.4 | -2.6 | ||||
| Social Credit | Alex S. MacDonald | 1,033 | 4.0 | |||||
| Total valid votes | 25,932 | 100.0 | ||||||
| 1962 Canadian federal election | ||||||||
|---|---|---|---|---|---|---|---|---|
| Party | Candidate | Votes | % | ±% | ||||
| Progressive Conservative | Gordon Harvey Aiken | 13,135 | 51.3 | -10.4 | ||||
| Liberal | Jim Jordan | 9,646 | 37.7 | +9.4 | ||||
| New Democratic | Hugh Bishop | 2,817 | 11.0 | +1.0 | ||||
| Total valid votes | 25,598 | 100.0 | ||||||
Note: NDP vote is compared to CCF vote in 1958 election.
| 1958 Canadian federal election | ||||||||
|---|---|---|---|---|---|---|---|---|
| Party | Candidate | Votes | % | ±% | ||||
| Progressive Conservative | Gordon Harvey Aiken | 14,888 | 61.7 | +3.7 | ||||
| Liberal | Earl McDonald | 6,833 | 28.3 | -13.7 | ||||
| Co-operative Commonwealth | Hugh A. Bishop | 2,414 | 10.0 | |||||
| Total valid votes | 24,135 | 100.0 | ||||||
| 1957 Canadian federal election | ||||||||
|---|---|---|---|---|---|---|---|---|
| Party | Candidate | Votes | % | ±% | ||||
| Progressive Conservative | Gordon Harvey Aiken | 14,014 | 58.0 | +13.9 | ||||
| Liberal | Gerald M. Taylor | 10,161 | 42.0 | -7.7 | ||||
| Total valid votes | 24,175 | 100.0 | ||||||
| 1953 Canadian federal election | ||||||||
|---|---|---|---|---|---|---|---|---|
| Party | Candidate | Votes | % | ±% | ||||
| Liberal | Bucko McDonald | 10,940 | 49.8 | +1.3 | ||||
| Progressive Conservative | Stan Darling | 9,690 | 44.1 | +3.2 | ||||
| Co-operative Commonwealth | Edward John Lawrence | 1,352 | 6.2 | -4.4 | ||||
| Total valid votes | 21,982 | 100.0 | ||||||
| 1949 Canadian federal election | ||||||||
|---|---|---|---|---|---|---|---|---|
| Party | Candidate | Votes | % | |||||
| Liberal | Bucko McDonald | 11,636 | 48.5 | |||||
| Progressive Conservative | James M. MacDonnell | 9,816 | 40.9 | |||||
| Co-operative Commonwealth | Earle Torrie Taylor | 2,535 | 10.6 | |||||
| Total valid votes | 23,987 | 100.0 | ||||||
References
- "(Code 35069) Census Profile". 2011 census. Statistics Canada. 2012. Retrieved 2011-03-03.
- Riding history from the Library of Parliament
- 2011 results from Elections Canada
Notes
- Statistics Canada: 2012
- Statistics Canada: 2012
- "List of confirmed candidates". Elections Canada. Retrieved October 4, 2019.
- "Election Night Results". Elections Canada. Retrieved October 30, 2019.
.png.webp)