Sarnia—Lambton
Sarnia—Lambton (formerly known as Sarnia) is a federal electoral district in Ontario, Canada, that has been represented in the House of Commons of Canada since 1968. It is located in the area of the city of Sarnia, in the southwest corner of the province of Ontario.
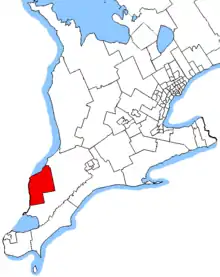 Sarnia—Lambton in relation to other southern Ontario electoral districts | |||
| Federal electoral district | |||
| Legislature | House of Commons | ||
| MP |
Conservative | ||
| District created | 1976 | ||
| First contested | 1979 | ||
| Last contested | 2019 | ||
| District webpage | profile, map | ||
| Demographics | |||
| Population (2016)[1] | 105,337 | ||
| Electors (2015) | 80,029 | ||
| Area (km²)[2] | 1,568 | ||
| Pop. density (per km²) | 67.2 | ||
| Census division(s) | Lambton County | ||
| Census subdivision(s) | Sarnia, St. Clair, Plympton-Wyoming, Petrolia, Enniskillen, Point Edward | ||
Until 2015, Sarnia—Lambton, with its predecessors Sarnia, and Lambton West, was Canada's most bellwetherly riding, having voted for the winning party from 1963 to 2011.
History
It was created as Sarnia electoral district in 1966 from parts of Lambton West riding. It consisted of that part of the County of Lambton contained in the City of Sarnia and the Townships of Moore, Sarnia and Plympton excepting the Town of Forest.
In 1970, the name of the electoral district was changed to Sarnia—Lambton.
It was abolished in 1976 when it was redistributed between Lambton—Middlesex and a new Sarnia riding. The new Sarnia riding consisted of that part of the County of Lambton contained in the City of Sarnia, the Townships of Moore and Sarnia, the Village of Point Edward, and Indian Reserve No. 45.
The name of this electoral district was changed in 1981 to Sarnia—Lambton again.
In 1996, the riding was redefined to exclude the township of Sarnia and include the township of Sombra.
In 2003, it was redefined to consist of that part of the County of Lambton comprising the City of Sarnia, the towns of Petrolia and Plympton-Wyoming, the villages of Oil Springs and Point Edward, the townships of Enniskillen and St. Clair, and Sarnia Indian Reserve No. 45.
This riding was left unchanged after the 2012 electoral redistribution.
Demographics
- According to the Canada 2011 Census; 2013 representation[3][4]
Ethnic groups: 93.4% White, 3.0% Aboriginal, 1.1% South Asian
Languages: 97.3% English
Religions: 70.3% Christian (27.3% Catholic, 14.2% United Church, 7.2% Anglican, 4.5% Presbyterian, 3.3% Baptist, 1.7% Pentecostal, 1.0% Lutheran, 11.0% Other), 27.7% No religion
Median income (2010): $30,245
Average income (2010): $41,900
Members of Parliament
| Parliament | Years | Member | Party | |
|---|---|---|---|---|
| Sarnia Riding created from Lambton West |
||||
| 28th | 1968–1972 | Bud Cullen | Liberal | |
| Sarnia—Lambton | ||||
| 29th | 1972–1974 | Bud Cullen | Liberal | |
| 30th | 1974–1979 | |||
| Sarnia | ||||
| 31st | 1979–1980 | Bill Campbell | Progressive Conservative | |
| 32nd | 1980–1984 | Bud Cullen | Liberal | |
| Sarnia—Lambton | ||||
| 33rd | 1984–1988 | Ken James | Progressive Conservative | |
| 34th | 1988–1993 | |||
| 35th | 1993–1997 | Roger Gallaway | Liberal | |
| 36th | 1997–2000 | |||
| 37th | 2000–2004 | |||
| 38th | 2004–2006 | |||
| 39th | 2006–2008 | Pat Davidson | Conservative | |
| 40th | 2008–2011 | |||
| 41st | 2011–2015 | |||
| 42nd | 2015–2019 | Marilyn Gladu | ||
| 43rd | 2019–present | |||
Election results
Sarnia—Lambton
| 2019 Canadian federal election | ||||||||
|---|---|---|---|---|---|---|---|---|
| Party | Candidate | Votes | % | ±% | Expenditures | |||
| Conservative | Marilyn Gladu | 28,623 | 49.4 | $72,937.71 | ||||
| New Democratic | Adam Kilner | 12,644 | 21.8 | $14,696.37 | ||||
| Liberal | Carmen Lemieux | 12,041 | 20.8 | none listed | ||||
| Green | Peter Robert Smith | 2,490 | 4.3 | $4,385.10 | ||||
| People's | Brian Everaert | 1,587 | 2.7 | $0.00 | ||||
| Christian Heritage | Thomas Laird | 531 | 0.9 | $13,871.28 | ||||
| Total valid votes/Expense limit | 57,916 | 100.0 | ||||||
| Total rejected ballots | 400 | |||||||
| Turnout | 58,316 | 68.7 | ||||||
| Eligible voters | 84,875 | |||||||
| Source: Elections Canada[5][6] | ||||||||
| 2015 Canadian federal election | ||||||||
|---|---|---|---|---|---|---|---|---|
| Party | Candidate | Votes | % | ±% | Expenditures | |||
| Conservative | Marilyn Gladu | 22,565 | 38.8 | -14.2 | $106,570.00 | |||
| New Democratic | Jason Wayne McMichael | 18,102 | 31.1 | +1.19 | $79,797.05 | |||
| Liberal | Dave McPhail | 15,853 | 27.3 | +13.34 | $66,577.19 | |||
| Green | Peter Smith | 1,605 | 2.8 | +0.28 | $5,020.87 | |||
| Total valid votes/Expense limit | 58,125 | 100.0 | $215,882.55 | |||||
| Total rejected ballots | 267 | – | – | |||||
| Turnout | 58,392 | 72.47 | +9.22 | |||||
| Eligible voters | 80,565 | |||||||
| Conservative hold | Swing | -7.70 | ||||||
| Source: Elections Canada[7][8] | ||||||||
| 2011 Canadian federal election | ||||||||
|---|---|---|---|---|---|---|---|---|
| Party | Candidate | Votes | % | ±% | Expenditures | |||
| Conservative | Pat Davidson | 26,112 | 52.58 | +2.58 | – | |||
| New Democratic | Brian White | 14,856 | 29.91 | +8.28 | – | |||
| Liberal | Tim Fugard | 6,931 | 13.96 | -6.31 | – | |||
| Green | Timothy van Bodegom | 1,252 | 2.52 | -4.38 | – | |||
| Christian Heritage | Christopher Desormeaux-Malm | 514 | 1.03 | -0.14 | – | |||
| Total valid votes/Expense limit | 49,665 | 100.00 | ||||||
| Total rejected ballots | 205 | 0.41 | +0.02 | |||||
| Turnout | 49,870 | 63.25 | +4.58 | |||||
| Eligible voters | 78,849 | – | – | |||||
| 2008 Canadian federal election | ||||||||
|---|---|---|---|---|---|---|---|---|
| Party | Candidate | Votes | % | ±% | Expenditures | |||
| Conservative | Pat Davidson | 23,195 | 50.00 | +9.03 | $57,939 | |||
| New Democratic | Andy Bruziewicz | 10,037 | 21.63 | +1.61 | $15,499 | |||
| Liberal | Tim Fugard | 9,404 | 20.27 | -12.84 | $29,860 | |||
| Green | Allan McKeown | 3,201 | 6.9 | +3.69 | $9,315 | |||
| Christian Heritage | Christopher Desormeaux-Malm | 545 | 1.17 | +0.90 | $5,676 | |||
| Total valid votes/Expense limit | 46,382 | 100.00 | $85,252 | |||||
| Total valid votes/Expense limit | – | 100.00 | ||||||
| Total rejected ballots | 180 | 0.39 | -0.09 | |||||
| Turnout | 46,562 | 58.66 | -9.21 | |||||
| Eligible voters | 79,371 | – | – | |||||
| 2006 Canadian federal election | ||||||||
|---|---|---|---|---|---|---|---|---|
| Party | Candidate | Votes | % | ±% | ||||
| Conservative | Pat Davidson | 21,841 | 40.97 | +10.5 | ||||
| Liberal | Roger Gallaway | 17,649 | 33.11 | -8.8 | ||||
| New Democratic | Greg Agar | 10,673 | 20.02 | +3.7 | ||||
| Green | Mike Jacobs | 1,712 | 3.21 | -2.2 | ||||
| Christian Heritage | Gary DeBoer | 1,108 | 2.07 | -1.7 | ||||
| Independent | John Elliot | 316 | 0.59 | +0.1 | ||||
| Total valid votes | 53,299 | 100.00 | ||||||
| Total rejected ballots | 257 | 0.48 | – | |||||
| Turnout | 53,556 | 67.87 | – | |||||
| Eligible voters | 78,909 | – | – | |||||
| 2004 Canadian federal election | ||||||||
|---|---|---|---|---|---|---|---|---|
| Party | Candidate | Votes | % | ±% | ||||
| Liberal | Roger Gallaway | 19,932 | 41.9 | +38.3 | ||||
| Conservative | Marcel Beaubien | 14,500 | 30.5 | -7.9 | ||||
| New Democratic | Greg Agar | 7,764 | 16.3 | +9.1 | ||||
| Green | Anthony Cramer | 2,548 | 5.4 | +4.0 | ||||
| Christian Heritage | Gary DeBoer | 1,819 | 3.8 | |||||
| Independent | Dave Core | 749 | 1.6 | |||||
| Independent | John Elliot | 229 | 0.5 | 0.0 | ||||
| Total valid votes | 47,541 | 100.0 | ||||||
Note: Conservative vote is compared to the total of the Canadian Alliance vote and Progressive Conservative vote in 2000 election.
| 2000 Canadian federal election | ||||||||
|---|---|---|---|---|---|---|---|---|
| Party | Candidate | Votes | % | ±% | ||||
| Liberal | Roger Gallaway | 19 329 | 51.0 | +3.6 | ||||
| Alliance | Dave Christie | 11 208 | 29.6 | +4.9 | ||||
| Progressive Conservative | Paul Bailey | 3 320 | 8.8 | -5.8 | ||||
| New Democratic | Glenn Sonier | 2 735 | 7.2 | -0.9 | ||||
| Green | Allan McKeown | 514 | 1.4 | |||||
| Independent | Ed Banninga | 356 | 0.9 | |||||
| Independent | John Elliott | 189 | 0.5 | -0.5 | ||||
| Canadian Action | Rene Phillion | 145 | 0.4 | 0.0 | ||||
| Natural Law | Shannon Bourke | 92 | 0.2 | -0.1 | ||||
| Marxist–Leninist | Andre C. Vachon | 32 | 0.1 | 0.1 | ||||
| Total valid votes | 37,920 | 100.0 | ||||||
Note: Canadian Alliance vote is compared to the Reform vote in 1997 election.
| 1997 Canadian federal election | ||||||||
|---|---|---|---|---|---|---|---|---|
| Party | Candidate | Votes | % | ±% | ||||
| Liberal | Roger Gallaway | 19,494 | 47.4 | -0.2 | ||||
| Reform | Dave Christie | 10,172 | 24.7 | +3.5 | ||||
| Progressive Conservative | Dick Carpani | 6,008 | 14.6 | -8.1 | ||||
| New Democratic | Phil Gamester | 3,320 | 8.1 | +1.9 | ||||
| Christian Heritage | Paul Van Oosten | 1,472 | 3.6 | +2.1 | ||||
| Independent | John Elliott | 402 | 1.0 | +0.5 | ||||
| Canadian Action | Philip G. Holley | 175 | 0.4 | |||||
| Natural Law | Shannon Bourke | 125 | 0.3 | -0.1 | ||||
| Total valid votes | 41,168 | 100.0 | ||||||
| 1993 Canadian federal election | ||||||||
|---|---|---|---|---|---|---|---|---|
| Party | Candidate | Votes | % | ±% | ||||
| Liberal | Roger Gallaway | 20,331 | 47.5 | +15.7 | ||||
| Progressive Conservative | Ken James | 9,706 | 22.7 | -22.4 | ||||
| Reform | Bruce Brogden | 9,061 | 21.2 | |||||
| New Democratic | Julie Foley | 2,634 | 6.2 | -16.1 | ||||
| Christian Heritage | Louis Duke | 610 | 1.4 | |||||
| Independent | John Kenneth Elliot | 192 | 0.4 | -0.5 | ||||
| Natural Law | Shannon M. Bourke | 178 | 0.4 | |||||
| Independent | O'Doug Dell | 68 | 0.2 | |||||
| Total valid votes | 42,780 | 100.0 | ||||||
| 1988 Canadian federal election | ||||||||
|---|---|---|---|---|---|---|---|---|
| Party | Candidate | Votes | % | ±% | ||||
| Progressive Conservative | Ken James | 19,304 | 45.0 | -9.6 | ||||
| Liberal | Joe Foreman | 13,624 | 31.8 | +6.1 | ||||
| New Democratic | Julie Foley | 9,525 | 22.2 | +2.8 | ||||
| Rhinoceros | John Elliott | 408 | 1.0 | |||||
| Total valid votes | 42,861 | 100.0 | ||||||
| 1984 Canadian federal election | ||||||||
|---|---|---|---|---|---|---|---|---|
| Party | Candidate | Votes | % | ±% | ||||
| Progressive Conservative | Ken James | 24,066 | 54.6 | +19.8 | ||||
| Liberal | Michael Bradley | 11,313 | 25.7 | -14.9 | ||||
| New Democratic | Julie Foley | 8,538 | 19.4 | -5.1 | ||||
| Independent | Douglas O'Dell | 90 | 0.2 | |||||
| Independent | Fred Kahanek | 51 | 0.1 | |||||
| Total valid votes | 44,058 | 100.0 | ||||||
Sarnia
| 1980 Canadian federal election | ||||||||
|---|---|---|---|---|---|---|---|---|
| Party | Candidate | Votes | % | ±% | ||||
| Liberal | Bud Cullen | 16,275 | 40.6 | +5.9 | ||||
| Progressive Conservative | Bill Campbell | 13,986 | 34.9 | -5.1 | ||||
| New Democratic | Wally Krawczyk | 9,809 | 24.4 | -0.9 | ||||
| Marxist–Leninist | Pedro Villamizar | 52 | 0.1 | |||||
| Total valid votes | 40,122 | 100.0 | ||||||
| 1979 Canadian federal election | ||||||||
|---|---|---|---|---|---|---|---|---|
| Party | Candidate | Votes | % | ±% | ||||
| Progressive Conservative | Bill Campbell | 15,990 | 40.0 | +13.7 | ||||
| Liberal | Bud Cullen | 13,872 | 34.7 | -22.0 | ||||
| New Democratic | Wally Krawczyk | 10,148 | 25.4 | +8.3 | ||||
| Total valid votes | 40,010 | 100.0 | ||||||
Sarnia—Lambton
| 1974 Canadian federal election | ||||||||
|---|---|---|---|---|---|---|---|---|
| Party | Candidate | Votes | % | ±% | ||||
| Liberal | Bud Cullen | 20,661 | 56.7 | +13.9 | ||||
| Progressive Conservative | John Kowalyshyn | 9,579 | 26.3 | -12.6 | ||||
| New Democratic | Wallace Krawczyk | 6,217 | 17.1 | -1.3 | ||||
| Total valid votes | 36,457 | 100.0 | ||||||
| 1972 Canadian federal election | ||||||||
|---|---|---|---|---|---|---|---|---|
| Party | Candidate | Votes | % | ±% | ||||
| Liberal | Bud Cullen | 16,112 | 42.8 | -2.5 | ||||
| Progressive Conservative | Andy Brandt | 14,647 | 38.9 | -1.1 | ||||
| New Democratic | David Bell | 6,901 | 18.3 | +3.6 | ||||
| Total valid votes | 37,660 | 100.0 | ||||||
Sarnia
| 1968 Canadian federal election | ||||||||
|---|---|---|---|---|---|---|---|---|
| Party | Candidate | Votes | % | |||||
| Liberal | Jack Sydney George Cullen | 14,573 | 45.3 | |||||
| Progressive Conservative | Dick Ford | 12,883 | 40.0 | |||||
| New Democratic | Alex Grabove | 4,733 | 14.7 | |||||
| Total valid votes | 32,189 | 100.0 | ||||||
References
- "(Code 35078) Census Profile". 2011 census. Statistics Canada. 2012. Retrieved 2011-03-03.
Notes
- Statistics Canada: 2016
- Statistics Canada: 2012
- http://www12.statcan.gc.ca/nhs-enm/2011/dp-pd/prof/details/page.cfm?Lang=E&Geo1=FED2013&Code1=35091&Data=Count&SearchText=Sarnia&SearchType=Begins&SearchPR=01&A1=All&B1=All&Custom=&TABID=1
- http://www12.statcan.gc.ca/nhs-enm/2011/dp-pd/prof/details/page.cfm?Lang=E&Geo1=FED2013&Code1=35091&Data=Count&SearchText=Sarnia&SearchType=Begins&SearchPR=01&A1=All&B1=All&Custom=&TABID=1#tabs2
- "List of confirmed candidates". Elections Canada. Retrieved October 4, 2019.
- "Election Night Results". Elections Canada. Retrieved October 30, 2019.
- Elections Canada – Confirmed candidates for Sarnia—Lambton, 30 September 2015
- Elections Canada – Preliminary Election Expenses Limits for Candidates
External links
- Riding history for Sarnia 1966-1970 from the Library of Parliament
- Riding history for Sarnia-Lambton 1970-1976 from the Library of Parliament
- Riding history for Sarnia 1976-1981 from the Library of Parliament
- Riding history for Sarnia-Lambton 1981-2008 from the Library of Parliament
- 2011 results from Elections Canada
- Campaign expense data from Elections Canada
- Sarnia-Lambton Federal Liberal Association The Sarnia—Lambton branch of the Liberal Party of Canada.
.png.webp)