Chatham-Kent—Leamington
Chatham-Kent—Leamington is a federal electoral district in Ontario. It encompasses a portion of Ontario previously included in the electoral districts of Chatham-Kent—Essex and Essex and Lambton—Kent—Middlesex.[3]
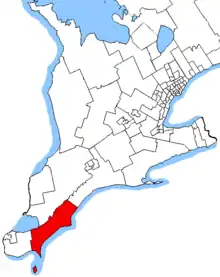 Map of southwestern Ontario showing the location of Chatham-Kent—Leamington | |||
| Federal electoral district | |||
| Legislature | House of Commons | ||
| MP |
Conservative | ||
| District created | 2013 | ||
| First contested | 2015 | ||
| Last contested | 2019 | ||
| District webpage | profile, map | ||
| Demographics | |||
| Population (2016)[1] | 109,619 | ||
| Electors (2015) | 78,803 | ||
| Area (km²)[2] | 2,183 | ||
| Pop. density (per km²) | 50.2 | ||
| Census division(s) | Chatham-Kent, Essex | ||
| Census subdivision(s) | Chatham-Kent, Lakeshore, Leamington | ||
Chatham-Kent—Leamington was created by the 2012 federal electoral boundaries redistribution and was legally defined in the 2013 representation order. It came into effect upon the call of the 42nd Canadian federal election, scheduled for 19 October 2015.[4]
Members of Parliament
This riding has elected the following Members of Parliament:
| Parliament | Years | Member | Party | |
|---|---|---|---|---|
| Chatham-Kent—Leamington Riding created from Chatham-Kent—Essex, Essex, and Lambton—Kent—Middlesex |
||||
| 42nd | 2015–2019 | Dave Van Kesteren | Conservative | |
| 43rd | 2019–present | Dave Epp | ||
Election results
Graph of election results in Chatham-Kent—Leamington (minor parties that never got 2% of the vote or didn't run consistently are omitted)
| 2019 Canadian federal election | ||||||||
|---|---|---|---|---|---|---|---|---|
| Party | Candidate | Votes | % | ±% | Expenditures | |||
| Conservative | Dave Epp | 25,359 | 46.9 | +5.19 | $112,325.66 | |||
| Liberal | Katie Omstead | 16,899 | 31.2 | -6.03 | none listed | |||
| New Democratic | Tony Walsh | 8,229 | 15.2 | -3.17 | $3,959.54 | |||
| Green | Mark Vercouteren | 2,233 | 4.1 | +1.42 | $372.30 | |||
| People's | John Balagtas | 1,061 | 2.0 | - | $1,212.06 | |||
| Marijuana | Paul Coulbeck | 307 | 0.6 | - | $0.00 | |||
| Total valid votes/Expense limit | 54,088 | 100.0 | ||||||
| Total rejected ballots | 450 | |||||||
| Turnout | 54,538 | 63.3 | ||||||
| Eligible voters | 86,165 | |||||||
| Conservative hold | Swing | +5.61 | ||||||
| Source: Elections Canada[5][6] | ||||||||
| 2015 Canadian federal election | ||||||||
|---|---|---|---|---|---|---|---|---|
| Party | Candidate | Votes | % | ±% | Expenditures | |||
| Conservative | Dave Van Kesteren | 21,677 | 41.71 | -11.49 | $119,230.26 | |||
| Liberal | Katie Omstead | 19,351 | 37.23 | +20.95 | $64,239.01 | |||
| New Democratic | Tony Walsh | 9,549 | 18.37 | -8.79 | $12,638.15 | |||
| Green | Mark Vercouleren | 1,394 | 2.68 | -0.66 | $1,379.30 | |||
| Total valid votes/Expense limit | 51,971 | 100.00 | $213,665.70 | |||||
| Total rejected ballots | 263 | 0.50 | – | |||||
| Turnout | 52,234 | 65.99 | – | |||||
| Eligible voters | 79,160 | |||||||
| Conservative notional hold | Swing | -16.22 | ||||||
| Source: Elections Canada[7][8] | ||||||||
| 2011 federal election redistributed results[9] | |||
|---|---|---|---|
| Party | Vote | % | |
| Conservative | 24,672 | 53.20 | |
| New Democratic | 12,595 | 27.16 | |
| Liberal | 7,553 | 16.29 | |
| Green | 1,551 | 3.34 | |
| Others | 4 | 0.01 | |
Demographics
- According to the Canada 2016 Census
- Most common mother tongue languages (2016) : 82.2% English, 2.6% French, 1.5% Spanish, 1.3% Portuguese, 0.9% Italian, 0.8% Arabic.[10]
References
- Statistics Canada: 2011
- Statistics Canada: 2011
- Final Report – Ontario
- Timeline for the Redistribution of Federal Electoral Districts
- "List of confirmed candidates". Elections Canada. Retrieved October 4, 2019.
- "Election Night Results". Elections Canada. Retrieved October 30, 2019.
- Elections Canada – Confirmed candidates for Chatham-Kent—Leamington, 30 September 2015
- Elections Canada – Preliminary Election Expenses Limits for Candidates Archived August 15, 2015, at the Wayback Machine
- Pundits' Guide to Canadian Elections
- https://www12.statcan.gc.ca/census-recensement/2016/dp-pd/dt-td/Rp-eng.cfm?LANG=E&APATH=3&DETAIL=0&DIM=0&FL=A&FREE=0&GC=0&GID=0&GK=0&GRP=1&PID=109979&PRID=10&PTYPE=109445&S=0&SHOWALL=0&SUB=888&Temporal=2016,2017&THEME=118&VID=0&VNAMEE=&VNAMEF=
.png.webp)
This article is issued from Wikipedia. The text is licensed under Creative Commons - Attribution - Sharealike. Additional terms may apply for the media files.