York Centre
York Centre (French: York-Centre) is a federal electoral district in Ontario, Canada, that has been represented in the House of Commons of Canada from 1904 to 1917 and since 1953.
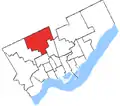
.png.webp) York Centre in relation to the other Toronto ridings (2013 boundaries) | |||
| Federal electoral district | |||
| Legislature | House of Commons | ||
| MP |
Liberal | ||
| District created | 1952 | ||
| First contested | 1953 | ||
| Last contested | 2020 | ||
| District webpage | profile, map | ||
| Demographics | |||
| Population (2011)[1] | 100,277 | ||
| Electors (2015) | 63,682 | ||
| Area (km²)[2] | 37 | ||
| Pop. density (per km²) | 2,710.2 | ||
| Census division(s) | Toronto | ||
| Census subdivision(s) | Toronto | ||
.gif)
As per the 2016 Census, 17.0% of York Centre residents are of Filipino ethnic origin and 16.0% belong to the Filipino visible minority, which are the highest such figures among all City of Toronto ridings. At the same time, the York Centre riding has the highest percentage of residents of Russian (9.5%) and Jewish (5.6%) ethnic origins (in the 2011 National Household Survey, 13.6% of York Centre residents had entered a Jewish ethnic origin).
The riding was previously considered one of the safest Liberal Party seats in Canada; however, this changed as the Conservative Party gained ground in the 2000s, and its candidate Mark Adler won the seat in 2011. However, the Liberal Party regained the seat in 2015 with its candidate Michael Levitt. Levitt was re-elected in 2019, and resigned as of September 1, 2020, to become the CEO of the Friends of Simon Wiesenthal Center for Holocaust Studies.[3] A by-election to fill the vacancy took place on October 26, 2020, which was won by Liberal Ya'ara Saks.[4][5]
Demographics
- According to the Canada 2016 Census[6]
Ethnic groups: 53.1% White, 16.5% Filipino, 7.9% Black, 5.1% Latin American, 3.5% South Asian, 3.1% Chinese, 2.9% Southeast Asian, 2.0% West Asian, 1.6% Korean
Languages: 67.7% English, 6.5% Russian, 5.5% Tagalog, 3.4% Italian, 3.2% Spanish, 1.5% Vietnamese, 1.2% Korean
Religions (2011): 58.7% Christian (35.5% Catholic, 5.8% Christian Orthodox, 1.7% Anglican, 1.6% Pentecostal, 1.4% Baptist, 12.7% Other), 19.0% Jewish, 4.1% Muslim, 2.9% Buddhist, 2.2% Hindu, 12.7% None.[7]
Median income: $26,937 (2015)
Average income: $41,225 (2015)
Geography
York Centre consists of the part of the City of Toronto bounded on the north by the northern city limit, and on the east, south and west by a line drawn from the city limit south along Bathurst Street, southeast along the Don River West Branch, southwest and west along Highway 401, north along Jane Street, east along Sheppard Avenue West, northwest along Black Creek, east along Grandravine Drive, and north along Keele Street to the city limit.
It contains the neighbourhoods of Westminster–Branson, Bathurst Manor, Wilson Heights, Downsview, and York University Heights (a small section south of Grandravine Drive, east of Black Creek).
At the approximate centre of the district is Downsview Park, an urban park controlled by the federal government, on former grounds of Canadian Forces Base Toronto.
History
York Centre was originally created in 1903 from parts of York East and York West ridings. It was created when the county of York (excluding the city of Toronto) was divided into three ridings: York Centre, York North and York South. The centre riding consisted of the townships of Etobicoke, Markham, Scarborough and Vaughan, and the villages of Markham, Richmond Hill, Weston and Woodbridge. The electoral district was abolished in 1914 when it was redistributed between York East, York South and York West. In 1952, York Centre was re-established with parts of Eglinton—Lawrence, Willowdale, York North and York West ridings.
The new riding consisted initially of the part of the township of North York west of Yonge Street, the part of the township of Vaughan south of Highway Number 7, and the town of Woodbridge.
In 1966, it was redefined to consist of the part of Metropolitan Toronto bounded on the north by the northern limit, and on the west, south and east by a line drawn from that borough limit south along Highway 400, east along Sheppard Avenue West, south along Jane Street, southeast along Exbury Road, east along Calvington Drive, south along Keele Street, east along Highway 401, south along the Canadian National Railway line, east along Lawrence Avenue West, north along the Spadina Expressway, northeast along Highway 401, north along Bathurst Street, east along Sheppard Avenue West, south along Easton Street, east along Cameron Avenue, and north along Yonge Street to the Metro Toronto limit. It is unclear why the name York Centre was retained as the district was now predominantly in the Borough of North York rather than in the Region of York.
In 1976, it was redefined to consist of the part of the Borough of North York bounded on the north by the borough limit, and on the west, south and east by a line drawn from the borough limit south along Highway 400, east along Sheppard Avenue West, south along Keele Street, east along Highway 401, north along Bathurst Street, and northwest along the West Branch of the Don River to the borough limit.
In 1987, it was redefined to consist of the part of the City of North York bounded on the north by the city limit, and on the east, south and west by a line drawn from the city limit southeast along the Don River West Branch, west along Highway 401, north along Jane Street, east along Grandravine Drive, and north along Black Creek to the northern city limit.
In 1996, it was redefined to consist of the part of the City of North York bounded on the north by the city limit, and on the east, south and west by a line drawn from the city limit south along Dufferin Street, west along Sheppard Avenue West, north along Keele Street, west along Grandravine Drive, south along Jane Street, east along Highway 401, northwest along the Don River West Branch, north along Bathurst Street, east along Drewry Avenue, north along Chelmsford Avenue, west along Greenwin Village Road, and north along Village Gate to the city limit.
In 2003, it was given its current boundaries as described above.
This riding lost territory to Willowdale and a small piece to Thornhill during the 2012 electoral redistribution.
Former boundaries
 1976 to 1976
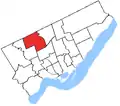 1976 to 1987
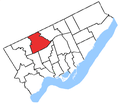 1987 to 1996
 1996 to 2003
 2003 to 2015
Members of Parliament
This riding has elected the following Members of Parliament:
| Parliament | Years | Member | Party | |
|---|---|---|---|---|
| York Centre Riding created from York East and York West |
||||
| 10th | 1904–1907 | Archibald Campbell | Liberal | |
| 1907–1908 | Peter Douglas McLean | |||
| 11th | 1908–1911 | Thomas George Wallace | Conservative | |
| 12th | 1911–1917 | |||
| Riding dissolved into York East and York South | ||||
| Riding re-created from Eglinton—Lawrence, Willowdale, York North and York West |
||||
| 22nd | 1953–1957 | Al Hollingworth | Liberal | |
| 23rd | 1957–1958 | Fred C. Stinson | Progressive Conservative | |
| 24th | 1958–1962 | |||
| 25th | 1962–1963 | James Edgar Walker | Liberal | |
| 26th | 1963–1965 | |||
| 27th | 1965–1968 | |||
| 28th | 1968–1972 | |||
| 29th | 1972–1974 | |||
| 30th | 1974–1979 | Bob Kaplan | ||
| 31st | 1979–1980 | |||
| 32nd | 1980–1984 | |||
| 33rd | 1984–1988 | |||
| 34th | 1988–1993 | |||
| 35th | 1993–1997 | Art Eggleton | ||
| 36th | 1997–2000 | |||
| 37th | 2000–2004 | |||
| 38th | 2004–2006 | Ken Dryden | ||
| 39th | 2006–2008 | |||
| 40th | 2008–2011 | |||
| 41st | 2011–2015 | Mark Adler | Conservative | |
| 42nd | 2015–2019 | Michael Levitt | Liberal | |
| 43rd | 2019–2020 | |||
| 2020–present | Ya'ara Saks | |||
Election results
2020
| Canadian federal by-election, October 26, 2020 Resignation of Michael Levitt | ||||||||
|---|---|---|---|---|---|---|---|---|
| ** Preliminary results — Not yet official ** | ||||||||
| Party | Candidate | Votes | % | ±% | Expenditures | |||
| Liberal | Ya'ara Saks | 8,253 | 45.70 | −4.50 | ||||
| Conservative | Julius Tiangson | 7,552 | 41.82 | +5.11 | ||||
| New Democratic | Andrea Vásquez Jiménez | 1,046 | 5.79 | −4.05 | ||||
| People's | Max Bernier | 642 | 3.56 | – | ||||
| Green | Sasha Zavarella | 461 | 2.55 | −0.70 | ||||
| Independent | John The Engineer Turmel | 104 | 0.58 | – | ||||
| Total valid votes/Expense limit | 18,058 | |||||||
| Total rejected ballots | ||||||||
| Turnout | 18,058 | 25.64 | −36.12 | |||||
| Eligible voters | 70,434 | |||||||
| [8] | ||||||||
| Liberal hold | Swing | −4.81 | ||||||
1953–2019
| 2019 Canadian federal election | ||||||||
|---|---|---|---|---|---|---|---|---|
| Party | Candidate | Votes | % | ±% | Expenditures | |||
| Liberal | Michael Levitt | 21,680 | 50.20 | +3.32 | $93,151.84 | |||
| Conservative | Rachel Willson | 15,852 | 36.71 | −7.29 | $89,344.00 | |||
| New Democratic | Andrea Vásquez Jiménez | 4,251 | 9.84 | +2.51 | none listed | |||
| Green | Rebecca Wood | 1,403 | 3.25 | +1.45 | $0.00 | |||
| Total valid votes/Expense limit | 43,186 | 98.48 | ||||||
| Total rejected ballots | 665 | 1.52 | +0.78 | |||||
| Turnout | 43,851 | 61.76 | -3.96 | |||||
| Eligible voters | 71,000 | |||||||
| Source: Elections Canada[9][10] | ||||||||
| Liberal hold | Swing | +5.31 | ||||||
| 2015 Canadian federal election | ||||||||
|---|---|---|---|---|---|---|---|---|
| Party | Candidate | Votes | % | ±% | Expenditures | |||
| Liberal | Michael Levitt | 20,131 | 46.88 | +13.64 | $108,171.17 | |||
| Conservative | Mark Adler | 18,893 | 43.99 | −4.54 | $139,711.85 | |||
| New Democratic | Hal Berman | 3,148 | 7.33 | −8.56 | $9,236.24 | |||
| Green | Constantine Kritsonis | 772 | 1.80 | −0.54 | $2,969.38 | |||
| Total valid votes/Expense limit | 42,944 | 99.26 | $198,977.91 | |||||
| Total rejected ballots | 319 | 0.74 | – | |||||
| Turnout | 43,263 | 65.72 | – | |||||
| Eligible voters | 65,832 | |||||||
| Liberal gain from Conservative | Swing | +9.09 | ||||||
| Source: Elections Canada[11][12][13][14] | ||||||||
| 2011 federal election redistributed results[15] | |||
|---|---|---|---|
| Party | Vote | % | |
| Conservative | 17,249 | 48.53 | |
| Liberal | 11,814 | 33.24 | |
| New Democratic | 5,649 | 15.89 | |
| Green | 831 | 2.34 | |
| 2011 Canadian federal election | ||||||||
|---|---|---|---|---|---|---|---|---|
| Party | Candidate | Votes | % | ±% | Expenditures | |||
| Conservative | Mark Adler | 20,356 | 48.5 | +10.5 | $79,794.56 | |||
| Liberal | Ken Dryden | 13,979 | 33.3 | −10.2 | $73,675.98 | |||
| New Democratic | Nick Brownlee | 6,656 | 15.9 | +3.8 | $409.63 | |||
| Green | Rosemary Frei | 979 | 2.3 | −4.1 | $342.41 | |||
| Total valid votes/Expense limit | 41,970 | 100.0 | $83,892.08 | |||||
| Total rejected ballots | 350 | 0.1 | – | |||||
| Turnout | 42,320 | 60.3 | +7.6 | |||||
| Eligible voters | 70,216 | – | – | |||||
| Conservative gain from Liberal | Swing | +10.35 | ||||||
| 2008 Canadian federal election | ||||||||
|---|---|---|---|---|---|---|---|---|
| Party | Candidate | Votes | % | ±% | Expenditures | |||
| Liberal | Ken Dryden | 16,164 | 43.5 | −9.2 | $70,386 | |||
| Conservative | Rochelle Wilner | 14,132 | 38.0 | +7.9 | $78,946 | |||
| New Democratic | Kurtis Baily | 4,503 | 12.1 | −1.7 | ||||
| Green | Rosemary Frei | 2,390 | 6.4 | +3.8 | $3,440 | |||
| Total valid votes/Expense limit | 37,189 | 100.0 | $81,864 | |||||
| Total rejected ballots | – | |||||||
| Turnout | – | 52.7 | ||||||
| 2006 Canadian federal election | ||||||||
|---|---|---|---|---|---|---|---|---|
| Party | Candidate | Votes | % | ±% | Expenditures | |||
| Liberal | Ken Dryden | 22,439 | 52.7 | −2.1 | $74,395.87 | |||
| Conservative | Michael Mostyn | 12,758 | 30.0 | +3.7 | $69,571.51 | |||
| New Democratic | Marco Iacampo | 5,834 | 13.7 | 0 | $13,721.44 | |||
| Green | Constantine Kritsonis | 1,558 | 3.7 | +0.5 | $1,644.87 | |||
| Total valid votes | 42,589 | |||||||
| 2004 Canadian federal election | ||||||||
|---|---|---|---|---|---|---|---|---|
| Party | Candidate | Votes | % | ±% | Expenditures | |||
| Liberal | Ken Dryden | 21,520 | 54.8 | −16.3 | $64,620 | |||
| Conservative | Michael Mostyn | 10,318 | 26.3 | +5.8 | $72,837 | |||
| New Democratic | Peter Flaherty | 5,376 | 13.7 | +7.7 | $10,017 | |||
| Green | Constantine Kritsonis | 1,240 | 3.2 | +1.7 | ||||
| Independent | Max Royz | 824 | 2.1 | – | $23,589 | |||
| Total valid votes | 39,278 | |||||||
| 2000 Canadian federal election | ||||||||
|---|---|---|---|---|---|---|---|---|
| Party | Candidate | Votes | % | ±% | Expenditures | |||
| Liberal | Art Eggleton | 24,793 | 71.1 | −1.0 | $56,516 | |||
| Alliance | Jeffrey Dorfman | 4,630 | 13.3 | – | $19,703 | |||
| Progressive Conservative | Mark Tweyman | 2,518 | 7.2 | −1.4 | $1,280 | |||
| New Democratic | Maurice Coulter | 2,104 | 6.0 | −3.4 | $8,831 | |||
| Green | Constantine Kritsonis | 532 | 1.5 | +0.5 | $2,401 | |||
| Communist | Christopher Black | 163 | 0.5 | – | $202 | |||
| Marxist–Leninist | Diane Johnston | 142 | 0.4 | 0 | $8 | |||
| Total valid votes | 34,882 | |||||||
| 1997 Canadian federal election | ||||||||
|---|---|---|---|---|---|---|---|---|
| Party | Candidate | Votes | % | ±% | ||||
| Liberal | Art Eggleton | 27,864 | 72.1 | +2.4 | ||||
| New Democratic | Mark Berardo | 3,618 | 9.4 | +5.4 | ||||
| Progressive Conservative | Anthony Figliano | 3,323 | 8.6 | +1.7 | ||||
| Reform | Anthony Chol | 2,876 | 7.4 | +1.9 | ||||
| Green | Constantine Kritsonis | 389 | 1.0 | +0.4 | ||||
| Natural Law | Mike Dubinsky | 242 | 0.6 | 0 | ||||
| Canadian Action | Jozef Izsak | 186 | 0.5 | – | ||||
| Marxist–Leninist | Diane Johnston | 168 | 0.4 | +0.2 | ||||
| Total valid votes | 38,666 | |||||||
| 1993 Canadian federal election | ||||||||
|---|---|---|---|---|---|---|---|---|
| Party | Candidate | Votes | % | ±% | ||||
| Liberal | Art Eggleton | 27,150 | 69.7 | +9.2 | ||||
| Independent | Peter Li Preti | 3,918 | 10.1 | – | ||||
| Progressive Conservative | George Tsiolis | 2,688 | 6.9 | −15.5 | ||||
| Reform | John Beck | 2,141 | 5.5 | – | ||||
| New Democratic | Israel Ellis | 1,557 | 4.0 | −11.4 | ||||
| National | Kurt Loeb | 734 | 1.9 | – | ||||
| Natural Law | Linda Dubé | 253 | 0.6 | – | ||||
| Green | Alan Jones | 216 | 0.6 | – | ||||
| Libertarian | Douglas Quinn | 174 | 0.4 | −1.3 | ||||
| Marxist–Leninist | Diane Johnston | 83 | 0.2 | – | ||||
| Abolitionist | Randy Armour | 60 | 0.2 | – | ||||
| Total valid votes | 38,974 | |||||||
| 1988 Canadian federal election | ||||||||
|---|---|---|---|---|---|---|---|---|
| Party | Candidate | Votes | % | ±% | ||||
| Liberal | Bob Kaplan | 24,962 | 60.5 | +9.3 | ||||
| Progressive Conservative | Rocco Sebastiano | 9,248 | 22.4 | −5.0 | ||||
| New Democratic | Cathy Mele | 6,350 | 15.4 | −4.4 | ||||
| Libertarian | David Kenny | 683 | 1.7 | +1.1 | ||||
| Total valid votes | 41,243 | |||||||
| 1984 Canadian federal election | ||||||||
|---|---|---|---|---|---|---|---|---|
| Party | Candidate | Votes | % | ±% | ||||
| Liberal | Bob Kaplan | 20,810 | 51.2 | -9.8 | ||||
| Progressive Conservative | Mike Cohen | 11,138 | 27.4 | +9.6 | ||||
| New Democratic | Van Newell | 8,037 | 19.8 | −0.5 | ||||
| Libertarian | Simon Srdarev | 244 | 0.6 | −0.1 | ||||
| Independent | Sol Roter | 226 | 0.6 | – | ||||
| Independent | Bonnie J. Geddes | 203 | 0.5 | – | ||||
| Total valid votes | 40,658 | |||||||
| 1980 Canadian federal election | ||||||||
|---|---|---|---|---|---|---|---|---|
| Party | Candidate | Votes | % | ±% | ||||
| Liberal | Bob Kaplan | 23,116 | 61.0 | +9.7 | ||||
| New Democratic | Cris Liscio | 7,696 | 20.3 | −5.4 | ||||
| Progressive Conservative | Anne Silverman | 6,736 | 17.8 | −4.0 | ||||
| Libertarian | Sheldon Gold | 284 | 0.7 | +0.1 | ||||
| Marxist–Leninist | Jeffery Forest | 86 | 0.2 | 0 | ||||
| Total valid votes | 37,918 | |||||||
| 1979 Canadian federal election | ||||||||
|---|---|---|---|---|---|---|---|---|
| Party | Candidate | Votes | % | ±% | ||||
| Liberal | Bob Kaplan | 20,859 | 51.3 | +0.6 | ||||
| New Democratic | Vince Del Buono | 10,464 | 25.7 | +2.2 | ||||
| Progressive Conservative | Bill Schiavono | 8,856 | 21.8 | −3.1 | ||||
| Libertarian | Shannon Vale | 229 | 0.6 | – | ||||
| Independent | Victor Heyn | 97 | 0.2 | – | ||||
| Marxist–Leninist | Jeffery Forest | 81 | 0.2 | 0 | ||||
| Communist | Gerrit van Houten | 63 | 0.2 | 0 | ||||
| Total valid votes | 40,649 | |||||||
| 1974 Canadian federal election | ||||||||
|---|---|---|---|---|---|---|---|---|
| Party | Candidate | Votes | % | ±% | ||||
| Liberal | Bob Kaplan | 32,402 | 50.7 | +8.8 | ||||
| Progressive Conservative | Barry Swadron | 15,877 | 24.9 | −4.9 | ||||
| New Democratic | Michael Copeland | 14,992 | 23.5 | −4.3 | ||||
| Independent | John J. de Niet | 191 | 0.3 | – | ||||
| Social Credit | Roger Drouin | 169 | 0.3 | – | ||||
| Marxist–Leninist | Rick Hundal | 129 | 0.2 | – | ||||
| Communist | Tom Morris | 123 | 0.2 | – | ||||
| Total valid votes | 63,883 | |||||||
| 1972 Canadian federal election | ||||||||
|---|---|---|---|---|---|---|---|---|
| Party | Candidate | Votes | % | ±% | ||||
| Liberal | James E. Walker | 26,912 | 41.9 | −14.7 | ||||
| Progressive Conservative | Barry Swadron | 19,097 | 29.8 | +17.5 | ||||
| New Democratic | Michael Copeland | 17,837 | 27.8 | -3.3 | ||||
| Independent | Harold Sparks | 189 | 0.3 | – | ||||
| Independent | George Paxton | 153 | 0.2 | – | ||||
| Total valid votes | 64,188 | |||||||
| 1968 Canadian federal election | ||||||||
|---|---|---|---|---|---|---|---|---|
| Party | Candidate | Votes | % | ±% | ||||
| Liberal | James E. Walker | 26,758 | 56.6 | +10.2 | ||||
| New Democratic | Douglas Fisher | 14,714 | 31.1 | −5.0 | ||||
| Progressive Conservative | Donald Stirling | 5,804 | 12.3 | −4.8 | ||||
| Total valid votes | 47,276 | |||||||
| 1965 Canadian federal election | ||||||||
|---|---|---|---|---|---|---|---|---|
| Party | Candidate | Votes | % | ±% | ||||
| Liberal | James E. Walker | 41,553 | 46.4 | −3.7 | ||||
| New Democratic | Val Scott | 32,352 | 36.1 | +1.7 | ||||
| Progressive Conservative | Fred C. Stinson | 15,301 | 17.1 | +1.6 | ||||
| Independent | Malcolm Cairnduff | 302 | 0.3 | – | ||||
| Total valid votes | 89,508 | |||||||
| 1963 Canadian federal election | ||||||||
|---|---|---|---|---|---|---|---|---|
| Party | Candidate | Votes | % | ±% | ||||
| Liberal | James E. Walker | 41,485 | 50.1 | +12.0 | ||||
| New Democratic | Val Scott | 28,505 | 34.4 | +0.1 | ||||
| Progressive Conservative | Bill Durovic | 12,807 | 15.5 | −11.2 | ||||
| Total valid votes | 82,797 | |||||||
| 1962 Canadian federal election | ||||||||
|---|---|---|---|---|---|---|---|---|
| Party | Candidate | Votes | % | ±% | ||||
| Liberal | James E. Walker | 30,432 | 38.1 | +5.1 | ||||
| New Democratic | Val Scott | 27,369 | 34.3 | +20.6 | ||||
| Progressive Conservative | Fred C. Stinson | 21,343 | 26.7 | −26.6 | ||||
| Social Credit | David H. Horwood | 746 | 0.9 | – | ||||
| Total valid votes | 79,890 | |||||||
| 1958 Canadian federal election | ||||||||
|---|---|---|---|---|---|---|---|---|
| Party | Candidate | Votes | % | ±% | ||||
| Progressive Conservative | Fred C. Stinson | 30,764 | 53.3 | +5.9 | ||||
| Liberal | Al Hollingworth | 19,065 | 33.0 | −1.4 | ||||
| Co-operative Commonwealth | Larry Sheffe | 7,888 | 13.7 | −2.9 | ||||
| Total valid votes | 57,717 | |||||||
| 1957 Canadian federal election | ||||||||
|---|---|---|---|---|---|---|---|---|
| Party | Candidate | Votes | % | ±% | ||||
| Progressive Conservative | Fred C. Stinson | 23,295 | 47.4 | +11.9 | ||||
| Liberal | Al Hollingworth | 16,925 | 34.4 | −9.7 | ||||
| Co-operative Commonwealth | Roy Begley | 8,164 | 16.6 | −2.3 | ||||
| Social Credit | Rod Gorrill | 777 | 1.6 | – | ||||
| Total valid votes | 49,161 | |||||||
| 1953 Canadian federal election | ||||||||
|---|---|---|---|---|---|---|---|---|
| Party | Candidate | Votes | % | ±% | ||||
| Liberal | Al Hollingworth | 13,903 | 44.1 | – | ||||
| Progressive Conservative | Roy Thomson | 11,180 | 35.5 | – | ||||
| Co-operative Commonwealth | William Newcombe | 5,960 | 18.9 | – | ||||
| Labor–Progressive | David Kashtan | 483 | 1.5 | – | ||||
| Total valid votes | 31,526 | |||||||
1904-1917
| 1911 Canadian federal election | ||||||||
|---|---|---|---|---|---|---|---|---|
| Party | Candidate | Votes | % | ±% | ||||
| Conservative | Thomas George Wallace | 2,838 | 54.9 | +4.5 | ||||
| Liberal | Herbert Hartly Dewart | 2,328 | 45.1 | -4.5 | ||||
| Total valid votes | 5,166 | 100.0 | ||||||
| 1908 Canadian federal election | ||||||||
|---|---|---|---|---|---|---|---|---|
| Party | Candidate | Votes | % | ±% | ||||
| Conservative | Thomas George Wallace | 2,614 | 50.4 | +0.7 | ||||
| Liberal | Peter Douglas McLean | 2,569 | 49.6 | -0.7 | ||||
| Total valid votes | 5,183 | 100.0 | ||||||
| Canadian federal by-election, 23 December 1907 | ||||||||
|---|---|---|---|---|---|---|---|---|
| Party | Candidate | Votes | % | ±% | ||||
| On Mr. Campbell being called to the Senate, 22 November 1907 | ||||||||
| Liberal | Peter Douglas McLean | 2,282 | 50.3 | -0.6 | ||||
| Conservative | T.G. Wallace | 2,256 | 49.7 | +0.6 | ||||
| Total valid votes | 4,538 | 100.0 | ||||||
| 1904 Canadian federal election | ||||||||
|---|---|---|---|---|---|---|---|---|
| Party | Candidate | Votes | % | |||||
| Liberal | Archibald Campbell | 2,222 | 50.9 | |||||
| Conservative | W.H. Pugsley | 2,146 | 49.1 | |||||
| Total valid votes | 4,368 | 100.0 | ||||||
References
- "(Code 35103) Census Profile". 2011 census. Statistics Canada. 2012. Retrieved 2011-03-03.
Notes
- Statistics Canada: 2011
- Statistics Canada: 2011
- Lim, Jolson (2020-08-04). "Toronto-area MP Michael Levitt to resign to head Jewish human rights organization". iPolitics. Retrieved 2020-09-02.
- "Byelections called for Toronto Centre, York Centre on Oct. 26". CBC News. September 18, 2020. Retrieved September 18, 2020.
- "Federal Liberals hold onto Toronto Centre, York Centre in byelections | CBC News". CBC. Retrieved 2020-10-27.
- https://www12.statcan.gc.ca/census-recensement/2016/dp-pd/prof/details/page.cfm?Lang=E&Geo1=FED&Code1=35118&Geo2=PR&Code2=35&SearchText=York%20Centre&SearchType=Begins&SearchPR=01&B1=All&TABID=1&type=0
- https://www12.statcan.gc.ca/nhs-enm/2011/dp-pd/prof/details/page.cfm?Lang=E&Geo1=FED2013&Code1=35118&Data=Count&SearchText=York%20Centre&SearchType=Begins&SearchPR=01&A1=All&B1=All&Custom=&TABID=1
- Elections Canada. "Official Voting Results". Retrieved October 27, 2020.
- "List of confirmed candidates". Elections Canada. Retrieved October 4, 2019.
- "Official Voting Results". Elections Canada. Retrieved September 18, 2020.
- Elections Canada – Confirmed candidates for York Centre, 30 September 2015
- "Elections Canada – Preliminary Election Expenses Limits for Candidates". Archived from the original on 2015-08-15. Retrieved 2018-12-27.
- "Official Voting Results". Elections Canada. Retrieved September 18, 2020.
- Pundits' Guide to Canadian Elections
External links
- Riding history 1903-1914 from the Library of Parliament
- Riding history 1952-2008 from the Library of Parliament
- Elections Canada profile
- Statistics Canada profile
- Campaign expense data from Elections Canada
| North: Thornhill | ||
| West: York West | York Centre | East: Willowdale |
| South: Eglinton—Lawrence, York South—Weston |