King—Vaughan
King—Vaughan is a federal electoral district in Ontario, Canada.
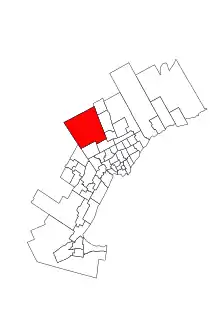 King—Vaughan in relation to other Greater Toronto Area districts | |||
| Federal electoral district | |||
| Legislature | House of Commons | ||
| MP |
Liberal | ||
| District created | 2013 | ||
| First contested | 2015 | ||
| District webpage | profile, map | ||
| Demographics | |||
| Population (2016)[1] | 131,995 | ||
| Electors (2015) | 83,550 | ||
| Area (km²)[1] | 426.39 | ||
| Pop. density (per km²) | 309.6 | ||
| Census division(s) | York | ||
| Census subdivision(s) | King, Vaughan | ||
King—Vaughan was created by the 2012 federal electoral boundaries redistribution and was legally defined in the 2013 representation order. It came into effect upon the dropping of the writs for the 2015 federal election.[2] It was created out of parts of the ridings of Oak Ridges—Markham and Vaughan.[3]
Geography
The riding consists of:
- the part of the Township of King lying south of Highway 9 and Davis Drive West; and the part of the City of Vaughan lying north and east of a line commencing at the intersection of the western city limit with Major Mackenzie Drive; then easterly along Major Mackenzie then east along said drive to Humber Bridge Trail, on and from which it runs east to and on Old Major Mackenzie Drive to Major Mackenzie Drive; then east along Major Mackenzie to Highway 400; then south on Highway 400 to Rutherford Road; then easterly along Rutherford road to the eastern city limit.[3]
Demographics
- According to the Canada 2011 Census; 2013 representation[4][5]
Ethnic groups: 66.7% White, 10.9% South Asian, 4.0% Chinese, 3.5% Black, 2.9% Southeast Asian, 2.7% Filipino, 2.7% Latin American, 2.4% West Asian
Languages: 54.3% English, 12.3% Italian, 4.2% Russian, 3.3% Chinese, 2.9% Urdu, 2.7% Spanish, 1.7% Portuguese, 1.7% Farsi, 1.5% Tamil, 1.4% Vietnamese, 1.3% Tagalog, 1.2% Punjabi, 1.0% Arabic
Religions: 68.6% Christian (49.0% Catholic, 4.6% Christian Orthodox, 2.7% United Church, 1.7% Pentecostal, 1.7% Anglican, 1.3% Presbyterian, 7.6% Other), 6.9% Muslim, 4.8% Hindu, 4.5% Jewish, 2.5% Buddhist, 1.1% Sikh, 11.3% No religion
Median income (2010): $34,451
Average income (2010): $50,519
Riding associations
Riding associations are the local branches of the national political parties:
| Party | Association Name | CEO | HQ City | |
| Liberal Party of Canada | King-Vaughan Federal Liberal Association | Frank Ye | Vaughan | |
| New Democratic Party | King-Vaughan Federal NDP | Shannon Cruickshank | Stratford, Ontario | |
| Green Party of Canada | King-Vaughan Federal Green Party Association | Ann E. Raney | King City, Ontario | |
| Conservative Party of Canada | King-Vaughan Conservative Association | Michael Guglielmin | Toronto | |
| People's Party of Canada | King-Vaughan - PPC Association | Anton Strgacic | King City, Ontario | |
Members of Parliament
This riding has elected the following Members of Parliament:
| Parliament | Years | Member | Party | |
|---|---|---|---|---|
| King—Vaughan Riding created from Oak Ridges—Markham and Vaughan |
||||
| 42nd | 2015–2019 | Deb Schulte | Liberal | |
| 43rd | 2019–present | |||
Election results
| 2019 Canadian federal election | ||||||||
|---|---|---|---|---|---|---|---|---|
| Party | Candidate | Votes | % | ±% | Expenditures | |||
| Liberal | Deb Schulte | 28,725 | 45.00 | -2.38 | $95,558.89 | |||
| Conservative | Anna Roberts | 27,584 | 43.20 | -1.00 | $61,976.67 | |||
| New Democratic | Emilio Bernardo-Ciddio | 4,297 | 6.70 | +0.17 | none listed | |||
| Green | Ann Raney | 2,511 | 3.90 | +2.00 | $16,180.64 | |||
| People's | Anton Strgacic | 731 | 1.10 | +1.10 | $1,568.81 | |||
| Total valid votes/Expense limit | 63,848 | 100.0 | ||||||
| Total rejected ballots | 598 | 0.93 | ||||||
| Turnout | 64,446 | 64.94 | ||||||
| Eligible voters | 99,246 | |||||||
| Liberal hold | Swing | -1.38 | ||||||
| Source: Elections Canada[6] | ||||||||
| 2015 Canadian federal election | ||||||||
|---|---|---|---|---|---|---|---|---|
| Party | Candidate | Votes | % | ±% | Expenditures | |||
| Liberal | Deb Schulte | 25,908 | 47.38 | +19.87 | $90,592.57 | |||
| Conservative | Konstantin Toubis | 24,170 | 44.20 | -12.92 | $144,224.44 | |||
| New Democratic | Natalie Rizzo | 3,571 | 6.53 | -5.78 | $6,632.62 | |||
| Green | Ann Raney | 1,037 | 1.90 | -0.84 | $9,983.35 | |||
| Total valid votes/Expense limit | 54,686 | 100.00 | $222,565.07 | |||||
| Total rejected ballots | 290 | 0.53 | – | |||||
| Turnout | 54,976 | 64.73 | – | |||||
| Eligible voters | 84,925 | |||||||
| Liberal gain from Conservative | Swing | +16.40 | ||||||
| Source: Elections Canada[7][8] | ||||||||
| 2011 federal election redistributed results[9] | |||
|---|---|---|---|
| Party | Vote | % | |
| Conservative | 22,172 | 57.12 | |
| Liberal | 10,676 | 27.50 | |
| New Democratic | 4,778 | 12.31 | |
| Green | 1,063 | 2.74 | |
| Progressive Canadian | 127 | 0.33 | |
References
- "Census Profile, 2016 Census Aurora—Oak Ridges—Richmond Hill". Statistics Canada. 2016. Retrieved 4 December 2018.
- Timeline for the Redistribution of Federal Electoral Districts
- Final Report – Ontario
- http://www12.statcan.gc.ca/nhs-enm/2011/dp-pd/prof/details/page.cfm?Lang=E&Geo1=FED2013&Code1=35043&Data=Count&SearchText=King&SearchType=Begins&SearchPR=01&A1=All&B1=All&Custom=&TABID=1
- http://www12.statcan.gc.ca/nhs-enm/2011/dp-pd/prof/details/page.cfm?Lang=E&Geo1=FED2013&Code1=35043&Data=Count&SearchText=King&SearchType=Begins&SearchPR=01&A1=All&B1=All&Custom=&TABID=1#tabs2
- "Election Night Results". Elections Canada. Retrieved November 22, 2019.
- Elections Canada – Confirmed candidates for King—Vaughan, 30 September 2015
- Elections Canada – Preliminary Election Expenses Limits for Candidates Archived 2015-08-15 at the Wayback Machine
- Pundits' Guide to Canadian Elections
