Algoma—Manitoulin—Kapuskasing
Algoma—Manitoulin—Kapuskasing is a federal electoral district in Ontario, Canada, that has been represented in the House of Commons of Canada since 2004. The area was represented by the riding of Algoma from 1867 to 1904 and from 1968 to 1996 and then by Algoma—Manitoulin from 1996 to 2004.
 | |||
| Coordinates: | 46°23′10″N 82°38′54″W Location of the federal constituency office (as of 7 May 2016) | ||
| Federal electoral district | |||
| Legislature | House of Commons | ||
| MP |
New Democratic | ||
| District created | 2003 | ||
| First contested | 2004 | ||
| Last contested | 2019 | ||
| District webpage | profile, map | ||
| Demographics | |||
| Population (2016)[1] | 79,483 | ||
| Electors (2015) | 62,230 | ||
| Area (km²)[2] | 93,436.34 | ||
| Pop. density (per km²) | 0.85 | ||
| Census division(s) | Algoma District, Cochrane District, Manitoulin District, Sudbury District | ||
| Census subdivision(s) | Blind River, Chapleau, Elliot Lake, Espanola, Hearst, Kapuskasing, Manitouwadge, Northeastern Manitoulin and the Islands, Sables-Spanish Rivers, Wawa | ||
Demographics
- Ethnic groups: 84.3% White, 14.6% Native Canadian
- Languages: 60.1% English, 32.1% French, 6.1% Other, 1.7% Multiple responses
- Religions: 58.5% Catholic, 26.6% Protestant, 1.6% Other Christian, 10.2% No affiliation
- Average income: $25,976
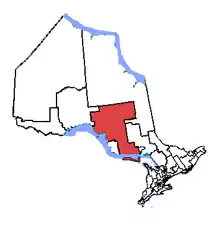
Geography
The district includes the eastern, northern and central parts of Algoma District, the extreme northwestern part and extreme southwestern part of Sudbury District, the extreme southeastern part of Thunder Bay District, all of Manitoulin District, and western Cochrane District along the Trans Canada highway. Large communities include Elliot Lake, Kapuskasing, Hearst, Espanola, Wawa, Manitouwadge, Blind River, Sables-Spanish Rivers, Chapleau, and Northeastern Manitoulin and the Islands. The area is 103,364 km2.
History
The electoral district was created in 2003. 71.7% of the population of the riding came from Algoma—Manitoulin, and 28.3% from Timmins—James Bay.
Algoma was created in the British North America Act and consisted of the Provisional Judicial District of Algoma District. In 1882, the district consisted of the area between the Provisional Thunder Bay District and the Province of Manitoba. In 1892, it consisted of all areas of Ontario west of the Nipissing electoral district, and also included Manitoulin Island and the islands around it. The district was abolished in 1903 when it was redistributed into Algoma East and Algoma West ridings.
A new Algoma district was created from Algoma East and Algoma West in 1966. It consisted of most of Algoma District except the extreme north and northwestern portions, and Sault Ste. Marie. It also included Manitoulin Island, nearby islands, and the southwestern corner of Sudbury. In 1976, the district was expanded to the north, and to include the suburbs of Sault Ste. Marie, Whitefish River Indian Reserve, and more of the southwestern part of Sudbury District.
In 1987, it was expanded to include part of the city of Sault Ste. Marie, the part of Rankin Indian Reserve within city limits, more of western Sudbury District, all of Manitoulin District, and much of southcentral Sudbury District. There were also some boundary changes in the north part of the Algoma district.
In 1996, the district consisted of all of Algoma District except Sault Ste. Marie, the northwestern corner and the southwestern corner of Sudbury District, Manitoulin District, and the southeastern corner of Thunder Bay District.
In 1997, the name of the district was changed to Algoma—Manitoulin.
Most of the riding was redistributed in 2003 into Algoma—Manitoulin—Kapuskasing, with small parts going to Nickel Belt and Sault Ste. Marie ridings.
This riding gained territory from Sault Ste. Marie and Nickel Belt during the 2012 electoral redistribution.
Members of Parliament
This riding has elected the following Members of Parliament:
| Parliament | Years | Member | Party | |
|---|---|---|---|---|
| Algoma | ||||
| 1st | 1867–1871 | Wemyss Mackenzie Simpson | Conservative | |
| 1871–1872 | Frederick William Cumberland | |||
| 2nd | 1872–1874 | John Beverley Robinson | ||
| 3rd | 1874–1878 | Edward Borron | Liberal | |
| 4th | 1878–1882 | Simon James Dawson | Conservative | |
| 5th | 1882–1887 | |||
| 6th | 1887–1891 | |||
| 7th | 1891–1896 | George Hugh Macdonell | ||
| 8th | 1896–1900 | Albert Dyment | Liberal | |
| 9th | 1900–1904 | |||
| Riding dissolved into Algoma East and Algoma West | ||||
| Algoma Riding re-created from Algoma East and Algoma West |
||||
| 28th | 1968–1972 | Maurice Foster | Liberal | |
| 29th | 1972–1974 | |||
| 30th | 1974–1979 | |||
| 31st | 1979–1980 | |||
| 32nd | 1980–1984 | |||
| 33rd | 1984–1988 | |||
| 34th | 1988–1993 | |||
| 35th | 1993–1997 | Brent St. Denis | ||
| Algoma—Manitoulin | ||||
| 36th | 1997–2000 | Brent St. Denis | Liberal | |
| 37th | 2000–2004 | |||
| Algoma—Manitoulin—Kapuskasing | ||||
| 38th | 2004–2006 | Brent St. Denis | Liberal | |
| 39th | 2006–2008 | |||
| 40th | 2008–2011 | Carol Hughes | New Democratic | |
| 41st | 2011–2015 | |||
| 42nd | 2015–2019 | |||
| 43rd | 2019–present | |||
Election results
Algoma—Manitoulin—Kapuskasing (2004–present)
| 2019 Canadian federal election | ||||||||
|---|---|---|---|---|---|---|---|---|
| Party | Candidate | Votes | % | ±% | Expenditures | |||
| New Democratic | Carol Hughes | 16,883 | 41.6 | +1.71 | $105,479.79 | |||
| Conservative | Dave Williamson | 10,625 | 26.2 | +2.52 | $58,396.49 | |||
| Liberal | Heather Wilson | 9,879 | 24.3 | -9.74 | $61,853.69 | |||
| Green | Max Chapman | 2,192 | 5.4 | +3.09 | none listed | |||
| People's | Dave Delisle | 887 | 2.2 | new | none listed | |||
| Rhinoceros | Le Marquis de Marmalade | 123 | 0.3 | - | $0.00 | |||
| Total valid votes/Expense limit | 40,591 | 100.0 | ||||||
| Total rejected ballots | 384 | |||||||
| Turnout | 40,975 | 62.6 | ||||||
| Eligible voters | 65,420 | |||||||
| New Democratic hold | Swing | -0.41 | ||||||
| Source: Elections Canada[3][4] | ||||||||
| 2015 Canadian federal election | ||||||||
|---|---|---|---|---|---|---|---|---|
| Party | Candidate | Votes | % | ±% | Expenditures | |||
| New Democratic | Carol Hughes | 16,516 | 39.92 | −10.01 | $79,801.31 | |||
| Liberal | Heather Wilson | 14,111 | 34.11 | +19.66 | $36,962.72 | |||
| Conservative | André Robichaud | 9,820 | 23.73 | −8.77 | $54,344.43 | |||
| Green | Calvin John Orok | 927 | 2.24 | −0.84 | – | |||
| Total valid votes/Expense limit | 41,374 | 100.00 | $247,218.89 | |||||
| Total rejected ballots | 161 | 0.39 | – | |||||
| Turnout | 41,535 | 66.32 | ||||||
| Eligible voters | 62,625 | |||||||
| New Democratic hold | Swing | -14.84 | ||||||
| Source: Elections Canada[5][6][7] | ||||||||
| 2011 federal election redistributed results[8] | |||
|---|---|---|---|
| Party | Vote | % | |
| New Democratic | 19,561 | 49.93 | |
| Conservative | 12,734 | 32.51 | |
| Liberal | 5,660 | 14.45 | |
| Green | 1,208 | 3.08 | |
| Others | 11 | 0.03 | |
| 2011 Canadian federal election | ||||||||
|---|---|---|---|---|---|---|---|---|
| Party | Candidate | Votes | % | ±% | Expenditures | |||
| New Democratic | Carol Hughes | 18,747 | 51.73 | +6.24 | – | |||
| Conservative | Ray Sturgeon | 10,943 | 30.19 | +12.55 | – | |||
| Liberal | François Cloutier | 5,375 | 14.83 | -17.70 | – | |||
| Green | Lorraine Rekmans | 1,212 | 3.34 | -0.98 | – | |||
| Total valid votes/Expense limit | 36,242 | 100.00 | ||||||
| Total rejected ballots | 179 | 0.49 | ||||||
| Turnout | 36,421 | 62.76 | ||||||
| New Democratic Party hold | Swing | -3.2 | ||||||
| 2008 Canadian federal election | ||||||||
|---|---|---|---|---|---|---|---|---|
| Party | Candidate | Votes | % | ±% | Expenditures | |||
| New Democratic | Carol Hughes | 15,249 | 45.49 | +10.98 | $91,893 | |||
| Liberal | Brent St. Denis | 10,902 | 32.53 | -5.65 | $90,379 | |||
| Conservative | Dianne Musgrove | 5,914 | 17.64 | -5.70 | $8,989 | |||
| Green | Lorraine Rekmans | 1,451 | 4.32 | +1.65 | $5,448 | |||
| Total valid votes/Expense limit | 33,516 | 100.00 | $97,228 | |||||
| Total rejected ballots | 175 | 0.52 | ||||||
| Turnout | 33,691 | 56.53 | ||||||
| New Democratic Party gain from Liberal | Swing | +8.3 | ||||||
* Preliminary results
| 2006 Canadian federal election | ||||||||
|---|---|---|---|---|---|---|---|---|
| Party | Candidate | Votes | % | ±% | Expenditures | |||
| Liberal | Brent St. Denis | 14,652 | 38.18 | −2.76 | $52,836 | |||
| New Democratic | Carol Hughes | 13,244 | 34.51 | +2.82 | $51,642 | |||
| Conservative | Ian West | 8,957 | 23.34 | +0.13 | $65,745 | |||
| Green | Stan Hutchinson | 1,025 | 2.67 | −1.40 | $647 | |||
| First Peoples National | Will Morin | 338 | 0.88 | – | $829 | |||
| Independent | Donald Polmateer | 164 | 0.43 | – | none listed | |||
| Total valid votes | 38,380 | 100.00 | ||||||
| Total rejected ballots | 216 | 0.56 | ||||||
| Turnout | 38,596 | 63.99 | ||||||
| Electors on the lists | 60,311 | |||||||
| Sources: Official Results, Elections Canada and Financial Returns, Elections Canada. | ||||||||
| 2004 Canadian federal election | ||||||||
|---|---|---|---|---|---|---|---|---|
| Party | Candidate | Votes | % | |||||
| Liberal | Brent St. Denis | 14,276 | 40.94 | |||||
| New Democratic | Carol Hughes | 11,051 | 31.69 | |||||
| Conservative | Blaine Armstrong | 8,093 | 23.21 | |||||
| Green | Lindsay Killen | 1,449 | 4.16 | |||||
| Total | 34,869 | 100.00 | ||||||
Algoma—Manitoulin (1997–2004)
| 2000 Canadian federal election | ||||||||
|---|---|---|---|---|---|---|---|---|
| Party | Candidate | Votes | % | |||||
| Liberal | Brent St. Denis | 15,000 | 48.36 | |||||
| Alliance | Ron Swain | 8,992 | 28.99 | |||||
| New Democratic | Grant Buck | 4,326 | 13.95 | |||||
| Progressive Conservative | Dale Lapham | 2,269 | 7.32 | |||||
| Green | Alexander Jablanczy | 428 | 1.38 | |||||
| 1997 Canadian federal election | ||||||||
|---|---|---|---|---|---|---|---|---|
| Party | Candidate | Votes | % | |||||
| Liberal | Brent St. Denis | 13,810 | 41.31 | |||||
| Reform | Jim Jeffery | 8,353 | 24.99 | |||||
| New Democratic | Jody Wildman | 7,897 | 23.62 | |||||
| Progressive Conservative | Roseanne MacDonald | 3,367 | 10.07 | |||||
Algoma (1968–1997)
| 1993 Canadian federal election | ||||||||
|---|---|---|---|---|---|---|---|---|
| Party | Candidate | Votes | % | |||||
| Liberal | Brent St. Denis | 18,218 | 58.05 | |||||
| Reform | Ken Leffler | 6,623 | 21.10 | |||||
| Progressive Conservative | David Mair | 3,613 | 11.51 | |||||
| New Democratic | Gayle Erma Broad | 2,696 | 8.59 | |||||
| Natural Law | Bernard Brégaint | 235 | 0.75 | |||||
| 1988 Canadian federal election | ||||||||
|---|---|---|---|---|---|---|---|---|
| Party | Candidate | Votes | % | |||||
| Liberal | Maurice Foster | 16,766 | 53.24 | |||||
| Progressive Conservative | Jim Reed | 7,383 | 23.45 | |||||
| New Democratic | Lloyd Greenspoon | 7,341 | 23.31 | |||||
| 1984 Canadian federal election | ||||||||
|---|---|---|---|---|---|---|---|---|
| Party | Candidate | Votes | % | |||||
| Liberal | Maurice Foster | 14,113 | 38.26 | |||||
| Progressive Conservative | Jim Reed | 12,811 | 34.73 | |||||
| New Democratic | Rocco Frangione | 9,499 | 25.75 | |||||
| Not affiliated | Harold Bruzas | 462 | 1.25 | |||||
| 1980 Canadian federal election | ||||||||
|---|---|---|---|---|---|---|---|---|
| Party | Candidate | Votes | % | |||||
| Liberal | Maurice Foster | 17,432 | 50.54 | |||||
| New Democratic | Jim Dinner | 11,262 | 32.65 | |||||
| Progressive Conservative | Bernt Gilbertson | 5,633 | 16.33 | |||||
| Libertarian | Leslie T. Reid | 113 | 0.33 | |||||
| Marxist–Leninist | David Grey | 49 | 0.14 | |||||
| 1979 Canadian federal election | ||||||||
|---|---|---|---|---|---|---|---|---|
| Party | Candidate | Votes | % | |||||
| Liberal | Maurice Foster | 15,277 | 45.04 | |||||
| New Democratic | Jim Dinner | 10,989 | 32.40 | |||||
| Progressive Conservative | Fred Sagle | 7,531 | 22.20 | |||||
| Marxist–Leninist | Wayne Derrah | 121 | 0.36 | |||||
| 1974 Canadian federal election | ||||||||
|---|---|---|---|---|---|---|---|---|
| Party | Candidate | Votes | % | |||||
| Liberal | Maurice Foster | 11,360 | 52.02 | |||||
| New Democratic | Hughene MacDonald | 5,240 | 24.00 | |||||
| Progressive Conservative | Ron Ritchie | 5,136 | 23.52 | |||||
| Independent | Fernand Trottier | 100 | 0.46 | |||||
| 1972 Canadian federal election | ||||||||
|---|---|---|---|---|---|---|---|---|
| Party | Candidate | Votes | % | |||||
| Liberal | Maurice Foster | 10,160 | 45.89 | |||||
| Progressive Conservative | Dale Burley | 6,721 | 30.36 | |||||
| New Democratic | Kelly Sweeney | 4,599 | 20.77 | |||||
| Social Credit | Nil F. Cote | 508 | 2.29 | |||||
| Independent | George Washington Strain | 150 | 0.68 | |||||
| 1968 Canadian federal election | ||||||||
|---|---|---|---|---|---|---|---|---|
| Party | Candidate | Votes | % | |||||
| Liberal | Maurice Foster | 9,542 | 50.57 | |||||
| Progressive Conservative | John D. McPhail | 5,270 | 27.93 | |||||
| New Democratic | Len Lefebvre | 4,057 | 21.50 | |||||
Algoma (1867–1904)
| 1900 Canadian federal election | ||||||||
|---|---|---|---|---|---|---|---|---|
| Party | Candidate | Votes | % | |||||
| Liberal | Albert Edward Dyment | 3,083 | 53.09 | |||||
| Conservative | A. C. Boyce | 2,724 | 46.91 | |||||
| 1896 Canadian federal election | ||||||||
|---|---|---|---|---|---|---|---|---|
| Party | Candidate | Votes | % | |||||
| Liberal | Albert Edward Dyment | 3,176 | 70.19 | |||||
| Conservative | George H. MacDonell | 1,349 | 29.81 | |||||
| 1891 Canadian federal election | ||||||||
|---|---|---|---|---|---|---|---|---|
| Party | Candidate | Votes | % | |||||
| Conservative | George H. MacDonell | 2,251 | 55.39 | |||||
| Unknown | Daniel F. Burk | 1,813 | 44.61 | |||||
| 1887 Canadian federal election | ||||||||
|---|---|---|---|---|---|---|---|---|
| Party | Candidate | Votes | % | |||||
| Conservative | Simon James Dawson | 1,428 | 50.32 | |||||
| Unknown | Daniel F. Burk | 1,410 | 49.68 | |||||
| 1882 Canadian federal election | ||||||||
|---|---|---|---|---|---|---|---|---|
| Party | Candidate | Votes | % | |||||
| Conservative | Simon James Dawson | 1,707 | 60.55 | |||||
| Liberal | William McDougall | 1,112 | 39.45 | |||||
| 1878 Canadian federal election | ||||||||
|---|---|---|---|---|---|---|---|---|
| Party | Candidate | Votes | % | |||||
| Conservative | Simon James Dawson | 885 | 64.84 | |||||
| Unknown | Mr. Rankin | 480 | 35.16 | |||||
| 1874 Canadian federal election | ||||||||
|---|---|---|---|---|---|---|---|---|
| Party | Candidate | Votes | % | |||||
| Liberal | Edward Borron | 436 | 61.24 | |||||
| Unknown | W. J. Scott | 258 | 36.24 | |||||
| Unknown | P. J. Brown | 18 | 2.53 | |||||
| 1872 Canadian federal election | ||||||||
|---|---|---|---|---|---|---|---|---|
| Party | Candidate | Votes | % | |||||
| Conservative | John Beverly Robinson | 300 | 57.80 | |||||
| Unknown | G. J. Denison, Jr. | 219 | 42.20 | |||||
On Mr. Simpson's resignation to become Indian Commissioner for the North:
| By-election on 30 June 1871 | |||||
| Party | Candidate | Votes | |||
|---|---|---|---|---|---|
| Conservative | Frederick William Cumberland | acclaimed | |||
| 1867 Canadian federal election | ||||||||
|---|---|---|---|---|---|---|---|---|
| Party | Candidate | Votes | % | |||||
| Conservative | Wemyss Mackenzie Simpson | 250 | 47.26 | |||||
| Unknown | William Beatty | 241 | 45.56 | |||||
| Unknown | Mr. MacDonell | 38 | 7.18 | |||||
References
- "(Code 35002) Census Profile". 2011 census. Statistics Canada. 2012. Retrieved 2012-03-01.
Notes
- Statistics Canada: 2017
- Statistics Canada: 2017
- "List of confirmed candidates". Elections Canada. Retrieved October 4, 2019.
- "Election Night Results". Elections Canada. Retrieved October 30, 2019.
- Elections Canada – Confirmed candidates for Algoma—Manitoulin—Kapuskasing, 30 September 2015
- Elections Canada – Preliminary Election Expenses Limits for Candidates Archived 2016-03-04 at the Wayback Machine
- "Election Night Results". Elections Canada. Retrieved 22 October 2015.
- Pundits' Guide to Canadian Elections
External links
- Riding history for Algoma 1867-1904 from the Library of Parliament
- Riding history for Algoma 1968-1993 from the Library of Parliament
- Riding history for Algoma—Manitoulin 1997-2004 from the Library of Parliament
- Riding history from the Library of Parliament
- 2011 results from Elections Canada
- Expenditures - 2008
.png.webp)