Waterloo (electoral district)
Waterloo is the name of a federal electoral district in the Waterloo Region of Ontario, Canada, that has been used in the House of Commons of Canada from since 1968 (from 1973 to 1976, it was known as Waterloo—Cambridge). Between 1997 and 2015, the riding was known as Kitchener—Waterloo.[2]
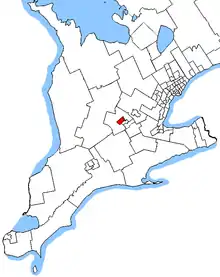 Waterloo in relation to southern Ontario ridings (2013 boundaries) | |||
| Coordinates: | 43.48°N 80.52°W | ||
| Federal electoral district | |||
| Legislature | House of Commons | ||
| MP |
Liberal | ||
| District created | 1966 | ||
| First contested | 1968 | ||
| Last contested | 2019 | ||
| District webpage | profile, map | ||
| Demographics | |||
| Population (2016)[1] | 110,134 | ||
| Electors (2015) | 77,312 | ||
| Area (km²)[1] | 78 | ||
| Pop. density (per km²) | 1,412 | ||
| Census division(s) | Waterloo | ||
| Census subdivision(s) | Waterloo, Kitchener | ||
Geography
The Waterloo electoral district contains all of the city of Waterloo plus the Bridgeport neighbourhood of Kitchener.
History
1966–1973
The Waterloo electoral district was created in 1966 from parts of Waterloo North and Waterloo South electoral districts. It initially comprised large sections of the Waterloo County (later Region) outside of the City of Kitchener, in particular in included, the City of Galt (now part of Cambridge), the City of Waterloo and the Townships of North Dumfries and Waterloo.[3]
1973–1976
After the amalgamation of the City of Galt with the Towns of Preston and Hespeler into the City of Cambridge in 1973, the name of the electoral district was changed to Waterloo—Cambridge. The boundaries of the district were not changed to actually add the Preston and Hespeler asections of Cambridge into the riding.[4]
1976–1996
In 1976, Waterloo—Cambridge was abolished when it was redistributed among Cambridge, Kitchener, and a new Waterloo electoral district.
The new Waterloo electoral district was created from parts of the Kitchener, Perth—Wilmot, Waterloo—Cambridge, and Wellington—Grey—Dufferin—Waterloo electoral districts. It comprised the Townships of Wellesley, Wilmot and Woolwich, the City of Waterloo, and parts of the City of Kitchener.[5]
In 1987, the Waterloo electoral district was redefined to comprise the City of Waterloo, the northern part of the City of Kitchener, and the Township of Woolwich. The Townships of Wellesley and Wilmot were redistributed to the Perth—Wellington—Waterloo district.[6]
The Waterloo electoral district was renamed to Kitchener—Waterloo[7] and part of it was split into Waterloo—Wellington.[8] The new district consisted initially of the City of Waterloo and the part of the City of Kitchener lying north of a line drawn from west to east along Highland Road West, Lawrence Avenue and Victoria Street.
1997-present
In 2003, the Kitchener part of the riding was redefined to be the part of the city lying north of a line drawn from west to east along Highland Road West, Fischer Hallman Road and the Canadian National Railway situated north of Shadeland Crescent.[7]
Following the 2011 Census and a Canadian Parliament decision to increase the number of Federal electoral districts from 308 to 338, Elections Canada conducted a redistribution process that began with the establishment of Electoral Boundaries Commissions for each province in 2012. As a result of the work of the Electoral Boundaries Commission for the Province of Ontario, which was concluded in July 2013, a revived Waterloo was created out of 80% of the old Kitchener—Waterloo. The rest of the Kitchener-Waterloo riding was split between Kitchener Centre and Kitchener-Conestoga[2][9] The revived riding comprised virtually all of the western portion of the old Kitchener—Waterloo, including all of Waterloo and a sliver of Kitchener lying north of the Canadian National Railway and northeast of Conestoga Parkway.
Members of Parliament
This riding has elected the following members of the House of Commons of Canada:
| Parliament | Years | Member | Party | |
|---|---|---|---|---|
| Waterloo Riding created from Waterloo North and Waterloo South |
||||
| 28th | 1968–1972 | Max Saltsman | New Democratic | |
| 29th | 1972–1974 | |||
| Waterloo—Cambridge | ||||
| 30th | 1974–1979 | Max Saltsman | New Democratic | |
| Waterloo | ||||
| 31st | 1979–1980 | Walter McLean | Progressive Conservative | |
| 32nd | 1980–1984 | |||
| 33rd | 1984–1988 | |||
| 34th | 1988–1993 | |||
| 35th | 1993–1997 | Andrew Telegdi | Liberal | |
| Kitchener—Waterloo | ||||
| 36th | 1997–2000 | Andrew Telegdi | Liberal | |
| 37th | 2000–2004 | |||
| 38th | 2004–2006 | |||
| 39th | 2006–2008 | |||
| 40th | 2008–2011 | Peter Braid | Conservative | |
| 41st | 2011–2015 | |||
| Waterloo | ||||
| 42nd | 2015–2019 | Bardish Chagger | Liberal | |
| 43rd | 2019–present | |||
Electoral history
Waterloo, 2015–present
| 2019 Canadian federal election | ||||||||
|---|---|---|---|---|---|---|---|---|
| Party | Candidate | Votes | % | ±% | Expenditures | |||
| Liberal | Bardish Chagger | 31,085 | 48.8 | -0.9 | $107,088.00 | |||
| Conservative | Jerry Zhang | 15,615 | 24.5 | -7.8 | $84,796.68 | |||
| New Democratic | Lori Campbell | 9,710 | 15.2 | +0.3 | none listed | |||
| Green | Kirsten Wright | 6,184 | 9.7 | +6.8 | none listed | |||
| People's | Erika Traub | 1,112 | 1.7 | – | $5,385.50 | |||
| Total valid votes/Expense limit | 63,706 | 100.0 | – | 112,180.38 | ||||
| Total rejected ballots | 417 | 0.65 | +0.33 | |||||
| Turnout | 64,123 | 74.76 | -2.9 | |||||
| Eligible voters | 85,761 | |||||||
| Source: Elections Canada,[10] Global News[11] | ||||||||
| 2015 Canadian federal election | ||||||||
|---|---|---|---|---|---|---|---|---|
| Party | Candidate | Votes | % | ±% | Expenditures | |||
| Liberal | Bardish Chagger | 29,752 | 49.7 | +11.38 | $140,131.74 | |||
| Conservative | Peter Braid | 19,318 | 32.3 | -9.08 | $148,370.13 | |||
| New Democratic | Diane Freeman | 8,928 | 14.9 | -0.04 | $96,964.67 | |||
| Green | Richard Walsh | 1,713 | 2.9 | -1.78 | – | |||
| Animal Alliance | Emma Hawley-Yan | 138 | 0.2 | – | $4,066.17 | |||
| Total valid votes/Expense limit | 59,849 | 100.0 | – | $212,120.63 | ||||
| Total rejected ballots | 198 | 0.32 | – | |||||
| Turnout | 60,047 | 77.66 | – | |||||
| Eligible voters | 77,312 | |||||||
| Source: Elections Canada[12][13] | ||||||||
| 2011 federal election redistributed results[14] | |||
|---|---|---|---|
| Party | Vote | % | |
| Conservative | 22,193 | 41.38 | |
| Liberal | 20,551 | 38.32 | |
| New Democratic | 8,014 | 14.94 | |
| Green | 2,508 | 4.68 | |
| Others | 366 | 0.68 | |
Kitchener—Waterloo, 1997-2011
| 2011 Canadian federal election: Kitchener—Waterloo | ||||||||
|---|---|---|---|---|---|---|---|---|
| Party | Candidate | Votes | % | ±% | Expenditures | |||
| Conservative | Peter Braid | 27,039 | 40.85 | +4.79 | $90,641.15 | |||
| Liberal | Andrew Telegdi | 24,895 | 37.62 | +1.59 | – | |||
| New Democratic | Bill Brown | 10,606 | 16.03 | +1.31 | $21,334.44 | |||
| Green | Cathy MacLellan | 3,158 | 4.77 | -7.33 | – | |||
| Pirate | Steven Bradley Scott | 245 | 0.37 | – | – | |||
| Independent | Richard Walsh-Bowers | 174 | 0.26 | – | – | |||
| Marxist–Leninist | Julian Ichim | 66 | 0.10 | – | none listed | |||
| Total valid votes | 66,183 | 100.00 | – | |||||
| Total rejected ballots | 216 | 0.33 | -0.05 | |||||
| Turnout | 66,399 | 70.17 | +7.86 | |||||
| Eligible voters | 94,624 | – | – | |||||
| 2008 Canadian federal election: Kitchener—Waterloo | ||||||||
|---|---|---|---|---|---|---|---|---|
| Party | Candidate | Votes | % | ±% | Expenditures | |||
| Conservative | Peter Braid | 21,830 | 36.06 | +7.75 | $93,455 | |||
| Liberal | Andrew Telegdi | 21,813 | 36.03 | -10.82 | $71,443 | |||
| New Democratic | Cindy Jacobsen | 8,915 | 14.72 | -3.16 | $34,713 | |||
| Green | Cathy MacLellan | 7,326 | 12.10 | +5.64 | $19,781 | |||
| Libertarian | Jason Cousineau | 333 | 0.55 | – | $0 | |||
| Independent | Mark Corbiere | 107 | 0.17 | – | ||||
| Communist | Ramon Portillo | 105 | 0.17 | – | $373 | |||
| Canadian Action | Kyle Huntingdon | 105 | 0.17 | – | $203 | |||
| Total valid votes/expense limit | 60,534 | 100.00 | $95,412 | |||||
| Total rejected ballots | 229 | 0.38 | – | |||||
| Turnout | 60,763 | 62.31 | -8.08 | |||||
| 2006 Canadian federal election | ||||||||
|---|---|---|---|---|---|---|---|---|
| Party | Candidate | Votes | % | ±% | ||||
| Liberal | Andrew Telegdi | 31,136 | 46.85 | -1.2 | ||||
| Conservative | Ajmer Mandur | 18,817 | 28.31 | -1.1 | ||||
| New Democratic | Edwin Laryea | 11,889 | 17.88 | +1.9 | ||||
| Green | Pauline Richards | 4,298 | 6.46 | +0.9 | ||||
| Independent | Ciprian Mihalcea | 173 | 0.26 | -0.4 | ||||
| Marxist–Leninist | Julian Ichim | 144 | 0.21 | |||||
| Total valid votes | 66,457 | 100.0 | ||||||
| Total rejected ballots | 240 | 0.38 | ||||||
| Turnout | 66,697 | 70.39 | ||||||
| 2004 Canadian federal election | ||||||||
|---|---|---|---|---|---|---|---|---|
| Party | Candidate | Votes | % | ±% | ||||
| Liberal | Andrew Telegdi | 28,015 | 48.1 | -2.2 | ||||
| Conservative | Steve Strauss | 17,155 | 29.5 | -9.5 | ||||
| New Democratic | Edwin Laryea | 9,267 | 15.9 | +7.8 | ||||
| Green | Pauline Richards | 3,277 | 5.6 | +4.1 | ||||
| Christian Heritage | Frank Ellis | 379 | 0.7 | |||||
| Independent | Ciprian Mihalcea | 124 | 0.2 | |||||
| Total valid votes | 58,217 | 100.0 | ||||||
Note: Conservative vote is compared to the total of the Canadian Alliance vote and Progressive Conservative vote in 2000 election.
| 2000 Canadian federal election | ||||||||
|---|---|---|---|---|---|---|---|---|
| Party | Candidate | Votes | % | ±% | ||||
| Liberal | Andrew Telegdi | 27,130 | 50.3 | +2.6 | ||||
| Alliance | Joshua Doig | 12,406 | 23.0 | +3.1 | ||||
| Progressive Conservative | Brian Bourke | 8,601 | 16.0 | -6.1 | ||||
| New Democratic | Richard Walsh-Bowers | 4,397 | 8.2 | -0.8 | ||||
| Green | Jack MacAulay | 809 | 1.5 | |||||
| Canadian Action | Robert E. Cormier | 273 | 0.5 | 0.0 | ||||
| Marxist–Leninist | Christine Nugent | 164 | 0.3 | 0.0 | ||||
| Independent | Frank Ellis | 105 | 0.2 | |||||
| Total valid votes | 53,885 | 100.0 | ||||||
| 1997 Canadian federal election | ||||||||
|---|---|---|---|---|---|---|---|---|
| Party | Candidate | Votes | % | |||||
| Liberal | Andrew Telegdi | 25,111 | 47.7 | |||||
| Progressive Conservative | Lynne Woolstencroft | 11,613 | 22.1 | |||||
| Reform | Mike Connolly | 10,502 | 20.0 | |||||
| New Democratic | Ted Martin | 4,725 | 9.0 | |||||
| Independent | Steve King | 265 | 0.5 | |||||
| Canadian Action | Monte Dennis | 260 | 0.5 | |||||
| Marxist–Leninist | Helmut Braun | 153 | 0.3 | |||||
| Total valid votes | 52,629 | 100.0 | ||||||
Waterloo, 1976–1996
| 1993 Canadian federal election | ||||||||
|---|---|---|---|---|---|---|---|---|
| Party | Candidate | Votes | % | ±% | ||||
| Liberal | Andrew Telegdi | 25,689 | 42.06 | +5.71 | ||||
| Reform | Mike Connolly | 15,549 | 25.46 | |||||
| Progressive Conservative | Lynne Woolstencroft | 14,882 | 24.37 | –20.74 | ||||
| New Democratic | Scott Piatkowski | 2,779 | 4.55 | –12.89 | ||||
| Christian Heritage | Ted Kryn | 920 | 1.51 | |||||
| Libertarian | Rita Huschka-Sprague | 473 | 0.77 | –0.34 | ||||
| Natural Law | Blaine P. Watson | 456 | 0.75 | |||||
| Independent | Don Philip Faithful | 329 | 0.54 | |||||
| Total valid votes | 61,077 | 100.00 | ||||||
| Liberal gain from Progressive Conservative | Swing | –9.88 | ||||||
| 1988 Canadian federal election | ||||||||
|---|---|---|---|---|---|---|---|---|
| Party | Candidate | Votes | % | ±% | ||||
| Progressive Conservative | Walter McLean | 26,949 | 45.11 | –11.24 | ||||
| Liberal | Steve Woodworth | 21,715 | 36.35 | +11.78 | ||||
| New Democratic | Scott Piatkowski | 10,418 | 17.44 | –0.71 | ||||
| Libertarian | Rita Huschka-Sprague | 663 | 1.11 | +0.18 | ||||
| Total valid votes | 59,745 | 100.0 | ||||||
| Progressive Conservative hold | Swing | –11.51 | ||||||
| 1984 Canadian federal election | ||||||||
|---|---|---|---|---|---|---|---|---|
| Party | Candidate | Votes | % | ±% | ||||
| Progressive Conservative | Walter McLean | 31,898 | 56.35 | +16.36 | ||||
| Liberal | Lynn Myers | 13,911 | 24.57 | –15.13 | ||||
| New Democratic | Bob Needham | 10,275 | 18.15 | –0.91 | ||||
| Libertarian | Layne E. Kulchecki | 525 | 0.93 | +0.49 | ||||
| Total valid votes | 56,609 | 100.0 | ||||||
| Progressive Conservative hold | Swing | +15.74 | ||||||
| 1980 Canadian federal election | ||||||||
|---|---|---|---|---|---|---|---|---|
| Party | Candidate | Votes | % | ±% | ||||
| Progressive Conservative | Walter McLean | 20,609 | 39.99 | –6.07 | ||||
| Liberal | Frank Epp | 20,455 | 39.70 | +4.59 | ||||
| New Democratic | Bob Needham | 9,819 | 19.06 | +0.94 | ||||
| Rhinoceros | Rick Nigol | 330 | 0.64 | |||||
| Libertarian | Colin McLorg | 229 | 0.44 | –0.03 | ||||
| Marxist–Leninist | Brian Erdman | 87 | 0.17 | –0.07 | ||||
| Total valid votes | 51,529 | 100.0 | ||||||
| Progressive Conservative hold | Swing | –5.33 | ||||||
| 1979 Canadian federal election | ||||||||
|---|---|---|---|---|---|---|---|---|
| Party | Candidate | Votes | % | ±% | ||||
| Progressive Conservative | Walter McLean | 23,837 | 46.06 | +17.68 | ||||
| Liberal | Frank Epp | 18,172 | 35.11 | +5.68 | ||||
| New Democratic | Mike Makarchuk | 9,375 | 18.12 | –23.46 | ||||
| Libertarian | Bonne Willy Posma | 241 | 0.47 | |||||
| Marxist–Leninist | Brian Erdman | 125 | 0.24 | +0.04 | ||||
| Total valid votes | 51,750 | 100.0 | ||||||
| Progressive Conservative gain from New Democratic | Swing | +6.00 | ||||||
Waterloo—Cambridge, 1973–1976
| 1974 Canadian federal election | ||||||||
|---|---|---|---|---|---|---|---|---|
| Party | Candidate | Votes | % | ±% | ||||
| New Democratic | Max Saltsman | 25,479 | 41.58 | +1.10 | ||||
| Liberal | Brian Goff | 18,034 | 29.43 | +3.39 | ||||
| Progressive Conservative | Glenn Carroll | 17,394 | 28.38 | –4.77 | ||||
| Social Credit | John H. Long | 253 | 0.41 | +0.17 | ||||
| Marxist–Leninist | Richard E. Rathwell | 122 | 0.20 | |||||
| Total valid votes | 61,282 | 100.0 | ||||||
| New Democratic hold | Swing | –1.14 | ||||||
Waterloo, 1966–1973
| 1972 Canadian federal election | ||||||||
|---|---|---|---|---|---|---|---|---|
| Party | Candidate | Votes | % | ±% | ||||
| New Democratic | Max Saltsman | 24,197 | 40.48 | +6.48 | ||||
| Progressive Conservative | Glenn E. Carroll | 19,817 | 33.15 | +0.63 | ||||
| Liberal | Lou Breithaupt | 15,570 | 26.04 | –7.07 | ||||
| Social Credit | Régent G. Gervais | 143 | 0.24 | –0.13 | ||||
| No affiliation | Jules W.P. Grajower | 55 | 0.09 | |||||
| Total valid votes | 59,782 | 100.0 | ||||||
| New Democratic hold | Swing | +2.92 | ||||||
| 1968 Canadian federal election | ||||||||
|---|---|---|---|---|---|---|---|---|
| Party | Candidate | Votes | % | |||||
| New Democratic | Max Saltsman | 15,231 | 34.00 | |||||
| Liberal | Herbert Epp | 14,835 | 33.11 | |||||
| Progressive Conservative | Liam S. O'Brian | 14,568 | 32.52 | |||||
| Social Credit | Régent Gervais | 167 | 0.37 | |||||
| Total valid votes | 44,801 | 100.0 | ||||||
| This riding was created from parts of Waterloo North and Waterloo South, which elected a Liberal and a Progressive Conservative, respectively, in the last election. | ||||||||
Notes
- Statistics Canada: 2016
- Elections Canada. "Report of the Federal Electoral Boundaries Commission for the Province of Ontario". Retrieved 2014-09-17.
- Parliament of Canada. "HISTORY OF FEDERAL RIDINGS SINCE 1867 - WATERLOO, Ontario (1968 - 1973)". Retrieved 2014-09-17.
- Parliament of Canada. "HISTORY OF FEDERAL RIDINGS SINCE 1867 - WATERLOO--CAMBRIDGE, Ontario (1973 - 1976)". Retrieved 2014-09-17.
- Parliament of Canada. "HISTORY OF FEDERAL RIDINGS SINCE 1867 - WATERLOO, Ontario (1976 - 1996)". Retrieved 2014-09-17.
- Parliament of Canada. "HISTORY OF FEDERAL RIDINGS SINCE 1867 - PERTH--WELLINGTON--WATERLOO, Ontario (1987 - 1996)". Retrieved 2014-09-17.
- Parliament of Canada. "HISTORY OF FEDERAL RIDINGS SINCE 1867 - KITCHENER--WATERLOO, Ontario (1996 - )". Retrieved 2014-09-17.
- Parliament of Canada. "HISTORY OF FEDERAL RIDINGS SINCE 1867 - WATERLOO--WELLINGTON, Ontario (1996 - 2003)". Retrieved 2014-09-17.
- Elections Canada. "Report of the Federal Electoral Boundaries Commission for the Province of Ontario". Retrieved 2013-07-31.
- "List of confirmed candidates". Elections Canada. Retrieved 4 October 2019.
- "Canada election results: Waterloo". GlobalNews. Retrieved 26 October 2019.
- Elections Canada – Confirmed candidates for Waterloo, 30 September 2015
- Elections Canada – Preliminary Election Expenses Limits for Candidates
- Pundits' Guide to Canadian Elections
External links
- Website of the Parliament of Canada
- Waterloo Conservative Electoral District Association
- Green Party of Canada - Kitchener-Waterloo
- Waterloo Federal Liberal Electoral District Association
- Kitchener-Waterloo NDP Federal Electoral District Association
- Waterloo People's Party Electoral District Association