Prince Edward—Hastings
Prince Edward—Hastings was a federal electoral district in Ontario, Canada, that existed in the House of Commons of Canada from 1968 to 2015. Its population in 2006 was 113,227. It was redistributed between Bay of Quinte electoral district and Hastings—Lennox and Addington electoral district as a result of the Canadian federal electoral redistribution, 2012.
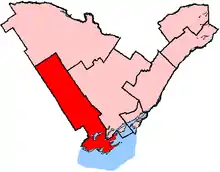 Prince Edward—Hastings shown within the Eastern Ontario region | |
| Defunct federal electoral district | |
| Legislature | House of Commons |
| District created | 1966 |
| District abolished | 2013 |
| First contested | 1968 |
| Last contested | 2011 |
| District webpage | profile, map |
| Demographics | |
| Population (2011)[1] | 117,057 |
| Electors (2011) | 88,198 |
| Area (km²)[2] | 6,654.82 |
| Census division(s) | Hastings, Prince Edward |
| Census subdivision(s) | Bancroft, Belleville, Carlow/Mayo, Centre Hastings, Deseronto, Faraday, Hastings Highlands, Limerick, Madoc, Marmora and Lake, Prince Edward, Stirling-Rawdon, Tudor and Cashel, Tweed, Tyendinaga, Tyendinaga Mohawk Territory, Wollaston |
History
The electoral district was created in 1966 from parts of Hastings South, Hastings—Frontenac, Northumberland, and Prince Edward—Lennox ridings.
It consisted of the County of Prince Edward, the Townships of Rawdon and Sidney (excluding the City of Belleville) in the County of Hastings, and the Townships of Brighton, Cramahe, Murray and Seymour in the County of Northumberland.
The electoral district was abolished in 1976 when it was redistributed between Northumberland and Prince Edward ridings, but Prince Edward riding was renamed "Prince Edward—Hastings" in 1978 before an election was held.
In 1976, Prince Edward riding was defined to consist of the County of Prince Edward, and, in the County of Hastings, the Townships of Hungerford, Huntingdon, Thurlow and Tyendinaga, the City of Belleville, and the Town of Deseronto, the Village of Frankford, and Tyendinaga Indian Reserve No. 38.
In 1996, it was redefined to consist of the County of Prince Edward, and the part of the County of Hastings lying south of and including the townships of Hungerford, Huntingdon and Rawdon, south of but excluding the Village of Stirling, and excluding the City of Trenton.
In 2003, it was redefined to consist of the County of Prince Edward and the County of Hastings (except the City of Quinte West).
As part of the Canadian federal electoral redistribution, 2012, the southern portion of district forms the bulk of the new Bay of Quinte district, while the northern portion becomes part of Hastings—Lennox and Addington.
Members of Parliament
This riding has elected the following Members of Parliament:
| Parliament | Years | Member | Party | |
|---|---|---|---|---|
| Prince Edward—Hastings Riding created from Hastings South, Hastings—Frontenac, Northumberland and Prince Edward—Lennox |
||||
| 28th | 1968–1972 | George Hees | Progressive Conservative | |
| 29th | 1972–1974 | |||
| 30th | 1974–1979 | |||
| 31st | 1979–1980 | Jack Ellis | ||
| 32nd | 1980–1984 | |||
| 33rd | 1984–1988 | |||
| 34th | 1988–1993 | Lyle Vanclief | Liberal | |
| 35th | 1993–1997 | |||
| 36th | 1997–2000 | |||
| 37th | 2000–2004 | |||
| 38th | 2004–2006 | Daryl Kramp | Conservative | |
| 39th | 2006–2008 | |||
| 40th | 2008–2011 | |||
| 41st | 2011–2015 | |||
| Riding dissolved into Bay of Quinte and Hastings—Lennox and Addington | ||||
Election results
| 2011 Canadian federal election | ||||||||
|---|---|---|---|---|---|---|---|---|
| Party | Candidate | Votes | % | ±% | Expenditures | |||
| Conservative | Daryl Kramp | 29,062 | 53.25 | +3.06 | – | |||
| New Democratic | Michael McMahon | 12,940 | 23.71 | +9.93 | – | |||
| Liberal | Peter Tinsley | 10,230 | 18.75 | -8.31 | – | |||
| Green | Patrick Larkin | 1,887 | 3.46 | -4.98 | – | |||
| Progressive Canadian | Andrew Skinner | 283 | 0.52 | – | – | |||
| Independent | Tim Hickey | 171 | 0.31 | – | – | |||
| Total valid votes/Expense limit | 54,573 | 99.63 | – | |||||
| Total rejected ballots | 205 | 0.37 | +0.04 | |||||
| Turnout | 54,778 | 61.40 | +2.34 | |||||
| Eligible voters | 89,208 | – | – | |||||
| Conservative hold | Swing | -3.43 | ||||||
| Wikinews has related news: |
| 2008 Canadian federal election | ||||||||
|---|---|---|---|---|---|---|---|---|
| Party | Candidate | Votes | % | ±% | Expenditures | |||
| Conservative | Daryl Kramp | 26,061 | 50.19 | +1.53 | $85,625 | |||
| Liberal | Ken Cole | 14,048 | 27.06 | -4.53 | $71,249 | |||
| New Democratic | Michael McMahon | 7,156 | 13.78 | -1.06 | $14,473 | |||
| Green | Alan Coxwell | 4,379 | 8.43 | +4.26 | $12,930 | |||
| Independent | Paul Barnes[3] | 276 | 0.53 | – | $0 | |||
| Total valid votes/Expense limit | 51,920 | 99.67 | $90,734 | |||||
| Total rejected ballots | 172 | 0.33 | -0.05 | |||||
| Turnout | 52,092 | 59.06 | -6.56 | |||||
| Eligible voters | 88,198 | |||||||
| Conservative hold | Swing | +3.03 | ||||||
| 2006 Canadian federal election | ||||||||
|---|---|---|---|---|---|---|---|---|
| Party | Candidate | Votes | % | ±% | ||||
| Conservative | Daryl Kramp | 27,787 | 48.7 | +6.3 | ||||
| Liberal | Bob Vaughan | 18,034 | 31.6 | -6.0 | ||||
| New Democratic | Michael McMahon | 8,474 | 14.8 | -0.4 | ||||
| Green | Joseph Sahadat | 2,386 | 4.2 | +0.2 | ||||
| Independent | Tim Hickey | 416 | 0.7 | – | ||||
| Total valid votes | 57,097 | 100.0 | ||||||
| 2004 Canadian federal election | ||||||||
|---|---|---|---|---|---|---|---|---|
| Party | Candidate | Votes | % | ±% | ||||
| Conservative | Daryl Kramp | 22,598 | 42.4 | -0.3 | ||||
| Liberal | Bruce Knutson | 20,042 | 37.6 | -14.0 | ||||
| New Democratic | Dan Douglas | 8,105 | 15.2 | +9.4 | ||||
| Green | Tom Lawson | 2,130 | 4.0 | |||||
| Independent | Joseph Sahadat | 468 | 0.9 | |||||
| Total valid votes | 53,343 | 100.0 | ||||||
Note: Conservative vote is compared to the total of the Canadian Alliance and Progressive Conservative votes in the 2000 election.
| 2000 Canadian federal election | ||||||||
|---|---|---|---|---|---|---|---|---|
| Party | Candidate | Votes | % | ±% | ||||
| Liberal | Lyle Vanclief | 20,055 | 50.5 | -1.1 | ||||
| Alliance | Jim Graham | 9,707 | 24.4 | +3.2 | ||||
| Progressive Conservative | Dennis Timbrell | 8,083 | 20.3 | -1.1 | ||||
| New Democratic | Jason Gannon | 1,897 | 4.8 | -1.0 | ||||
| Total valid votes | 39,742 | 100.0 | ||||||
Note: Canadian Alliance vote is compared to the Reform Party vote in the 1997 election.
| 1997 Canadian federal election | ||||||||
|---|---|---|---|---|---|---|---|---|
| Party | Candidate | Votes | % | ±% | ||||
| Liberal | Lyle Vanclief | 22,415 | 51.6 | -5.7 | ||||
| Progressive Conservative | Dennis Timbrell | 9,305 | 21.4 | +3.6 | ||||
| Reform | Lloyd Lewis | 9,219 | 21.2 | +1.7 | ||||
| New Democratic | Barb Dolan | 2,512 | 5.8 | +3.0 | ||||
| Total valid votes | 43,451 | 100.0 | ||||||
| 1993 Canadian federal election | ||||||||
|---|---|---|---|---|---|---|---|---|
| Party | Candidate | Votes | % | ±% | ||||
| Liberal | Lyle Vanclief | 26,483 | 57.3 | +14.2 | ||||
| Reform | Marjorie Foster | 9,019 | 19.5 | |||||
| Progressive Conservative | Jim Hughes | 8,245 | 17.8 | -18.3 | ||||
| New Democratic | Jim Martin | 1,275 | 2.8 | -11.7 | ||||
| National | Christine Kosman | 639 | 1.4 | |||||
| Christian Heritage | Dave Switzer | 556 | 1.2 | -3.3 | ||||
| Total valid votes | 46,217 | 100.0 | ||||||
| 1988 Canadian federal election | ||||||||
|---|---|---|---|---|---|---|---|---|
| Party | Candidate | Votes | % | ±% | ||||
| Liberal | Lyle Vanclief | 19,559 | 43.1 | +16.5 | ||||
| Progressive Conservative | Jack Arthur | 16,408 | 36.2 | -18.1 | ||||
| New Democratic | Don Wilson | 6,564 | 14.5 | -4.0 | ||||
| Christian Heritage | John B. Herring | 2,063 | 4.5 | |||||
| Confederation of Regions | Doug Grant | 522 | 1.2 | |||||
| Libertarian | Heather-Anne Lapsley | 229 | 0.5 | |||||
| Total valid votes | 45,345 | 100.0 | ||||||
| 1984 Canadian federal election | ||||||||
|---|---|---|---|---|---|---|---|---|
| Party | Candidate | Votes | % | ±% | ||||
| Progressive Conservative | Jack Ellis | 21,034 | 54.3 | +8.4 | ||||
| Liberal | Robert Scott | 10,321 | 26.7 | -8.2 | ||||
| New Democratic | Don Wilson | 7,162 | 18.5 | -0.2 | ||||
| Independent | George Nip Casey | 197 | 0.5 | |||||
| Total valid votes | 38,714 | 100.0 | ||||||
| 1980 Canadian federal election | ||||||||
|---|---|---|---|---|---|---|---|---|
| Party | Candidate | Votes | % | ±% | ||||
| Progressive Conservative | Jack Ellis | 16,893 | 45.9 | -7.4 | ||||
| Liberal | Ben Prinzen | 12,821 | 34.8 | +3.5 | ||||
| New Democratic | Donald Wilson | 6,889 | 18.7 | +4.0 | ||||
| Independent | Bill Hawthorne | 211 | 0.6 | -0.1 | ||||
| Total valid votes | 36,814 | 100.0 | ||||||
| 1979 Canadian federal election | ||||||||
|---|---|---|---|---|---|---|---|---|
| Party | Candidate | Votes | % | ±% | ||||
| Progressive Conservative | Jack Ellis | 21,088 | 53.3 | -0.5 | ||||
| Liberal | Kay Manderville | 12,394 | 31.3 | -3.7 | ||||
| New Democratic | Don Wilson | 5,833 | 14.7 | +4.3 | ||||
| Independent | William R. Hawthorne | 261 | 0.7 | |||||
| Total valid votes | 39,576 | 100.0 | ||||||
| 1974 Canadian federal election | ||||||||
|---|---|---|---|---|---|---|---|---|
| Party | Candidate | Votes | % | ±% | ||||
| Progressive Conservative | George Hees | 19,219 | 53.8 | -5.7 | ||||
| Liberal | George Cunningham | 12,504 | 35.0 | +4.0 | ||||
| New Democratic | Harvey Gottfried | 3,727 | 10.4 | +0.9 | ||||
| Independent | W. Bryan Burgess | 277 | 0.8 | |||||
| Total valid votes | 35,727 | 100.0 | ||||||
| 1972 Canadian federal election | ||||||||
|---|---|---|---|---|---|---|---|---|
| Party | Candidate | Votes | % | ±% | ||||
| Progressive Conservative | George Hees | 19,842 | 59.5 | +8.7 | ||||
| Liberal | George W. Cunningham | 10,353 | 31.0 | -9.8 | ||||
| New Democratic | Richard Lunn | 3,168 | 9.5 | +1.2 | ||||
| Total valid votes | 33,363 | 100.0 | ||||||
| 1968 Canadian federal election | ||||||||
|---|---|---|---|---|---|---|---|---|
| Party | Candidate | Votes | % | |||||
| Progressive Conservative | George Hees | 15,682 | 50.8 | |||||
| Liberal | George Wesley Cunningham | 12,614 | 40.9 | |||||
| New Democratic | Peter P. Miedema | 2,569 | 8.3 | |||||
| Total valid votes | 30,865 | 100.0 | ||||||
References
- "(Code 35073) Census Profile". 2011 census. Statistics Canada. 2012. Retrieved 2011-03-03.
- Riding history 1966-1976 from the Library of Parliament
- Riding history 1978-2008 from the Library of Parliament
- 2011 results from Elections Canada
- Campaign expense data from Elections Canada
Notes
- Statistics Canada: 2012
- Statistics Canada: 2012
- "Paul Barnes campaign". Archived from the original on 2008-12-22. Retrieved 2008-10-12.