Scarborough Centre (electoral district)
Scarborough Centre (French: Scarborough-Centre) is a federal electoral district in Ontario, Canada, that has been represented in the House of Commons of Canada since 1979.
.png.webp) Scarborough Centre in relation to the other Toronto ridings (2013 boundaries) | |||
| Coordinates: | 43.753°N 79.273°W | ||
| Federal electoral district | |||
| Legislature | House of Commons | ||
| MP |
Liberal | ||
| District created | 1976 | ||
| First contested | 1979 | ||
| Last contested | 2019 | ||
| District webpage | profile, map | ||
| Demographics | |||
| Population (2011)[1] | 108,826 | ||
| Electors (2015) | 70,145 | ||
| Area (km²)[2] | 30 | ||
| Pop. density (per km²) | 3,627.5 | ||
| Census division(s) | Toronto | ||
| Census subdivision(s) | Toronto | ||
.gif)
The riding was created in 1976 from parts of Scarborough East, Scarborough West and York—Scarborough ridings.
It consists of the part of the Scarborough district of the City of Toronto bounded:
- on the west by Victoria Park Avenue,
- on the north by Highway 401,
- on the east by McCowan Road, Lawrence Avenue East and Bellamy Road North, and
- on the south by Eglinton Avenue East.
Notable landmarks in Scarborough Centre include:
- Scarborough Civic Centre, site of east Toronto district council meetings, and adjacent Albert Campbell Square
- Scarborough Town Centre, a large shopping mall
- Scarborough Centre RT station
- Scarborough Hospital, General Division
- Scarborough Historical Museum
It has been represented in the House of Commons by Liberal MP Salma Zahid since 2015.
Geography
The riding contains the neighbourhoods of Scarborough City Centre (west of McCowan Road), Bendale (west of McCowan and south of Lawrence), Eglinton East, Ionview (north of Eglinton Avenue), Golden Mile (north of Eglinton Avenue), Wexford, Maryvale, and Dorset Park.
History
Scarborough Centre was created in 1976. It consisted initially of the part of the Borough of Scarborough bounded on the west by Victoria Park Avenue, on the north by Ellesmere Road, on the east by Bellamy Road North, and on the south by Eglinton Avenue East.
In 1987, it was expanded to include the part of Scarborough lying bounded by Bellamy Road North, Lawrence Avenue East, Markham Road and Eglinton Avenue East.
In 1996, it was redefined such that it was bounded:
- on the west by Victoria Park Avenue,
- on the north by a line drawn from west to east along Ellesmere Road, north along the Canadian National Railway and west along Highway 401,
- on the east by a line drawn from north to south along Highland Creek East, west along Ellesmere Road, south along Scarborough Golf Club Road, west along Lawrence Avenue East and south along Markham Road, and
- on the south by Eglinton Avenue East.
In 2003, it was given its current boundaries as described above.
This riding lost territory to Scarborough—Guildwood, and gained territory from Scarborough Southwest during the 2012 electoral redistribution.
Members of Parliament
This riding has elected the following Members of Parliament:
| Parliament | Years | Member | Party | |
|---|---|---|---|---|
| Scarborough Centre Riding created from Scarborough East, Scarborough West and York—Scarborough |
||||
| 31st | 1979–1980 | Diane Stratas | Progressive Conservative | |
| 32nd | 1980–1984 | Norm Kelly | Liberal | |
| 33rd | 1984–1988 | Pauline Browes | Progressive Conservative | |
| 34th | 1988–1993 | |||
| 35th | 1993–1997 | John Cannis | Liberal | |
| 36th | 1997–2000 | |||
| 37th | 2000–2004 | |||
| 38th | 2004–2006 | |||
| 39th | 2006–2008 | |||
| 40th | 2008–2011 | |||
| 41st | 2011–2015 | Roxanne James | Conservative | |
| 42nd | 2015–2019 | Salma Zahid | Liberal | |
| 43rd | 2019–present | |||
Former boundaries
 1976 to 1987
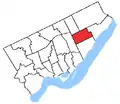 1987 to 1996
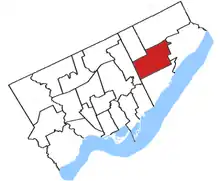 1996 to 2003
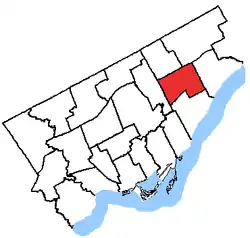 2003 to 2015
Election results
| 2019 Canadian federal election | ||||||||
|---|---|---|---|---|---|---|---|---|
| Party | Candidate | Votes | % | ±% | Expenditures | |||
| Liberal | Salma Zahid | 25,695 | 55.3 | $100,475.79 | ||||
| Conservative | Irshad Chaudhry | 10,387 | 22.3 | $88,298.94 | ||||
| New Democratic | Faiz Kamal | 5,452 | 11.7 | $11,622.00 | ||||
| Independent | John Cannis | 2,524 | 5.4 | - | $49,981.60 | |||
| Green | Dordana Hakimzadah | 1,336 | 2.9 | none listed | ||||
| People's | Jeremiah Vijeyaratnam | 1,162 | 2.5 | - | none listed | |||
| Total valid votes/Expense limit | 46,556 | 100.0 | ||||||
| Total rejected ballots | 638 | |||||||
| Turnout | 47,194 | 62.4 | ||||||
| Eligible voters | 75,662 | |||||||
| Source: Elections Canada[3][4] | ||||||||
| 2015 Canadian federal election | ||||||||
|---|---|---|---|---|---|---|---|---|
| Party | Candidate | Votes | % | ±% | Expenditures | |||
| Liberal | Salma Zahid | 22,753 | 50.5 | +18.61 | $111,259.09 | |||
| Conservative | Roxanne James | 14,705 | 32.7 | -2.18 | $96,481.13 | |||
| New Democratic | Alex Wilson | 5,227 | 11.6 | -19.06 | $24,264.68 | |||
| Libertarian | Katerina Androutsos | 1,384 | 3.1 | $1,452.03 | ||||
| Green | Lindsay Thompson | 960 | 2.1 | -0.47 | $1,627.92 | |||
| Total valid votes/Expense limit | 45,029 | 100.00 | +22.33 | $203,985.80 | ||||
| Total rejected ballots | 407 | 0.90 | +0.33 | |||||
| Turnout | 45,436 | 64.36 | +10.02 | |||||
| Eligible voters | 70,594 | +0.46 | ||||||
| Liberal gain from Conservative | Swing | +10.39% | ||||||
Source(s) | ||||||||
| 2011 federal election redistributed results[5] | |||
|---|---|---|---|
| Party | Vote | % | |
| Conservative | 12,841 | 34.88 | |
| Liberal | 11,738 | 31.89 | |
| New Democratic | 11,285 | 30.66 | |
| Green | 946 | 2.57 | |
| 2011 Canadian federal election | ||||||||
|---|---|---|---|---|---|---|---|---|
| Party | Candidate | Votes | % | ±% | Expenditures | |||
| Conservative | Roxanne James | 13,498 | 35.55 | +5.45 | ||||
| Liberal | John Cannis | 12,028 | 31.68 | -16.99 | ||||
| New Democratic | Natalie Hundt | 11,443 | 30.14 | +14.39 | ||||
| Green | Ella Ng | 998 | 2.63 | -2.83 | ||||
| Total valid votes/Expense limit | 37,967 | 100.00 | +3.10 | |||||
| Total rejected ballots | 217 | 0.57 | -0.07 | |||||
| Turnout | 38,184 | 54.34 | +2.21 | |||||
| Eligible voters | 70,274 | -1.15 | ||||||
| 2008 Canadian federal election | ||||||||
|---|---|---|---|---|---|---|---|---|
| Party | Candidate | Votes | % | ±% | Expenditures | |||
| Liberal | John Cannis | 17,927 | 48.67 | -6.7 | $61,436 | |||
| Conservative | Roxanne James | 11,088 | 30.10 | +2.8 | $74,654 | |||
| New Democratic | Natalie Hundt | 5,801 | 15.75 | +1.8 | $1,449 | |||
| Green | Ella Ng | 2,011 | 5.46 | +2.2 | $1,784 | |||
| Total valid votes/Expense limit | 36,827 | 100.00 | -12.60 | $81,313 | ||||
| Total rejected ballots | 235 | 0.63 | ||||||
| Turnout | 37,062 | 52.13 | ||||||
| Eligible voters | 71,094 | |||||||
| 2006 Canadian federal election | ||||||||
|---|---|---|---|---|---|---|---|---|
| Party | Candidate | Votes | % | ±% | ||||
| Liberal | John Cannis | 23,332 | 55.4 | +1.7 | ||||
| Conservative | Roxanne James | 11,522 | 27.3 | +5.3 | ||||
| New Democratic | Dorothy Laxton | 5,885 | 14.0 | -1.9 | ||||
| Green | Andrew Strachan | 1,396 | 3.3 | +0.6 | ||||
| Total valid votes | 42,135 | 100.0 | ||||||
| 2004 Canadian federal election | ||||||||
|---|---|---|---|---|---|---|---|---|
| Party | Candidate | Votes | % | ±% | ||||
| Liberal | John Cannis | 20,740 | 53.7 | -13.8 | ||||
| Conservative | John Mihtis | 8,515 | 22.0 | -0.2 | ||||
| New Democratic | Greg Gogan | 6,156 | 15.9 | +8.0 | ||||
| Green | Greg Bonser | 1,045 | 2.7 | |||||
| Communist | Dorothy Sauras | 152 | 0.3 | |||||
| Total valid votes | 36,608 | 100.0 | ||||||
Note: Conservative vote is compared to the total of the Canadian Alliance vote and Progressive Conservative vote in 2000 election.
| 2000 Canadian federal election | ||||||||
|---|---|---|---|---|---|---|---|---|
| Party | Candidate | Votes | % | ±% | ||||
| Liberal | John Cannis | 26,969 | 67.5 | +10.1 | ||||
| Alliance | Bill Settatree | 8,849 | 22.2 | +3.7 | ||||
| New Democratic | Ali Mallah | 3,171 | 7.9 | -0.3 | ||||
| Marijuana | Paul Coulbeck | 959 | 2.4 | |||||
| Total valid votes | 39,948 | 100.0 | ||||||
Note: Canadian Alliance vote is compared to the Reform vote in 1997 election.
| 1997 Canadian federal election | ||||||||
|---|---|---|---|---|---|---|---|---|
| Party | Candidate | Votes | % | ±% | ||||
| Liberal | John Cannis | 25,185 | 57.4 | +4.9 | ||||
| Reform | Bill Settatree | 8,106 | 18.5 | -2.2 | ||||
| Progressive Conservative | Brian Shedden | 6,976 | 15.9 | -4.6 | ||||
| New Democratic | Chris Stewart | 3,619 | 8.2 | +4.2 | ||||
| Total valid votes | 43,886 | 100.0 | ||||||
| 1993 Canadian federal election | ||||||||
|---|---|---|---|---|---|---|---|---|
| Party | Candidate | Votes | % | ±% | ||||
| Liberal | John Cannis | 21,097 | 52.5 | +12.8 | ||||
| Reform | John Pope | 8,323 | 20.7 | |||||
| Progressive Conservative | Pauline Browes | 8,257 | 20.5 | -20.1 | ||||
| New Democratic | Guy Hunter | 1,607 | 4.0 | -14.9 | ||||
| National | Jean Schilling | 321 | 0.8 | |||||
| Natural Law | David Gordon | 191 | 0.5 | |||||
| Independent | Steven Lam | 185 | 0.5 | |||||
| Libertarian | George Dance | 153 | 0.4 | -0.4 | ||||
| Marxist–Leninist | France Tremblay | 38 | 0.1 | |||||
| Abolitionist | Denis A. Mazerolle | 22 | 0.1 | |||||
| Total valid votes | 40,194 | 100.0 | ||||||
| 1988 Canadian federal election | ||||||||
|---|---|---|---|---|---|---|---|---|
| Party | Candidate | Votes | % | ±% | ||||
| Progressive Conservative | Pauline Browes | 17,247 | 40.6 | -6.0 | ||||
| Liberal | Odysseus Katsaitis | 16,846 | 39.7 | +6.4 | ||||
| New Democratic | Garth C. Dee | 8,004 | 18.9 | -0.4 | ||||
| Libertarian | Dusan Kubias | 342 | 0.8 | 0.0 | ||||
| Total valid votes | 42,439 | 100.0 | ||||||
| 1984 Canadian federal election | ||||||||
|---|---|---|---|---|---|---|---|---|
| Party | Candidate | Votes | % | ±% | ||||
| Progressive Conservative | Pauline Browes | 19,968 | 46.7 | +10.2 | ||||
| Liberal | Norm Kelly | 14,229 | 33.3 | -7.1 | ||||
| New Democratic | Michael Prue | 8,240 | 19.3 | -3.2 | ||||
| Libertarian | Mathias Blecker | 345 | 0.8 | +0.2 | ||||
| Total valid votes | 42,782 | 100.0 | ||||||
| 1980 Canadian federal election | ||||||||
|---|---|---|---|---|---|---|---|---|
| Party | Candidate | Votes | % | ±% | ||||
| Liberal | Norm Kelly | 16,595 | 40.3 | +7.0 | ||||
| Progressive Conservative | Diane Stratas | 14,995 | 36.4 | -7.0 | ||||
| New Democratic | Michael Prue | 9,237 | 22.4 | +0.3 | ||||
| Libertarian | Mathias Blecker | 238 | 0.6 | +0.1 | ||||
| Marxist–Leninist | Judith Killoran | 97 | 0.2 | +0.1 | ||||
| Total valid votes | 41,162 | 100.0 | ||||||
| 1979 Canadian federal election | ||||||||
|---|---|---|---|---|---|---|---|---|
| Party | Candidate | Votes | % | |||||
| Progressive Conservative | Diane Stratas | 18,688 | 43.4 | |||||
| Liberal | Bruce L. Cox | 14,323 | 33.3 | |||||
| New Democratic | Tom Lyons | 9,533 | 22.2 | |||||
| Libertarian | Don Otto | 213 | 0.5 | |||||
| Independent | David Owen | 203 | 0.5 | |||||
| Marxist–Leninist | Judith Killoran | 70 | 0.2 | |||||
| Total valid votes | 43,030 | 100.0 | ||||||
References
- "(Code 35081) Census Profile". 2011 census. Statistics Canada. 2012. Retrieved 2011-03-03.
- Riding history from the Library of Parliament
- 2011 results from Elections Canada
- Campaign expense data from Elections Canada
Notes
- Statistics Canada: 2011
- Statistics Canada: 2011
- "List of confirmed candidates". Elections Canada. Retrieved October 4, 2019.
- "Election Night Results". Elections Canada. Retrieved November 4, 2019.
- Pundits' Guide to Canadian Elections