Haliburton—Kawartha Lakes—Brock
Haliburton—Kawartha Lakes—Brock (formerly Haliburton—Victoria—Brock and Victoria—Haliburton) is a federal electoral district in central Ontario, Canada, that has been represented in the House of Commons of Canada since 1968.
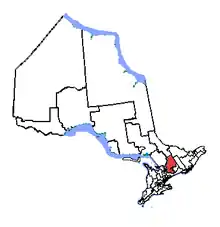 Haliburton—Kawartha Lakes—Brock in relation to other Ontario electoral districts (2003 boundaries) | |||
| Federal electoral district | |||
| Legislature | House of Commons | ||
| MP |
Conservative | ||
| District created | 1966 | ||
| First contested | 1968 | ||
| Last contested | 2019 | ||
| District webpage | profile, map | ||
| Demographics | |||
| Population (2011)[1] | 110,182 | ||
| Electors (2015) | 90,594 | ||
| Area (km²)[2] | 8,941 | ||
| Pop. density (per km²) | 12.3 | ||
| Census division(s) | Durham, Haliburton, Kawartha Lakes, Peterborough | ||
| Census subdivision(s) | Algonquin Highlands, Brock, Cavan-Monaghan, Dysart and Others, Highlands East, Kawartha Lakes, Minden Hills | ||
Geography
The district includes the City of Kawartha Lakes, Haliburton County, the Township of Brock, and also the Township of Cavan-Monaghan.
Demographics
- According to the Canada 2011 Census; 2013 representation[3][4]
Ethnic groups: 96.1% White, 2.0% Aboriginal
Languages: 94.5% English, 1.3% German, 1.2% French
Religions: 68.1% Christian (21.3% United Church, 15.5% Catholic, 11.1% Anglican, 4.4% Presbyterian, 3.8% Baptist, 2.0% Pentecostal, 1.0% Lutheran, 9.0% Other), 30.8% No religion
Median income (2010): $28,098
Average income (2010): $37,231
Riding associations
Riding associations are the local branches of the national political parties:
| Party | Association Name | CEO | HQ Address | HQ City | |
| Christian Heritage Party of Canada | CHP - Haliburton—Kawartha Lakes—Brock | (John) David Switzer | 1369 25th Line | Haliburton ON | |
| Conservative Party of Canada | Haliburton—Kawartha Lakes—Brock Conservative Association | Derrick Camphorst | PO BOX 810 | Lindsay ON | |
| Liberal Party of Canada | Haliburton—Kawartha Lakes—Brock Federal Liberal Association | Larry Giles | 104 Kent St. W | Lindsay ON | |
| New Democratic Party | Haliburton—Kawartha Lakes—Brock Federal NDP Riding Association | Barbara Doyle | Lindsay ON | City of Kawartha Lakes ON | |
| Green | Haliburton—Kawartha Lakes—Brock Federal Green Party Association | Robert M. Nesbitt | 115 Albert Street North | Lindsay ON | |
History
It was created in 1966 as "Victoria—Haliburton" from parts of Victoria, Peterborough and Hastings—Frontenac and ridings.
It consisted initially of
- in the County of Hastings: the Townships of Bangor, Carlow, Herschel, McClure, Monteagle and Wicklow;
- the County of Haliburton;
- in the County of Ontario: the Townships of Brock, Mara, Rama and Thorah, the islands in Lake Couchiching belonging to Rama Indian Reserve No. 32, but excluding all islands belonging to Georgina Island Indian Reserve No. 33;
- in the County of Peterborough: the Townships of Anstruther, Burleigh, Cavendish, Chandos, Galway and Harvey;
- the County of Victoria.
In 1976, the Township of Manvers in the county of Victoria, all parts of the county of Hastings, all townships other than the Township of Brock) in the Regional Municipality of Durham (formerly the County of Ontario) were excluded from the riding, and the Township of Georgina in the Regional Municipality of York was added.
In 1987, the riding was redefined to consist of the counties of Haliburton and Victoria, the Township of Brock in the Regional Municipality of Durham, and, in the County of Peterborough, the Village of Millbrook and the townships of Burleigh and Anstruther, Cavan, Chandos, Galway and Cavendish, and Harvey.
In 1996, it was redefined to consist of the County of Victoria, the Township of Brock in the Regional Municipality of Durham, the County of Haliburton (excluding the townships of Sherborne, McClintock, Livingstone, Lawrence and Nightingale), and the part of the County of Peterborough lying north of and including the townships of Burleigh and Anstruther, Chandos and Harvey, including the Village of Millbrook and the Township of Cavan.
The name of the electoral district was changed in 1998 to "Haliburton—Victoria—Brock".
The name of the electoral district was changed in 2003 when Victoria County became the city of Kawartha Lakes. The boundaries were slightly altered to what they are today.
In 2013, the federal redistribution saw slight changes to the riding which removed the County of Peterborough Townships of Trent Lakes and North Kawartha. Both of these townships were placed in the new riding of Peterborough-Kawartha. These changes will first be used for the 2015 Federal Election.
Member of Parliament
This riding has elected the following Members of Parliament:
| Parliament | Years | Member | Party | |
|---|---|---|---|---|
| Victoria—Haliburton Riding created from Hastings—Frontenac, Peterborough and Victoria |
||||
| 28th | 1968–1972 | William C. Scott | Progressive Conservative | |
| 29th | 1972–1974 | |||
| 30th | 1974–1979 | |||
| 31st | 1979–1980 | |||
| 32nd | 1980–1984 | |||
| 33rd | 1984–1988 | |||
| 34th | 1988–1993 | |||
| 35th | 1993–1997 | John O'Reilly | Liberal | |
| 36th | 1997–2000 | |||
| Haliburton—Victoria—Brock | ||||
| 37th | 2000–2004 | John O'Reilly | Liberal | |
| Haliburton—Kawartha Lakes—Brock | ||||
| 38th | 2004–2006 | Barry Devolin | Conservative | |
| 39th | 2006–2008 | |||
| 40th | 2008–2011 | |||
| 41st | 2011–2015 | |||
| 42nd | 2015–2019 | Jamie Schmale | ||
| 43rd | 2019–present | |||
Election results
| 2019 Canadian federal election | ||||||||
|---|---|---|---|---|---|---|---|---|
| Party | Candidate | Votes | % | ±% | Expenditures | |||
| Conservative | Jamie Schmale | 32,257 | 49.1 | +4.27 | $50,030.95 | |||
| Liberal | Judi Forbes | 17,067 | 26.0 | -5.75 | $41,518.07 | |||
| New Democratic | Barbara Doyle | 9,676 | 14.7 | -4.73 | $7,114.67 | |||
| Green | Elizabeth Fraser | 5,515 | 8.4 | +4.41 | none listed | |||
| People's | Gene Balfour | 1,245 | 1.9 | – | none listed | |||
| Total valid votes/Expense limit | 65,760 | 100.0 | ||||||
| Total rejected ballots | 413 | |||||||
| Turnout | 66,173 | 66.9 | ||||||
| Eligible voters | 98,985 | |||||||
| Conservative hold | Swing | +5.01 | ||||||
| Source: Elections Canada[5][6] | ||||||||
| 2015 Canadian federal election | ||||||||
|---|---|---|---|---|---|---|---|---|
| Party | Candidate | Votes | % | ±% | Expenditures | |||
| Conservative | Jamie Schmale | 27,718 | 44.83 | -15.21 | $69,530.77 | |||
| Liberal | David Marquis | 19,634 | 31.75 | +18.90 | $45,773.96 | |||
| New Democratic | Mike Perry | 12,012 | 19.43 | -2.64 | $53,554.91 | |||
| Green | Bill MacCallum | 2,470 | 3.99 | -1.05 | $8,268.38 | |||
| Total valid votes/Expense limit | 61,834 | 100.00 | $232,886.36 | |||||
| Total rejected ballots | 203 | 0.33 | – | |||||
| Turnout | 62,037 | 68.02 | – | |||||
| Eligible voters | 91,208 | |||||||
| Conservative hold | Swing | -17.06 | ||||||
| Source: Elections Canada[7][8] | ||||||||
| 2011 federal election redistributed results[9] | |||
|---|---|---|---|
| Party | Vote | % | |
| Conservative | 32,842 | 60.04 | |
| New Democratic | 12,069 | 22.06 | |
| Liberal | 7,030 | 12.85 | |
| Green | 2,760 | 5.05 | |
| 2011 Canadian federal election | ||||||||
|---|---|---|---|---|---|---|---|---|
| Party | Candidate | Votes | % | ±% | Expenditures | |||
| Conservative | Barry Devolin | 35,192 | 60.0 | +4.0 | – | |||
| New Democratic | Lyn Edwards | 12,934 | 22.1 | +7.5 | – | |||
| Liberal | Laura Redman | 7,539 | 12.9 | -7.5 | – | |||
| Green | Susanne Lauten | 2,963 | 5.1 | -3.2 | – | |||
| Total valid votes | 58,628 | 100.0 | – | |||||
| Total rejected ballots | 163 | 0.27 | -0.06 | |||||
| Turnout | 58,791 | 63.72 | – | |||||
| Eligible voters | 92,201 | – | – | |||||
| 2008 Canadian federal election | ||||||||
|---|---|---|---|---|---|---|---|---|
| Party | Candidate | Votes | % | ±% | Expenditures | |||
| Conservative | Barry Devolin | 30,391 | 56.0 | +7.0 | $81,076 | |||
| Liberal | Marlene White | 11,093 | 20.4 | -8.4 | $41,648 | |||
| New Democratic | Stephen Yardy | 7,952 | 14.6 | -2.6 | $14,356 | |||
| Green | Michael Bell | 4,505 | 8.3 | +3.3 | $2 | |||
| Christian Heritage | Dave Switzer | 374 | 0.7 | -0.2 | $1,702 | |||
| Total valid votes/Expense limit | 54,315 | 100.0 | $95,767 | |||||
| Rejected ballots | 181 | 0.33 | ||||||
| Turnout | 54,496 | |||||||
| 2006 Canadian federal election | ||||||||
|---|---|---|---|---|---|---|---|---|
| Party | Candidate | Votes | % | ±% | ||||
| Conservative | Barry Devolin | 29,427 | 49.0 | +4.8 | ||||
| Liberal | Greg Walling | 17,266 | 28.8 | -5.7 | ||||
| New Democratic | Anne MacDermid | 10,340 | 17.2 | +2.1 | ||||
| Green | Andy Harjula | 3,017 | 5.0 | +0.3 | ||||
| Total valid votes | 60,050 | 100.0 | ||||||
| 2004 Canadian federal election | ||||||||
|---|---|---|---|---|---|---|---|---|
| Party | Candidate | Votes | % | ±% | ||||
| Conservative | Barry Devolin | 24,731 | 44.2 | -17.0 | ||||
| Liberal | John O'Reilly | 19,294 | 34.5 | +0.5 | ||||
| New Democratic | Gil J. McElroy | 8,427 | 15.1 | +10.2 | ||||
| Green | Tim Holland | 2,637 | 4.7 | |||||
| Christian Heritage | Peter Vogel | 493 | 0.9 | |||||
| Independent | Charles Olito | 330 | 0.6 | |||||
| Total valid votes | 55,912 | 100.0 | ||||||
Note: Conservative vote is compared to the total of the Canadian Alliance vote and Progressive Conservative vote in 2000 election.
| 2000 Canadian federal election | ||||||||
|---|---|---|---|---|---|---|---|---|
| Party | Candidate | Votes | % | ±% | ||||
| Liberal | John O'Reilly | 16,710 | 34.0 | -0.1 | ||||
| Alliance | Pat Dunn | 15,591 | 31.7 | -0.2 | ||||
| Progressive Conservative | Laurie Scott | 14,508 | 29.5 | +2.8 | ||||
| New Democratic | Rick Denyer | 2,409 | 4.9 | -1.6 | ||||
| Total valid votes | 49,218 | 100.0 | ||||||
Note: Canadian Alliance vote is compared to the Reform vote in 1997 election.
| 1997 Canadian federal election | ||||||||
|---|---|---|---|---|---|---|---|---|
| Party | Candidate | Votes | % | ±% | ||||
| Liberal | John O'Reilly | 18,205 | 34.0 | -2.6 | ||||
| Reform | Pat Dunn | 17,024 | 31.8 | +3.4 | ||||
| Progressive Conservative | Lorne Edward Chester | 14,283 | 26.7 | +4.6 | ||||
| New Democratic | Rick Denyer | 3,456 | 6.5 | +2.7 | ||||
| Canadian Action | Charles Olito | 504 | 0.9 | +0.6 | ||||
| Total valid votes | 53,472 | 100.0 | ||||||
Note: the popular vote for Canadian Action Party candidate Charles Olito is compared to his vote as a Canada Party candidate in the 1993 election.
| 1993 Canadian federal election | ||||||||
|---|---|---|---|---|---|---|---|---|
| Party | Candidate | Votes | % | ±% | ||||
| Liberal | John O'Reilly | 20,511 | 36.7 | +1.9 | ||||
| Reform | Barry Devolin | 15,916 | 28.5 | |||||
| Progressive Conservative | Lorne Edward Chester | 12,378 | 22.1 | -24.7 | ||||
| Independent | Dennis Drainville | 3,584 | 6.4 | |||||
| New Democratic | Cathy Vainio | 2,118 | 3.8 | -13.5 | ||||
| National | Martin Doyle | 620 | 1.1 | |||||
| Christian Heritage | Donald Waterhouse | 409 | 0.7 | |||||
| Natural Law | David Hetherington | 201 | 0.4 | |||||
| Canada Party | Charles Olito | 178 | 0.3 | |||||
| Total valid votes | 55,915 | 100.0 | ||||||
| 1988 Canadian federal election | ||||||||
|---|---|---|---|---|---|---|---|---|
| Party | Candidate | Votes | % | ±% | ||||
| Progressive Conservative | William C. Scott | 22,270 | 46.8 | -14.1 | ||||
| Liberal | Bruce Glass | 16,549 | 34.8 | +14.6 | ||||
| New Democratic | Cathy Vainio | 8,203 | 17.2 | -0.3 | ||||
| Libertarian | Sally Hayes | 265 | 0.6 | -0.1 | ||||
| Social Credit | Peter Rea | 168 | 0.4 | |||||
| Commonwealth of Canada | Archie J. Dobbins | 113 | 0.2 | |||||
| Total valid votes | 47,568 | 100.0 | ||||||
| 1984 Canadian federal election | ||||||||
|---|---|---|---|---|---|---|---|---|
| Party | Candidate | Votes | % | ±% | ||||
| Progressive Conservative | William C. Scott | 30,229 | 60.9 | +12.5 | ||||
| Liberal | Bruce Glass | 10,032 | 20.2 | -9.3 | ||||
| New Democratic | Patrick Daniel | 8,682 | 17.5 | -3.7 | ||||
| Green | George K. Kerr | 339 | 0.7 | |||||
| Libertarian | Robert A. Durnin | 324 | 0.7 | -0.2 | ||||
| Total valid votes | 49,606 | 100.0 | ||||||
| 1980 Canadian federal election | ||||||||
|---|---|---|---|---|---|---|---|---|
| Party | Candidate | Votes | % | ±% | ||||
| Progressive Conservative | William C. Scott | 20,308 | 48.4 | -9.9 | ||||
| Liberal | Ivan Rodd | 12,388 | 29.5 | +3.2 | ||||
| New Democratic | Patrick Daniel | 8,884 | 21.2 | +6.1 | ||||
| Libertarian | John Hayes | 367 | 0.9 | +0.7 | ||||
| Total valid votes | 41,947 | 100.0 | ||||||
| 1979 Canadian federal election | ||||||||
|---|---|---|---|---|---|---|---|---|
| Party | Candidate | Votes | % | ±% | ||||
| Progressive Conservative | William C. Scott | 26,624 | 58.3 | +4.8 | ||||
| Liberal | David Logan | 12,004 | 26.3 | -7.2 | ||||
| New Democratic | Patrick Daniel | 6,872 | 15.1 | +2.1 | ||||
| Libertarian | Gabriel Moldovanyi | 100 | 0.2 | |||||
| Marxist–Leninist | Barbara Harris | 49 | 0.1 | |||||
| Total valid votes | 45,649 | 100.0 | ||||||
| 1974 Canadian federal election | ||||||||
|---|---|---|---|---|---|---|---|---|
| Party | Candidate | Votes | % | ±% | ||||
| Progressive Conservative | William C. Scott | 17,570 | 53.5 | -4.1 | ||||
| Liberal | David Walling | 11,002 | 33.5 | +3.2 | ||||
| New Democratic | Maurice Windatt | 4,245 | 12.9 | +1.0 | ||||
| Total valid votes | 32,817 | 100.0 | ||||||
| 1972 Canadian federal election | ||||||||
|---|---|---|---|---|---|---|---|---|
| Party | Candidate | Votes | % | ±% | ||||
| Progressive Conservative | William C. Scott | 18,450 | 57.7 | +10.1 | ||||
| Liberal | David R. Walling | 9,711 | 30.4 | -8.3 | ||||
| New Democratic | Maurice Windatt | 3,826 | 12.0 | -0.8 | ||||
| Total valid votes | 31,987 | 100.0 | ||||||
| 1968 Canadian federal election | ||||||||
|---|---|---|---|---|---|---|---|---|
| Party | Candidate | Votes | % | |||||
| Progressive Conservative | William C. Scott | 12,621 | 47.6 | |||||
| Liberal | Dave Logan | 10,263 | 38.7 | |||||
| New Democratic | Allan Gordon McPhail | 3,374 | 12.7 | |||||
| Independent | Harvie James Armstrong | 258 | 1.0 | |||||
| Total valid votes | 26,516 | 100.0 | ||||||
References
- "(Code 35029) Census Profile". 2011 census. Statistics Canada. 2012. Retrieved 2011-03-03.
- Riding history from the Library of Parliament.
- 2011 Results from Elections Canada
- Campaign expense data from Elections Canada
Notes
- Statistics Canada: 2011
- Statistics Canada: 2011
- http://www12.statcan.gc.ca/nhs-enm/2011/dp-pd/prof/details/page.cfm?Lang=E&Geo1=FED2013&Code1=35034&Data=Count&SearchText=Haliburton&SearchType=Begins&SearchPR=01&A1=All&B1=All&Custom=&TABID=12
- http://www12.statcan.gc.ca/nhs-enm/2011/dp-pd/prof/details/page.cfm?Lang=E&Geo1=FED2013&Code1=35034&Data=Count&SearchText=Haliburton&SearchType=Begins&SearchPR=01&A1=All&B1=All&Custom=&TABID=1#tabs2
- "List of confirmed candidates". Elections Canada. Retrieved 3 October 2019.
- "Election Night Results". Elections Canada. Retrieved October 30, 2019.
- Elections Canada – Confirmed candidates for Haliburton—Kawartha Lakes—Brock, 30 September 2015
- Elections Canada – Preliminary Election Expenses Limits for Candidates
- Pundits' Guide to Canadian Elections