Northumberland—Peterborough South
Northumberland—Peterborough South (French: Northumberland—Peterborough-Sud) is a federal electoral district in Ontario.[2]
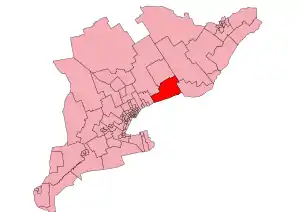 Northumberland-Peterborough South in relation to other electoral districts in Southern Ontario | |||
| Federal electoral district | |||
| Legislature | House of Commons | ||
| MP |
Conservative | ||
| District created | 2013 | ||
| First contested | 2015 | ||
| Last contested | 2019 | ||
| District webpage | profile, map | ||
| Demographics | |||
| Population (2011)[1] | 107,840 | ||
| Electors (2015) | 88,276 | ||
| Area (km²)[1] | 3,001 | ||
| Pop. density (per km²) | 35.9 | ||
| Census division(s) | Durham, Northumberland, Peterborough County | ||
| Census subdivision(s) | Alnwick/Haldimand, Brighton, Clarington, Cobourg, Cramahe, Hamilton Township, Otonabee–South Monaghan, Peterborough, Port Hope, Trent Hills | ||
Northumberland—Peterborough South was created by the 2012 federal electoral boundaries redistribution and was legally defined in the 2013 representation order. It came into effect upon the call of the 42nd Canadian federal election, scheduled for 19 October 2015. 77% of the riding was formed from Northumberland—Quinte West, 13% from Durham and 10% from Peterborough.
The riding was originally intended to be named Northumberland—Pine Ridge.[3]
Geography
The riding is located in Central Ontario along Lake Ontario. It contains the entirety of Northumberland County, southern Peterborough and the eastern half of the municipality of Clarington.
Demographics
- According to the Canada 2011 Census; 2013 representation[4][5]
Ethnic groups: 95.0% White, 2.5% Aboriginal
Languages: 94.0% English, 1.6% French
Religions: 71.3% Christian (20.1% United Church, 19.4% Catholic, 12.8% Anglican, 4.0% Presbyterian, 2.8% Baptist, 1.6% Pentecostal, 1.2% Lutheran, 9.5% Other), 27.6% No religion
Median income (2010): $30,350
Average income (2010): $38,693
Members of Parliament
This riding has elected the following Members of Parliament:
| Parliament | Years | Member | Party | |
|---|---|---|---|---|
| Northumberland—Peterborough South Riding created from Durham, Northumberland—Quinte West and Peterborough |
||||
| 42nd | 2015–2019 | Kim Rudd | Liberal | |
| 43rd | 2019–present | Philip Lawrence | Conservative | |
Election results
| 2019 Canadian federal election | ||||||||
|---|---|---|---|---|---|---|---|---|
| Party | Candidate | Votes | % | ±% | Expenditures | |||
| Conservative | Philip Lawrence | 27,385 | 39.7 | +0.14 | $68,864.16 | |||
| Liberal | Kim Rudd | 24,977 | 36.2 | -6.31 | $83,715.67 | |||
| New Democratic | Mallory MacDonald | 9,615 | 13.9 | -0.9 | $8,871.55 | |||
| Green | Jeff Wheeldon | 5,524 | 8.0 | +4.87 | none listed | |||
| People's | Frank Vaughan | 1,460 | 2.1 | – | $1,643.34 | |||
| Total valid votes/Expense limit | 68,961 | 100.0 | ||||||
| Total rejected ballots | 484 | |||||||
| Turnout | 69,445 | 71.7 | ||||||
| Eligible voters | 96,841 | |||||||
| Conservative gain from Liberal | Swing | +3.23 | ||||||
| Source: Elections Canada[6][7] | ||||||||
| 2015 Canadian federal election | ||||||||
|---|---|---|---|---|---|---|---|---|
| Party | Candidate | Votes | % | ±% | Expenditures | |||
| Liberal | Kim Rudd | 27,043 | 42.51 | +21.42 | $114,323.76 | |||
| Conservative | Adam Moulton | 25,165 | 39.56 | -13.80 | $135,349.14 | |||
| New Democratic | Russ Christianson | 9,411 | 14.80 | -5.79 | $41,225.56 | |||
| Green | Patricia Sinnott | 1,990 | 3.13 | -1.55 | $1,350.03 | |||
| Total valid votes/Expense limit | 63,609 | 100.00 | $229,426.74 | |||||
| Total rejected ballots | 267 | 0.42 | – | |||||
| Turnout | 63,876 | 71.67 | – | |||||
| Eligible voters | 89,128 | |||||||
| Liberal gain from Conservative | Swing | +17.61 | ||||||
| Source: Elections Canada[8][9][10] | ||||||||
| 2011 federal election redistributed results[11] | |||
|---|---|---|---|
| Party | Vote | % | |
| Conservative | 29,377 | 53.37 | |
| Liberal | 11,611 | 21.09 | |
| New Democratic | 11,331 | 20.58 | |
| Green | 2,576 | 4.68 | |
| Others | 154 | 0.28 | |
References
- Statistics Canada: 2012
- Final Report – Ontario
- http://www.parl.gc.ca/HousePublications/Publication.aspx?Language=E&Mode=1&DocId=6654879&File=4
- http://www12.statcan.gc.ca/nhs-enm/2011/dp-pd/prof/details/page.cfm?Lang=E&Geo1=FED2013&Code1=35071&Data=Count&SearchText=Northumberland&SearchType=Begins&SearchPR=01&A1=All&B1=All&Custom=&TABID=1
- http://www12.statcan.gc.ca/nhs-enm/2011/dp-pd/prof/details/page.cfm?Lang=E&Geo1=FED2013&Code1=35071&Data=Count&SearchText=Northumberland&SearchType=Begins&SearchPR=01&A1=All&B1=All&Custom=&TABID=1#tabs2
- "List of confirmed candidates". Elections Canada. Retrieved October 3, 2019.
- "Election Night Results". Elections Canada. Retrieved October 30, 2019.
- Elections Canada – Confirmed candidates for Northumberland—Peterborough South, 30 September 2015
- Elections Canada – Preliminary Election Expenses Limits for Candidates
- Elections Canada - Preliminary Results 2015-10-20
- Pundits' Guide to Canadian Elections