Leeds—Grenville—Thousand Islands and Rideau Lakes
Leeds—Grenville—Thousand Islands and Rideau Lakes (French: Leeds—Grenville—Thousand Islands et Rideau Lakes) is a federal electoral district in Ontario, Canada, that has been represented in the House of Commons since 1979. Prior to the 2015 election, the riding was known as Leeds—Grenville.[2]
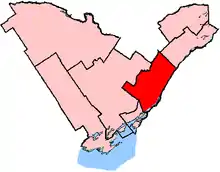 Leeds–Grenville shown within the Eastern Ontario region | |||
| Federal electoral district | |||
| Legislature | House of Commons | ||
| MP |
Conservative | ||
| District created | 1976 | ||
| First contested | 1979 | ||
| Last contested | 2019 | ||
| District webpage | profile, map | ||
| Demographics | |||
| Population (2016)[1] | 100,546 | ||
| Electors (2015) | 78,225 | ||
| Area (km²)[1] | 3,382.89 | ||
| Pop. density (per km²) | 29.7 | ||
| Census division(s) | Leeds and Grenville | ||
| Census subdivision(s) | Athens, Augusta, Brockville, Edwardsburgh/Cardinal, Elizabethtown–Kitley, Front of Yonge, Gananoque, Leeds and the Thousand Islands, Merrickville–Wolford, North Grenville, Prescott, Rideau Lakes, Westport | ||
The 2018 Leeds—Grenville—Thousand Islands and Rideau Lakes federal by-election was won by Michael Barrett.
Geography
The riding consists of the entirety of the United Counties of Leeds and Grenville.
Demographics
- According to the Canada 2016 Census[3]
Ethnic groups: 94.4% White, 3.5% Indigenous
Languages: 93.0% English, 3.7% French
Religions (2011):[4] 76.2% Christian (23.9% Catholic, 19.3% United Church, 15.0% Anglican, 4.0% Presbyterian, 1.5% Baptist, 10.9% Other), 22.6% None
Median income: $34,329 (2015)
Average income: $42,939 (2015)
History
The federal district was created in 1976 from parts of Grenville–Carleton and Leeds ridings.
It was initially defined as consisting of the County of Grenville and the County of Leeds, excluding the Town of Smiths Falls. Since 1987, it was re-defined as consisting of the United Counties of Leeds and Grenville, but this did not result in any boundary changes, as Smiths Falls is not part of the county. The 2003 redistribution defined the riding as also including the independent municipalities of Brockville, Gananoque and Prescott which are politically separate jurisdictions, but are geographically within the county, and therefore did not result in a boundary change either.
With the 2012 electoral redistribution, this district lost a small portion of territory to Lanark—Frontenac—Kingston,[5] following an annexation of a parcel of land by the Town Smiths Falls. In the process, the riding was renamed Leeds—Grenville—Thousand Islands and Rideau Lakes. At 49 characters, this is the longest riding name in Canada.
Members of Parliament
This riding has elected the following Members of Parliament:
| Parliament | Years | Member | Party | |
|---|---|---|---|---|
| Leeds—Grenville Riding created from Grenville—Carleton and Leeds |
||||
| 31st | 1979–1980 | Thomas Cossitt | Progressive Conservative | |
| 32nd | 1980–1982 | |||
| 1982–1984 | Jennifer Cossitt | |||
| 33rd | 1984–1988 | |||
| 34th | 1988–1993 | Jim Jordan | Liberal | |
| 35th | 1993–1997 | |||
| 36th | 1997–2000 | Joe Jordan | ||
| 37th | 2000–2004 | |||
| 38th | 2004–2006 | Gord Brown | Conservative | |
| 39th | 2006–2008 | |||
| 40th | 2008–2011 | |||
| 41st | 2011–2015 | |||
| Leeds—Grenville—Thousand Islands and Rideau Lakes | ||||
| 42nd | 2015–2018 | Gord Brown | Conservative | |
| 2018–2019 | Michael Barrett | |||
| 43rd | 2019–present | |||
Election results
| 2019 Canadian federal election | ||||||||
|---|---|---|---|---|---|---|---|---|
| Party | Candidate | Votes | % | ±% | Expenditures | |||
| Conservative | Michael Barrett | 28,630 | 48.98 | -8.85 | $52,413.10 | |||
| Liberal | Josh Bennett | 15,482 | 26.49 | -9.32 | $48,972.84 | |||
| New Democratic | Michelle Taylor | 8,201 | 14.03 | +11 | $4,315.07 | |||
| Green | Lorraine Rekmans | 5,152 | 8.81 | +5.86 | none listed | |||
| People's | Evan Hindle | 988 | 1.69 | none listed | ||||
| Total valid votes/Expense limit | 58,453 | 100.0 | ||||||
| Total rejected ballots | 479 | |||||||
| Turnout | 58,932 | 69.8 | ||||||
| Eligible voters | 84,442 | |||||||
| Conservative hold | Swing | +0.24 | ||||||
| Source: Elections Canada[6][7] | ||||||||
| Canadian federal by-election, December 3, 2018 Death of Gord Brown | ||||||||
|---|---|---|---|---|---|---|---|---|
| Party | Candidate | Votes | % | ±% | Expenditures | |||
| Conservative | Michael Barrett | 16,865 | 57.83 | +10.46 | ||||
| Liberal | Mary Jean McFall | 10,443 | 35.81 | -4.74 | ||||
| New Democratic | Michelle Taylor | 883 | 3.03 | -5.34 | ||||
| Green | Lorraine Rekmans | 859 | 2.95 | -0.75 | ||||
| Independent | John Turmel | 111 | 0.38 | |||||
| Total valid votes/Expense limit | 29,161 | 100.00 | ||||||
| Total rejected ballots | ||||||||
| Turnout | 35.89 | -35.18 | ||||||
| Eligible voters | 81,247 | |||||||
| Conservative hold | Swing | +7.60 | ||||||
| 2015 Canadian federal election | ||||||||
|---|---|---|---|---|---|---|---|---|
| Party | Candidate | Votes | % | ±% | Expenditures | |||
| Conservative | Gord Brown | 26,738 | 47.38 | -13.43 | $118,628.90 | |||
| Liberal | Mary Jean McFall | 22,888 | 40.56 | +24.66 | $98,777.41 | |||
| New Democratic | Margaret Andrade | 4,722 | 8.37 | -9.95 | $5,647.96 | |||
| Green | Lorraine A. Rekmans | 2,088 | 3.70 | -1.29 | $6,935.40 | |||
| Total valid votes/Expense limit | 56,436 | 100.00 | $213,643.31 | |||||
| Total rejected ballots | 189 | 0.33 | – | |||||
| Turnout | 56,625 | 71.08 | – | |||||
| Eligible voters | 79,669 | |||||||
| Conservative hold | Swing | -19.04 | ||||||
| Source: Elections Canada[8][9] | ||||||||
| 2011 federal election redistributed results[10] | |||
|---|---|---|---|
| Party | Vote | % | |
| Conservative | 29,989 | 60.80 | |
| New Democratic | 9,032 | 18.31 | |
| Liberal | 7,839 | 15.89 | |
| Green | 2,460 | 4.99 | |
| 2011 Canadian federal election | ||||||||
|---|---|---|---|---|---|---|---|---|
| Party | Candidate | Votes | % | ±% | Expenditures | |||
| Conservative | Gordon Brown | 29,991 | 60.81 | +2.36 | $69,695 | |||
| New Democratic | Matthew Gabriel | 9,033 | 18.31 | +4.46 | $5,092 | |||
| Liberal | Marjory Loveys | 7,839 | 15.89 | -1.29 | $52,628 | |||
| Green | Mary Slade | 2,460 | 4.99 | -4.63 | $17,743 | |||
| Total valid votes/Expense limit | 49,323 | 100.00 | $145,158 | |||||
| Total rejected ballots | 156 | 0.32 | -0.08 | |||||
| Turnout | 49,479 | 64.42 | +1.56 | |||||
| Eligible voters | 76,802 | – | – | |||||
| Conservative hold | Swing | -1.05 | ||||||
| 2008 Canadian federal election | ||||||||
|---|---|---|---|---|---|---|---|---|
| Party | Candidate | Votes | % | ±% | Expenditures | |||
| Conservative | Gord Brown | 27,473 | 58.44 | +3.80 | $55,637 | |||
| Liberal | Marjory Loveys | 8,075 | 17.18 | -7.14 | $31,418 | |||
| New Democratic | Steve Armstrong | 6,511 | 13.85 | -1.41 | $6,532 | |||
| Green | Jeanie Warnock | 4,522 | 9.62 | +3.85 | $10,790 | |||
| Progressive Canadian | John McCrea | 426 | 0.91 | * | $291 | |||
| Total valid votes/Expense limit | 47,007 | 100.00 | $104,668 | |||||
| Rejected ballots | 186 | 0.39 | +0.09 | |||||
| Turnout | 47,193 | 62.86 | -7.65 | |||||
| Eligible voters | 75,075 | – | – | |||||
| Conservative hold | Swing | +5.47 | ||||||
| 2006 Canadian federal election | ||||||||
|---|---|---|---|---|---|---|---|---|
| Party | Candidate | Votes | % | ±% | Expenditures | |||
| Conservative | Gord Brown | 28,447 | 54.65 | +4.18 | $69,350 | |||
| Liberal | Bob Eaton | 12,661 | 24.32 | -8.61 | $28,806 | |||
| New Democratic | Steve Armstrong | 7,945 | 15.26 | +3.94 | $7,043 | |||
| Green | David Lee | 3,003 | 5.77 | +0.49 | $450 | |||
| Total valid votes | 52,056 | 100.00 | ||||||
| Rejected ballots | 159 | 0.30 | -0.06 | |||||
| Turnout | 52,215 | 70.51 | +0.13 | |||||
| Eligible voters | 74,055 | – | – | |||||
| Conservative hold | Swing | +6.39 | ||||||
| 2004 Canadian federal election | ||||||||
|---|---|---|---|---|---|---|---|---|
| Party | Candidate | Votes | % | ±% | Expenditures | |||
| Conservative | Gord Brown | 26,002 | 50.46 | -5.80 | $69,173 | |||
| Liberal | Joe Jordan | 16,967 | 32.93 | -6.58 | $60,373 | |||
| New Democratic | Steve Armstrong | 5,834 | 11.32 | +9.22 | $10,009 | |||
| Green | Chris Bradshaw | 2,722 | 5.28 | +3.55 | $532 | |||
| Total valid votes | 51,525 | 100.00 | ||||||
| Conservative notional hold | Swing | +0.39 | ||||||
Note: Conservative vote is compared to the total of the Canadian Alliance vote and Progressive Conservative vote in 2000 election.
| 2000 Canadian federal election | ||||||||
|---|---|---|---|---|---|---|---|---|
| Party | Candidate | Votes | % | ±% | Expenditures | |||
| Liberal | Joe Jordan | 18,594 | 39.51 | +0.04 | $52,586 | |||
| Alliance | Gord Brown | 18,539 | 39.39 | +17.77 | $61,645 | |||
| Progressive Conservative | John Johnston | 7,940 | 16.87 | -15.40 | $55,627 | |||
| New Democratic | Martin Hanratty | 990 | 2.10 | -1.52 | $1,764 | |||
| Green | Jerry Heath | 816 | 1.73 | -0.54 | $3,302 | |||
| Canadian Action | Jane Pamela Scharf | 181 | 0.38 | * | $0 | |||
| Total valid votes | 47,060 | 100.00 | ||||||
| Liberal hold | Swing | -8.86 | ||||||
Note: Canadian Alliance vote is compared to the Reform vote in 1997 election.
| 1997 Canadian federal election | ||||||||
|---|---|---|---|---|---|---|---|---|
| Party | Candidate | Votes | % | ±% | Expenditures | |||
| Liberal | Joe Jordan | 19,123 | 39.47 | -13.10 | $48,446 | |||
| Progressive Conservative | Sandra Lawn | 15,636 | 32.27 | +5.34 | $58,733 | |||
| Reform | Doug Aldridge | 10,476 | 21.62 | +5.65 | $18,190 | |||
| New Democratic | Jennifer Breakspear | 1,757 | 3.63 | +1.60 | $3,522 | |||
| Green | Peter Bevan-Baker | 1,102 | 2.27 | +1.21 | $1,427 | |||
| Christian Heritage | Donny F. Platt | 241 | 0.50 | * | $544 | |||
| Natural Law | Wayne Foster | 119 | 0.25 | -0.14 | $0 | |||
| Total valid votes | 48,454 | 100.00 | ||||||
| Liberal hold | Swing | -9.22 | ||||||
| 1993 Canadian federal election | ||||||||
|---|---|---|---|---|---|---|---|---|
| Party | Candidate | Votes | % | ±% | Expenditures | |||
| Liberal | Jim Jordan | 26,567 | 52.57 | +9.17 | $49,114 | |||
| Progressive Conservative | Sandra Lawn | 13,608 | 26.93 | -11.97 | $53,521 | |||
| Reform | Paul West | 8,071 | 15.97 | * | $8,164 | |||
| New Democratic | Mary Ann Greenwood | 1,026 | 2.03 | -9.05 | $6,686 | |||
| Green | Peter Bevan-Baker | 538 | 1.06 | * | $0 | |||
| National | Holly Baker | 474 | 0.94 | * | $490 | |||
| Natural Law | Richard Beecroft | 196 | 0.39 | * | $0 | |||
| Abolitionist | Christine Richardson | 59 | 0.12 | * | $200 | |||
| Total valid votes | 50,539 | 100.00 | ||||||
| Liberal hold | Swing | +10.57 | ||||||
| 1988 Canadian federal election | ||||||||
|---|---|---|---|---|---|---|---|---|
| Party | Candidate | Votes | % | ±% | ||||
| Liberal | Jim Jordan | 20,141 | 43.39 | +20.08 | ||||
| Progressive Conservative | Jennifer Cossitt | 18,053 | 38.89 | -22.60 | ||||
| New Democratic | Barry Grills | 5,141 | 11.08 | -2.89 | ||||
| Christian Heritage | David Butcher | 1,584 | 3.41 | |||||
| Confederation of Regions | Faye Garner | 1,497 | 3.23 | |||||
| Total valid votes | 46,416 | 100.00 | ||||||
| Liberal gain from Progressive Conservative | Swing | +20.08 | ||||||
| 1984 Canadian federal election | ||||||||
|---|---|---|---|---|---|---|---|---|
| Party | Candidate | Votes | % | ±% | ||||
| Progressive Conservative | Jennifer Cossitt | 26,961 | 61.50 | +10.28 | ||||
| Liberal | Chuck Anderson | 10,222 | 23.32 | -8.40 | ||||
| New Democratic | Jan Allen | 6,121 | 13.96 | -3.11 | ||||
| Green | Mike Nickerson | 348 | 0.79 | |||||
| Libertarian | Hans Wienhold | 190 | 0.43 | |||||
| Total valid votes | 43,842 | 100.00 | ||||||
| Progressive Conservative hold | Swing | +9.34 | ||||||
^ Change is from 1980
| Canadian federal by-election, 12 October 1982 | ||||||||
|---|---|---|---|---|---|---|---|---|
| Party | Candidate | Votes | % | ±% | ||||
| upon Tom Cossitt's death on 15 March 1982 | ||||||||
| Progressive Conservative | Jennifer Cossitt | 18,401 | 57.00 | +5.79 | ||||
| Liberal | Chuck Anderson | 6,693 | 20.73 | -10.98 | ||||
| Libertarian | Neil Reynolds | 4,337 | 13.44 | |||||
| New Democratic | Milred Smith | 2,751 | 8.52 | -8.55 | ||||
| Independent | Ray Turmel | 99 | 0.31 | |||||
| Total valid votes | 32,281 | 100.00 | ||||||
| Progressive Conservative hold | Swing | +8.38 | ||||||
| 1980 Canadian federal election | ||||||||
|---|---|---|---|---|---|---|---|---|
| Party | Candidate | Votes | % | ±% | ||||
| Progressive Conservative | Tom Cossitt | 19,800 | 51.22 | -5.59 | ||||
| Liberal | Gerry McKee | 12,260 | 31.71 | +3.94 | ||||
| New Democratic | Mildred Smith | 6,600 | 17.07 | +1.65 | ||||
| Total valid votes | 38,660 | 100.00 | ||||||
| Progressive Conservative hold | Swing | -4.76 | ||||||
| 1979 Canadian federal election | ||||||||
|---|---|---|---|---|---|---|---|---|
| Party | Candidate | Votes | % | |||||
| Progressive Conservative | Tom Cossitt | 24,127 | 56.80 | |||||
| Liberal | Gerry McKee | 11,797 | 27.77 | |||||
| New Democratic | Mildred Smith | 6,551 | 15.42 | |||||
| Total valid votes | 42,475 | 100.00 | ||||||
References
- "(Code 35041) Census Profile". 2011 census. Statistics Canada. 2012. Retrieved 3 March 2011.
Notes
- Statistics Canada: 2016
- "House Government Bill - Bill C-37 - Third Reading (41-2)".
- "Census Profile, 2016 Census - Leeds--Grenville--Thousand Islands and Rideau Lakes [Federal electoral district], Ontario and Ontario [Province]". www12.statcan.gc.ca. Retrieved 10 August 2019.
- "National Household Survey (NHS) Profile, 2011". www12.statcan.gc.ca. Retrieved 10 August 2019.
- "www.punditsguide.ca/riding.php?rid=1094". punditsguide.ca. Retrieved 10 August 2019.
- "List of confirmed candidates". Elections Canada. Retrieved 3 October 2019.
- "Election Night Results". Elections Canada. Retrieved 31 October 2019.
- "Voter Information Service - Who are the candidates in my electoral district?".
- "Elections Canada On-line - Élection Canada en-ligne". Archived from the original on 15 August 2015.
- Funke, Alice. "Leeds—Grenville—Thousand Islands and Rideau Lakes, ON (2013 Rep. Order)".
External links
- Federal riding history from the Library of Parliament
- 2011 Results from Elections Canada
- Leeds—Grenville profile at CBC News