Wellington—Halton Hills
Wellington—Halton Hills is a federal electoral district in Ontario, Canada, that has been represented in the House of Commons of Canada since 2004.
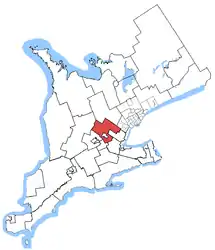
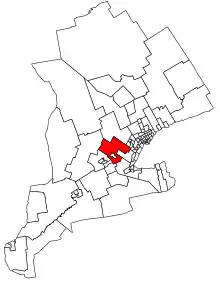 Wellington—Halton Hills in relation to other southern Ontario electoral districts | |||
| Federal electoral district | |||
| Legislature | House of Commons | ||
| MP |
Conservative | ||
| District created | 2003 | ||
| First contested | 2004 | ||
| Last contested | 2019 | ||
| District webpage | profile, map | ||
| Demographics | |||
| Population (2011)[1] | 115,880 | ||
| Electors (2015) | 88,674 | ||
| Area (km²)[2] | 1,584 | ||
| Pop. density (per km²) | 73.2 | ||
| Census division(s) | Wellington, Halton | ||
| Census subdivision(s) | Halton Hills, Centre Wellington, Guelph/Eramosa, Erin, Puslinch | ||
The Member of Parliament for Wellington—Halton Hills is Michael Chong of the Conservative Party of Canada.
The riding was created in 2003 from parts of Dufferin—Peel—Wellington—Grey, Guelph—Wellington, Halton and Waterloo—Wellington ridings.
It consists of the Town of Halton Hills in the Regional Municipality of Halton and the townships of Centre Wellington, Guelph/Eramosa and Puslinch and the Town of Erin in Wellington County. Although it is counted as part of Midwestern Ontario, it spills into Halton, which is part of the Greater Toronto Area.
This riding lost fractions of territory to Guelph and Kitchener—Conestoga during the 2012 electoral redistribution.
Members of Parliament
| Parliament | Years | Member | Party | |
|---|---|---|---|---|
| Wellington—Halton Hills Riding created from Dufferin—Peel—Wellington—Grey, Guelph—Wellington, Halton and Waterloo—Wellington |
||||
| 38th | 2004–2006 | Michael Chong | Conservative | |
| 39th | 2006–2008 | |||
| 40th | 2008–2011 | |||
| 41st | 2011–2015 | |||
| 42nd | 2015–2019 | |||
| 43rd | 2019–present | |||
Election results
| 2019 Canadian federal election | ||||||||
|---|---|---|---|---|---|---|---|---|
| Party | Candidate | Votes | % | ±% | Expenditures | |||
| Conservative | Michael Chong | 33,044 | 47.4 | -3.2 | $78,757.50 | |||
| Liberal | Lesley Barron | 19,777 | 28.4 | -8.18 | $70,168.78 | |||
| Green | Ralph Martin | 8,851 | 12.7 | 8.61 | none listed | |||
| New Democratic | Andrew Bascombe | 6,499 | 9.3 | 0.86 | none listed | |||
| People's | Syl Carle | 1,509 | 2.2 | - | $6,565.51 | |||
| Total valid votes/Expense limit | 69,680 | 100.0 | $122,383.64 | |||||
| Total rejected ballots | 359 | |||||||
| Turnout | 70,039 | 70.8 | ||||||
| Eligible voters | 98,901 | |||||||
| Source: Elections Canada[3][4][5] | ||||||||
| 2015 Canadian federal election | ||||||||
|---|---|---|---|---|---|---|---|---|
| Party | Candidate | Votes | % | ±% | Expenditures | |||
| Conservative | Michael Chong | 32,482 | 50.90 | -12.83 | $114,808.31 | |||
| Liberal | Don Trant | 23,279 | 36.48 | +20.16 | $82,917.29 | |||
| New Democratic | Anne Gajerski-Cauley | 5,321 | 8.34 | -4.66 | $11,740.16 | |||
| Green | Brent Allan Bouteiller | 2,547 | 3.99 | -2.41 | $2,190.90 | |||
| Canadian Action | Harvey Edward Anstey | 183 | 0.29 | -0.27 | $381.96 | |||
| Total valid votes/Expense limit | 63,812 | 100.00 | $230,272.85 | |||||
| Total rejected ballots | 185 | 0.28 | – | |||||
| Turnout | 63,977 | 71.36 | +4.09 | |||||
| Eligible voters | 89,653 | |||||||
| Conservative hold | Swing | -16.5 | ||||||
| Source: Elections Canada[6][7] | ||||||||
| 2011 federal election redistributed results[8] | |||
|---|---|---|---|
| Party | Vote | % | |
| Conservative | 35,023 | 63.73 | |
| Liberal | 8,979 | 16.34 | |
| New Democratic | 7,120 | 12.96 | |
| Green | 3,518 | 6.40 | |
| Others | 315 | 0.57 | |
| 2011 Canadian federal election | ||||||||
|---|---|---|---|---|---|---|---|---|
| Party | Candidate | Votes | % | ±% | Expenditures | |||
| Conservative | Michael Chong | 35,132 | 63.70 | +6.07 | – | |||
| Liberal | Barry Peters | 9,034 | 16.38 | -5.95 | – | |||
| New Democratic | Anastasia Zavarella | 7,146 | 12.96 | +3.59 | – | |||
| Green | Brent Bouteiller | 3,527 | 6.37 | -3.47 | 9,592.53 | |||
| Christian Heritage | Jeffrey Streutker | 316 | 0.57 | -0.24 | – | |||
| Total valid votes/Expense limit | 55,155 | 100.00 | $89,278.64 | |||||
| Total rejected ballots | 154 | 0.28 | – | |||||
| Turnout | 55,309 | 67.27 | – | |||||
| Eligible voters | 82,215 | – | – | |||||
| Conservative hold | Swing | +6.01 | ||||||
| 2008 Canadian federal election | ||||||||
|---|---|---|---|---|---|---|---|---|
| Party | Candidate | Votes | % | ±% | Expenditures | |||
| Conservative | Michael Chong | 29,191 | 57.63 | +6.97 | $67,429 | |||
| Liberal | Bruce Bowser | 11,312 | 22.33 | -6.83 | $71,000 | |||
| Green | Brent Bouteiller | 4,987 | 9.84 | +3.74 | $1,497 | |||
| New Democratic | Noel Duignan | 4,747 | 9.37 | -2.94 | $800 | |||
| Christian Heritage | Jeffrey Streutker | 414 | 0.81 | -0.29 | $416 | |||
| Total valid votes/Expense limit | 50,651 | 100.00 | $85,604 | |||||
| Conservative hold | Swing | +6.9 | ||||||
| 2006 Canadian federal election | ||||||||
|---|---|---|---|---|---|---|---|---|
| Party | Candidate | Votes | % | ±% | Expenditures | |||
| Conservative | Michael Chong | 27,907 | 50.75 | +7.95 | $73,993 | |||
| Liberal | Rod Finnie | 16,065 | 29.22 | -8.99 | $55,605 | |||
| New Democratic | Noel Duignan | 6,785 | 12.34 | +0.43 | $5,496 | |||
| Green | Brent Bouteiller | 3,362 | 6.11 | +0.68 | $1,102 | |||
| Christian Heritage | Carol Ann Krusky | 606 | 1.10 | -0.54 | $4,944 | |||
| Independent | Mike Wisniewski | 355 | 0.65 | – | $1,174 | |||
| Total valid votes | 54,987 | 100.00 | $78,546 | |||||
| Conservative hold | Swing | +8.47 | ||||||
| 2004 Canadian federal election | ||||||||
|---|---|---|---|---|---|---|---|---|
| Party | Candidate | Votes | % | ±% | Expenditures | |||
| Conservative | Michael Chong | 21,479 | 42.81 | – | $64,026 | |||
| Liberal | Bruce Hood | 19,173 | 38.21 | – | $73,831 | |||
| New Democratic | Noel Duignan | 5,974 | 11.91 | – | $13,594 | |||
| Green | Brent Bouteiller | 2,725 | 5.43 | – | $799 | |||
| Christian Heritage | Pat Woode | 826 | 1.65 | – | $2,304 | |||
| Total valid votes | 50,177 | 100.00 | $75,799 | |||||
| Conservative hold | Swing | +6.01 | ||||||
References
- "(Code 35098) Census Profile". 2011 census. Statistics Canada. 2012. Retrieved 2011-03-03.
- Riding history from the Library of Parliament
- 2011 results from Elections Canada
- Campaign expense data from Elections Canada
Notes
- Statistics Canada: 2012
- Statistics Canada: 2012
- "List of confirmed candidates". Elections Canada. Retrieved October 4, 2019.
- "Election Night Results". Elections Canada. Retrieved November 1, 2019.
- "Final Expenses Limits for Candidates". Elections Canada. Retrieved December 15, 2020.
- Elections Canada – Confirmed candidates for Wellington—Halton Hills, 30 September 2015
- Elections Canada – Preliminary Election Expenses Limits for Candidates
- Pundits' Guide to Canadian Elections