Renfrew—Nipissing—Pembroke
Renfrew—Nipissing—Pembroke is a federal electoral district in Ontario, Canada, that has been represented in the House of Commons since 1979.
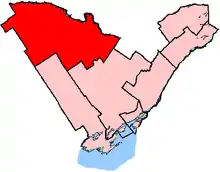 Renfrew—Nipissing—Pembroke shown within the Eastern Ontario region (2003 boundaries) | |||
| Federal electoral district | |||
| Legislature | House of Commons | ||
| MP |
Conservative | ||
| District created | 1976 | ||
| First contested | 1979 | ||
| Last contested | 2019 | ||
| District webpage | profile, map | ||
| Demographics | |||
| Population (2011)[1] | 102,537 | ||
| Electors (2015) | 77,520 | ||
| Area (km²)[2] | 11,452.85 | ||
| Pop. density (per km²) | 9 | ||
| Census division(s) | Nipissing, Renfrew | ||
| Census subdivision(s) | Arnprior, Bonnechere Valley, Deep River, Laurentian Valley, Madawaska Valley, McNab/Braeside, Pembroke, Petawawa, Renfrew, Whitewater Region | ||
It is represented by Cheryl Gallant of the Conservative Party.
Renfrew—Nipissing—Pembroke includes all of Renfrew County and a small section of Nipissing District around Algonquin Provincial Park.
The largest community in the riding is the city of Pembroke; other communities include Arnprior, Barry's Bay, Chalk River, Cobden, Deep River, Eganville, Killaloe, Petawawa and Renfrew.
The riding was a Liberal stronghold both federally and provincially for over half a century; however, a growing religious and agricultural population has turned this district into one of the most conservative areas of Ontario.
Geography
It consists of
- the County of Renfrew; and
- the part of the Territorial District of Nipissing lying south and east of and including the townships of Deacon, Lister, Anglin, Dickson, Preston and Airy.
Political geography
Most of the riding was fairly Conservative from 2004 -2015. In the 2004, 2006, 2008, and 2011 elections, Deep River was the only significant community which voted Liberal. Pikwakanagan, a First Nations reserve, also voted Liberal, and the Township of Wylie had a tie vote. A small handful of polls in Pembroke voted Liberal, but most of the city voted Conservative.
These demographics changed by the 2015 Federal Election, which saw the Liberals hold onto Pikwakanagan and Deep River, and gain most of the polls in Pembroke, Petawawa, and Eganville along with a number in Arnprior, and Renfrew although most of the rural districts voted Conservative.
Demographics
- According to the Canada 2011 Census[3]
Ethnic groups: 88.4% White, 9.6% Indigenous, 2.0% Other
Languages: 90.8% English, 4.9% French, 1.1% German, 1.0% Polish, 2.2% Other
Religions: 79.5% Christian, 0.9% Other, 19.6% None
Median income: $29,847 (2010)
Average income: $37,113 (2010)
History
Renfrew—Nipissing—Pembroke was created in 1976 from parts of Frontenac—Lennox and Addington, Lanark—Renfrew—Carleton and Renfrew North—Nipissing East ridings.
It consisted of the County of Renfrew, excluding the Townships of Bagot and Blythfield and McNab, and the part of the Territorial District of Nipissing including and lying easterly of the Townships of Mattawan, Papineau, Cameron, Deacon, Anglin, Dickson, Preston, Airy and Sabine.
The electoral district was abolished in 1987 when it was redistributed into Renfrew riding. In 1989, Renfrew riding was renamed "Renfrew—Nipissing—Pembroke".
The new riding consisted of the County of Renfrew, and the part of the Territorial District of Nipissing lying east of and including the townships of Deacon and Lister, and east of but excluding the townships of Freswick, Bower and Sproule, and east of and including the townships of Airy and Sabine.
In 1996, the Nipissing part was redefined as being the part of the district lying east of and including the townships of Deacon and Lister, east of and excluding the townships of Freswick, Bower, Sproule and Nightingale, and east of and including the Township of Sabine.
In 2003, it was given its current boundaries as described above.
This riding was unchanged during the 2012 electoral redistribution.
Members of Parliament
This riding has elected the following Members of Parliament:
| Parliament | Years | Member | Party | |
|---|---|---|---|---|
| Renfrew—Nipissing—Pembroke Riding created from Frontenac—Lennox and Addington, Lanark—Renfrew—Carleton and Renfrew North—Nipissing East |
||||
| 31st | 1979–1980 | Len Hopkins | Liberal | |
| 32nd | 1980–1984 | |||
| 33rd | 1984–1988 | |||
| Renfrew | ||||
| 34th | 1988–1989 | Len Hopkins | Liberal | |
| Renfrew—Nipissing—Pembroke | ||||
| 34th | 1989–1993 | Len Hopkins | Liberal | |
| 35th | 1993–1997 | |||
| 36th | 1997–2000 | Hec Clouthier | ||
| 37th | 2000–2003 | Cheryl Gallant | Alliance | |
| 2003–2004 | Conservative | |||
| 38th | 2004–2006 | |||
| 39th | 2006–2008 | |||
| 40th | 2008–2011 | |||
| 41st | 2011–2015 | |||
| 42nd | 2015–2019 | |||
| 43rd | 2019–present | |||
Election results
Renfrew—Nipissing—Pembroke, 1993 – present
| 2019 Canadian federal election | ||||||||
|---|---|---|---|---|---|---|---|---|
| Party | Candidate | Votes | % | ±% | Expenditures | |||
| Conservative | Cheryl Gallant | 31,080 | 52.6 | $66,041.60 | ||||
| Liberal | Ruben Marini | 11,532 | 19.6 | $45,587.70 | ||||
| New Democratic | Eileen Jones-Whyte | 8,786 | 14.9 | $16,662.56 | ||||
| Green | Ian Pineau | 3,230 | 5.5 | $3,432.43 | ||||
| People's | David Ainsworth | 1,463 | 2.5 | none listed | ||||
| Independent | Dan Criger | 1,125 | 1.9 | $9,173.74 | ||||
| Independent | Dheerendra Kumar | 917 | 1.6 | none listed | ||||
| Veterans Coalition | Robert Cherrin | 358 | 0.6 | none listed | ||||
| Libertarian | Stefan Klietsch | 266 | 0.5 | none listed | ||||
| Independent | Jonathan Davis | 200 | 0.3 | none listed | ||||
| Total valid votes/Expense limit | 58,957 | 100.0 | ||||||
| Total rejected ballots | 471 | |||||||
| Turnout | 59,428 | 69.1 | ||||||
| Eligible voters | 86,010 | |||||||
| Source: Elections Canada[4][5] | ||||||||
| 2015 Canadian federal election | ||||||||
|---|---|---|---|---|---|---|---|---|
| Party | Candidate | Votes | % | ±% | Expenditures | |||
| Conservative | Cheryl Gallant | 26,195 | 45.83 | -7.60 | $57,534.69 | |||
| Liberal | Jeff Lehoux | 18,666 | 32.66 | +19.93 | $52,131.48 | |||
| Independent | Hec Clouthier | 6,300 | 11.02 | -7.68 | $64,551.59 | |||
| New Democratic | Dan McCarthy | 4,893 | 8.56 | -4.87 | $29,224.75 | |||
| Green | Stefan Klietsch | 1,105 | 1.93 | +0.22 | $3,045.10 | |||
| Total valid votes/Expense limit | 57,159 | 100.0 | – | $223,209.96 | ||||
| Total rejected ballots | 264 | – | – | |||||
| Turnout | 57,423 | 73.5 | +6.61 | |||||
| Eligible voters | 78,080 | |||||||
| Conservative hold | Swing | -13.8 | ||||||
| Source: Elections Canada[6][7] | ||||||||
| 2011 Canadian federal election | ||||||||
|---|---|---|---|---|---|---|---|---|
| Party | Candidate | Votes | % | ±% | Expenditures | |||
| Conservative | Cheryl Gallant | 27,462 | 53.43 | -7.66 | – | |||
| Independent | Hec Clouthier | 9,611 | 18.70 | – | – | |||
| New Democratic | Eric Burton | 6,903 | 13.43 | +2.50 | – | |||
| Liberal | Christine Tabbert | 6,545 | 12.73 | -7.84 | – | |||
| Green | Rosanne Van Schie | 877 | 1.71 | -5.05 | – | |||
| Total valid votes/Expense limit | 51,398 | 100.00 | – | |||||
| Total rejected ballots | 166 | 0.32 | -0.08 | |||||
| Turnout | 51,564 | 66.89 | +3.74 | |||||
| Eligible voters | 77,082 | – | – | |||||
| 2008 Canadian federal election | ||||||||
|---|---|---|---|---|---|---|---|---|
| Party | Candidate | Votes | % | ±% | Expenditures | |||
| Conservative | Cheryl Gallant | 28,908 | 61.09 | +3.4 | $56,541 | |||
| Liberal | Carole Devine | 9,737 | 20.57 | -3.5 | $67,673 | |||
| New Democratic | Sue McSheffrey | 5,175 | 10.93 | -1.6 | $31,328 | |||
| Green | Ben Hoffman | 3,201 | 6.76 | +5.7 | $7,564 | |||
| Independent | Denis Gagné | 293 | 0.61 | – | – | |||
| Total valid votes/Expense limit | 47,314 | 100.0 | $87,348 | |||||
| Total rejected ballots | 188 | 0.4 | – | |||||
| Turnout | 47,502 | 63.15 | – | |||||
| 2006 Canadian federal election | ||||||||
|---|---|---|---|---|---|---|---|---|
| Party | Candidate | Votes | % | ±% | ||||
| Conservative | Cheryl Gallant | 29,992 | 57.7 | +2.6 | ||||
| Liberal | Don Lindsay | 12,551 | 24.1 | -5.5 | ||||
| New Democratic | Sue McSheffrey | 6,505 | 12.5 | +1.0 | ||||
| Green | Gordon S. McLeod | 1,601 | 3.1 | +0.7 | ||||
| Independent | Paul Kelly | 1,338 | 2.6 | * | ||||
| Total valid votes | 51,987 | 100.0 | ||||||
| 2004 Canadian federal election | ||||||||
|---|---|---|---|---|---|---|---|---|
| Party | Candidate | Votes | % | ±% | ||||
| Conservative | Cheryl Gallant | 27,494 | 55.1 | -0.4 | ||||
| Liberal | Rob Jamieson | 14,798 | 29.6 | -9.4 | ||||
| New Democratic | Sue McSheffrey | 5,720 | 11.5 | +8.0 | ||||
| Green | Gordon S. McLeod | 1,191 | 2.4 | |||||
| Marijuana | Stanley Sambey | 714 | 1.4 | -0.2 | ||||
| Total valid votes | 49,917 | 100.0 | ||||||
Note: Conservative vote is compared to the total of the Canadian Alliance vote and Progressive Conservative vote in 2000 election.
| 2000 Canadian federal election | ||||||||
|---|---|---|---|---|---|---|---|---|
| Party | Candidate | Votes | % | ±% | ||||
| Alliance | Cheryl Gallant | 20,634 | 44.2 | +17.4 | ||||
| Liberal | Hec Clouthier | 18,211 | 39.0 | -1.3 | ||||
| Progressive Conservative | Bob Amaron | 5,287 | 11.3 | -14.1 | ||||
| New Democratic | Ole Hendrickson | 1,607 | 3.4 | -3.2 | ||||
| Marijuana | Stanley E. Sambey | 762 | 1.6 | |||||
| Independent | Thane C. Heins | 121 | 0.3 | * | ||||
| Natural Law | André Giordano | 78 | 0.2 | -0.2 | ||||
| Total valid votes | 46,700 | 100.0 | ||||||
Note: Canadian Alliance vote is compared to the Reform vote in 1997 election.
| 1997 Canadian federal election | ||||||||
|---|---|---|---|---|---|---|---|---|
| Party | Candidate | Votes | % | ±% | ||||
| Liberal | Hec Clouthier | 19,569 | 40.3 | -10.3 | ||||
| Reform | Ed Pinnell | 13,035 | 26.8 | +14.6 | ||||
| Progressive Conservative | Bob Gould | 12,352 | 25.4 | +11.6 | ||||
| New Democratic | Barbara Clarke | 3,242 | 6.7 | +4.0 | ||||
| Canadian Action | Gay Curran-Desmond | 236 | 0.5 | |||||
| Natural Law | André Giordano | 183 | 0.4 | +0.1 | ||||
| Total valid votes | 48,617 | 100.0 | ||||||
| 1993 Canadian federal election | ||||||||
|---|---|---|---|---|---|---|---|---|
| Party | Candidate | Votes | % | ±% | ||||
| Liberal | Len Hopkins | 25,725 | 50.5 | -3.8 | ||||
| Independent | Hec Clouthier | 10,287 | 20.2 | |||||
| Progressive Conservative | Milton Stevenson | 7,039 | 13.8 | -18.2 | ||||
| Reform | Edward Pinnell | 6,209 | 12.2 | |||||
| New Democratic | Barbara Clarke | 1,345 | 2.6 | -9.9 | ||||
| Abolitionist | Murray Reid | 145 | 0.3 | |||||
| Natural Law | Daphne Quance | 143 | 0.3 | |||||
| Total valid votes | 50,893 | 100.0 | ||||||
Renfrew, 1988 – 1993
| 1988 Canadian federal election | ||||||||
|---|---|---|---|---|---|---|---|---|
| Party | Candidate | Votes | % | ±% | ||||
| Liberal | Len Hopkins | 25,558 | 54.3 | +9.2 | ||||
| Progressive Conservative | Ben Hoffman | 15,081 | 32.1 | -13.0 | ||||
| New Democratic | Elizabeth Ives-Ruyter | 5,879 | 12.5 | +2.7 | ||||
| Confederation of Regions | Murray Reid | 520 | 1.1 | |||||
| Total valid votes | 47,038 | 100.0 | ||||||
Renfrew—Nipissing—Pembroke, 1979 – 1988
| 1984 Canadian federal election | ||||||||
|---|---|---|---|---|---|---|---|---|
| Party | Candidate | Votes | % | ±% | ||||
| Liberal | Len Hopkins | 19,502 | 45.1 | -6.6 | ||||
| Progressive Conservative | Don Whillans | 19,464 | 45.0 | +12.4 | ||||
| New Democratic | Gavin Murphy | 4,253 | 9.8 | -5.8 | ||||
| Total valid votes | 43,219 | 100.0 | ||||||
| 1980 Canadian federal election | ||||||||
|---|---|---|---|---|---|---|---|---|
| Party | Candidate | Votes | % | ±% | ||||
| Liberal | Len Hopkins | 20,529 | 51.7 | +2.5 | ||||
| Progressive Conservative | Bob Amaron | 12,966 | 32.7 | -0.8 | ||||
| New Democratic | Don Breault | 6,200 | 15.6 | -1.7 | ||||
| Total valid votes | 39,695 | 100.0 | ||||||
| 1979 Canadian federal election | ||||||||
|---|---|---|---|---|---|---|---|---|
| Party | Candidate | Votes | % | |||||
| Liberal | Len Hopkins | 20,286 | 49.2 | |||||
| Progressive Conservative | Don Sutherland | 13,781 | 33.4 | |||||
| New Democratic | Don Breault | 7,133 | 17.3 | |||||
| Total valid votes | 41,200 | 100.0 | ||||||
References
- "(Code 35074) Census Profile". 2011 census. Statistics Canada. 2012. Retrieved 2011-03-03.
- RENFREW--NIPISSING--PEMBROKE, Ontario (1976 - 1987) Riding history from the Library of Parliament
- RENFREW, Ontario (1987 - 1989) Riding history from the Library of Parliament
- RENFREW--NIPISSING--PEMBROKE, Ontario (1989 - 2008) Riding history from the Library of Parliament
- [Renfrew—Nipissing—Pembroke 2011 results from Elections Canada]
- Campaign expense data from Elections Canada
Notes
- Statistics Canada: 2011
- Statistics Canada: 2011
- http://www12.statcan.gc.ca/nhs-enm/2011/dp-pd/prof/details/page.cfm?Lang=E&Geo1=FED2013&Code1=35086&Data=Count&SearchText=renfrew&SearchType=Begins&SearchPR=01&A1=All&B1=All&Custom=&TABID=1
- "List of confirmed candidates". Elections Canada. Retrieved October 3, 2019.
- "Election Night Results". Elections Canada. Retrieved October 31, 2019.
- Elections Canada – Confirmed candidates for Renfrew—Nipissing—Pembroke, 30 September 2015
- Elections Canada – Preliminary Election Expenses Limits for Candidates