Thunder Bay—Superior North
Thunder Bay—Superior North (French: Thunder Bay—Supérieur-Nord; formerly known as Thunder Bay—Nipigon) is a federal electoral district in Ontario, Canada, that has been represented in the House of Commons of Canada since 1976.
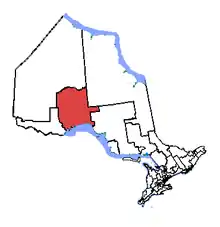 Thunder Bay—Superior North in relation to other northern Ontario electoral districts | |||
| Federal electoral district | |||
| Legislature | House of Commons | ||
| MP |
Liberal | ||
| District created | 1976 | ||
| First contested | 1976 | ||
| Last contested | 2019 | ||
| District webpage | profile, map | ||
| Demographics | |||
| Population (2019)[1] | 82,651 | ||
| Electors (2019)[2] | 66,579 | ||
| Area (km²)[3] | 87,965 | ||
| Pop. density (per km²) | 0.94 | ||
| Census division(s) | Thunder Bay District | ||
| Census subdivision(s) | Thunder Bay, Greenstone, Marathon, Shuniah | ||
It is in the northwestern part of the province of Ontario. It was created in 1976 as "Thunder Bay—Nipigon" from parts of Port Arthur and Thunder Bay ridings. It was renamed "Thunder Bay—Superior North" in 1998.
It consists of the eastern part of the Territorial District of Thunder Bay including the northern part of the city of Thunder Bay, Ontario.
13.7% of the population of the riding are of Finnish ethnic origin, the highest such percentage in Canada.[4]
This riding lost a fraction of territory to Thunder Bay—Rainy River and gained territory from Algoma—Manitoulin—Kapuskasing during the 2012 electoral redistribution.
Geography
Thunder Bay—Superior North consists of the part of the Territorial District of Thunder Bay
- lying east of a line drawn from the northern limit the territorial district due south to the northeast corner of the Township of Bulmer, and south along the eastern boundaries of the townships of Bulmer, Fletcher, Furlonge, McLaurin and Bertrand, east along the 6th Base Line, south along longitude 90o00( W, Dog River and the western shoreline of Dog Lake, west, along the north, west and south boundaries of the Township of Fowler, south along the Kaministiquia River, east along the northern limit of the Township of Oliver Paipoonge, south along its eastern limit and along Pole Line Road, north along Thunder Bay Expressway (Highways 11 and 17), east along Harbour Expressway and Main Street to 110th Avenue, then due east to the eastern limit of the City of Thunder Bay, along that limit to the northeast corner of the Township of Neebing, then southeast to the US border; and
- excluding the part lying south and east of a line drawn from the southwest corner of the Township of Downer due west to a line drawn due south from the southeast corner of the Township of Bain, due south to a line drawn due west from the southwest corner of the Township of McGill, due east to longitude 86o00( W, south along that longitude, and west along the White River to Lake Superior.
Members of Parliament
This riding has elected the following Members of Parliament:
| Parliament | Years | Member | Party | |
|---|---|---|---|---|
| Thunder Bay—Nipigon Riding created from Port Arthur and Thunder Bay |
||||
| 31st | 1979–1980 | Bob Andras | Liberal | |
| 32nd | 1980–1984 | Jack Masters | ||
| 33rd | 1984–1988 | Ernie Epp | New Democratic | |
| 34th | 1988–1993 | Joe Comuzzi | Liberal | |
| 35th | 1993–1997 | |||
| Thunder Bay—Superior North | ||||
| 36th | 1997–2000 | Joe Comuzzi | Liberal | |
| 37th | 2000–2004 | |||
| 38th | 2004–2006 | |||
| 39th | 2006–2007 | |||
| 2007–2007 | Independent | |||
| 2007–2008 | Conservative | |||
| 40th | 2008–2011 | Bruce Hyer | New Democratic | |
| 41st | 2011–2012 | |||
| 2012–2013 | Independent | |||
| 2013–2015 | Green | |||
| 42nd | 2015–2019 | Patty Hajdu | Liberal | |
| 43rd | 2019–present | |||
Election results
Thunder Bay—Superior North
| 2019 Canadian federal election | ||||||||
|---|---|---|---|---|---|---|---|---|
| Party | Candidate | Votes | % | ±% | Expenditures | |||
| Liberal | Patty Hajdu | 18,502 | 42.9 | -2.09 | $94,089.37 | |||
| Conservative | Frank Pullia | 11,036 | 25.6 | +8.17 | $33,102.79 | |||
| New Democratic | Anna Betty Achneepineskum | 9,126 | 21.1 | -2.08 | $42,426.79 | |||
| Green | Bruce Hyer | 3,639 | 8.4 | -5.40 | none listed | |||
| People's | Youssef Khanjari | 734 | 1.7 | – | $5,389.00 | |||
| Libertarian | Alexander Vodden | 140 | 0.3 | – | $1,783.16 | |||
| Total valid votes/Expense limit | 43,177 | 100.0 | ||||||
| Total rejected ballots | 416 | |||||||
| Turnout | 43,593 | 66.1 | ||||||
| Eligible voters | 65,928 | |||||||
| Liberal hold | Swing | -5.13 | ||||||
| Source: Elections Canada[5][6] | ||||||||
| 2015 Canadian federal election | ||||||||
|---|---|---|---|---|---|---|---|---|
| Party | Candidate | Votes | % | ±% | Expenditures | |||
| Liberal | Patty Hajdu | 20,069 | 44.99 | +28.51 | $90,854.71 | |||
| New Democratic | Andrew Foulds | 10,339 | 23.18 | -26.97 | $121,837.34 | |||
| Conservative | Richard Harvey | 7,775 | 17.43 | -12.22 | $59,457.39 | |||
| Green | Bruce Hyer | 6,155 | 13.80 | +10.78 | $123,098.51 | |||
| Independent | Robert Skaf | 270 | 0.61 | – | $6,944.34 | |||
| Total valid votes/Expense limit | 44,608 | 100.0 | $248,538.44 | |||||
| Total rejected ballots | 178 | |||||||
| Turnout | 44,786 | 70.0 | ||||||
| Eligible voters | 63,995 | |||||||
| Liberal gain from New Democratic | Swing | +27.74 | ||||||
| Source: Elections Canada[7][8][9] | ||||||||
| 2011 federal election redistributed results[10] | |||
|---|---|---|---|
| Party | Vote | % | |
| New Democratic | 18,881 | 50.15 | |
| Conservative | 11,163 | 29.65 | |
| Liberal | 6,203 | 16.48 | |
| Green | 1,137 | 3.02 | |
| Others | 264 | 0.70 | |
| 2011 Canadian federal election | ||||||||
|---|---|---|---|---|---|---|---|---|
| Party | Candidate | Votes | % | ±% | Expenditures | |||
| New Democratic | Bruce Hyer | 18,334 | 49.9 | +12.9 | $89,828.18 | |||
| Conservative | Richard Harvey | 10,894 | 29.7 | +2.9 | $74,902.87 | |||
| Liberal | Yves Fricot | 6,117 | 16.7 | -11.8 | $75,441.94 | |||
| Green | Scot Kyle | 1,115 | 3.0 | -3.9 | $1,186.13 | |||
| Marijuana | Denis Andrew Carrière | 265 | 0.7 | -0.2 | – | |||
| Total valid votes/Expense limit | 36,725 | 100.0 | ||||||
| Total rejected ballots | 156 | 0. | – | |||||
| Turnout | 36,881 | – | – | |||||
| Eligible voters | 60,879 | – | – | |||||
| New Democratic hold | Swing | |||||||
| 2008 Canadian federal election | ||||||||
|---|---|---|---|---|---|---|---|---|
| Party | Candidate | Votes | % | ±% | Expenditures | |||
| New Democratic | Bruce Hyer | 13,187 | 37.0 | +2.1 | $85,186 | |||
| Liberal | Don McArthur | 10,083 | 28.3 | -7.7 | $74,762 | |||
| Conservative | Bev Sarafin | 9,556 | 26.8 | +4.7 | $56,069 | |||
| Green | Brendan Hughes | 2,463 | 6.9 | +1.1 | $10,885 | |||
| Marijuana | Denis Andrew Carrière | 327 | 0.9 | -0.4 | ||||
| Total valid votes/Expense limit | 35,616 | 100.0 | $98,240 | |||||
| New Democratic gain | Swing | |||||||
| 2006 Canadian federal election | ||||||||
|---|---|---|---|---|---|---|---|---|
| Party | Candidate | Votes | % | ±% | ||||
| Liberal | Joe Comuzzi | 13,983 | 36.0 | -7.0 | ||||
| New Democratic | Bruce Hyer | 13,575 | 34.9 | +5.6 | ||||
| Conservative | Bev Sarafin | 8,575 | 22.1 | +0.9 | ||||
| Green | Dawn Kannegiesser | 2,241 | 5.8 | +1.2 | ||||
| Marijuana | Denis A. Carrière | 487 | 1.3 | -0.5 | ||||
| Total valid votes | 38,861 | 100.0 | ||||||
| Liberal hold | Swing | |||||||
| 2004 Canadian federal election | ||||||||
|---|---|---|---|---|---|---|---|---|
| Party | Candidate | Votes | % | ±% | ||||
| Liberal | Joe Comuzzi | 15,022 | 43.0 | -5.1 | ||||
| New Democratic | Bruce Hyer | 10,230 | 29.3 | +9.8 | ||||
| Conservative | Bev Sarafin | 7,394 | 21.2 | -7.3 | ||||
| Green | Carl Rose | 1,614 | 4.6 | +2.6 | ||||
| Marijuana | Denis A. Carrière | 645 | 1.8 | 0.0 | ||||
| Total valid votes | 34,905 | 100.0 | ||||||
| Liberal hold | Swing | |||||||
Note: Conservative vote is compared to the total of the Canadian Alliance vote and Progressive Conservative vote in 2000 election.
| 2000 Canadian federal election | ||||||||
|---|---|---|---|---|---|---|---|---|
| Party | Candidate | Votes | % | ±% | ||||
| Liberal | Joe Comuzzi | 15,241 | 48.1 | -3.7 | ||||
| Alliance | Doug Pantry | 6,278 | 19.8 | +3.5 | ||||
| New Democratic | John Rafferty | 6,169 | 19.5 | -1.3 | ||||
| Progressive Conservative | Richard Neumann | 2,753 | 8.7 | -2.4 | ||||
| Green | Carl Rose | 648 | 2.0 | |||||
| Marijuana | Denis A. Carrière | 581 | 1.8 | |||||
| Total valid votes | 31,670 | 100.0 | ||||||
| Liberal hold | Swing | |||||||
Note: Canadian Alliance vote is compared to the Reform vote in 1997 election.
Thunder Bay—Nipigon
| 1997 Canadian federal election | ||||||||
|---|---|---|---|---|---|---|---|---|
| Party | Candidate | Votes | % | ±% | ||||
| Liberal | Joe Comuzzi | 16,745 | 51.8 | -13.2 | ||||
| New Democratic | Chris Mather | 6,705 | 20.8 | +11.7 | ||||
| Reform | Doug Pantry | 5,286 | 16.4 | +1.4 | ||||
| Progressive Conservative | Doug Guinn | 3,569 | 11.0 | +1.5 | ||||
| Total valid votes | 32,305 | 100.0 | ||||||
| 1993 Canadian federal election | ||||||||
|---|---|---|---|---|---|---|---|---|
| Party | Candidate | Votes | % | ±% | ||||
| Liberal | Joe Comuzzi | 24,249 | 65.1 | +24.8 | ||||
| Reform | Bob Reynolds | 5,567 | 14.9 | |||||
| Progressive Conservative | Marlene Hogarth | 3,567 | 9.6 | -16.1 | ||||
| New Democratic | David James Ramsay | 3,363 | 9.0 | -25.1 | ||||
| National | Wayne Hill | 439 | 1.2 | |||||
| Commonwealth of Canada | Brian Aalto | 80 | 0.2 | |||||
| Total valid votes | 37,265 | 100.0 | ||||||
| 1988 Canadian federal election | ||||||||
|---|---|---|---|---|---|---|---|---|
| Party | Candidate | Votes | % | ±% | ||||
| Liberal | Joe Comuzzi | 15,346 | 40.2 | +6.2 | ||||
| New Democratic | Ernie Epp | 13,019 | 34.1 | -3.0 | ||||
| Progressive Conservative | Fred Stille | 9,782 | 25.6 | -2.7 | ||||
| Total valid votes | 38,147 | 100.0 | ||||||
| 1984 Canadian federal election | ||||||||
|---|---|---|---|---|---|---|---|---|
| Party | Candidate | Votes | % | ±% | ||||
| New Democratic | Ernie Epp | 13,901 | 37.2 | +0.7 | ||||
| Liberal | Jack Masters | 12,736 | 34.0 | -12.6 | ||||
| Progressive Conservative | Jim Simpson | 10,601 | 28.3 | +11.8 | ||||
| Libertarian | Sally Hayes | 180 | 0.5 | |||||
| Total valid votes | 37,418 | 100.0 | ||||||
| 1980 Canadian federal election | ||||||||
|---|---|---|---|---|---|---|---|---|
| Party | Candidate | Votes | % | ±% | ||||
| Liberal | Jack Masters | 16,582 | 46.6 | +1.7 | ||||
| New Democratic | Bruce McKay | 12,950 | 36.4 | +4.1 | ||||
| Progressive Conservative | Rene Larson | 5,865 | 16.5 | -5.7 | ||||
| Communist | Walter E. Rogers | 109 | 0.3 | -0.2 | ||||
| Marxist–Leninist | Dennis Deveau | 68 | 0.2 | +0.1 | ||||
| Total valid votes | 35,574 | 100.0 | ||||||
| 1979 Canadian federal election | ||||||||
|---|---|---|---|---|---|---|---|---|
| Party | Candidate | Votes | % | |||||
| Liberal | Bob Andras | 15,674 | 44.9 | |||||
| New Democratic | Bruce McKay | 11,288 | 32.3 | |||||
| Progressive Conservative | Robert R. Lingman | 7,749 | 22.2 | |||||
| Communist | Nancy McDonald | 174 | 0.5 | |||||
| Marxist–Leninist | Dianne Robinson | 50 | 0.1 | |||||
| Total valid votes | 34,935 | 100.0 | ||||||
References
- "(Code 35091) Census Profile". 2011 census. Statistics Canada. 2012. Retrieved 2011-03-03.
Notes
- https://www.elections.ca/Scripts/vis/EDInfo?L=e&ED=35106&EV=99&EV_TYPE=6&PC=P7G2N9&PROV=ON&PROVID=35&QID=-1&PAGEID=21
- https://www.elections.ca/Scripts/vis/EDInfo?L=e&ED=35106&EV=99&EV_TYPE=6&PC=P7G2N9&PROV=ON&PROVID=35&QID=-1&PAGEID=21
- Statistics Canada: 2012
- "2Profile of Ethnic Origin and Visible Minorities for Canada, Provinces, Territories and Federal Electoral Districts (2003 Representation Order), 2006 Census". 2.statcan.gc.ca. Archived from the original on 2013-10-05. Retrieved 2012-12-02.
- "List of confirmed candidates". Elections Canada. Archived from the original on October 8, 2019. Retrieved October 4, 2019.
- "Election Night Results". Elections Canada. Archived from the original on October 22, 2019. Retrieved October 31, 2019.
- "Elections Canada – Confirmed candidates for Thunder Bay—Superior North, 30 September 2015". Archived from the original on 4 October 2015. Retrieved 3 October 2015.
- "Elections Canada – Preliminary Election Expenses Limits for Candidates". Archived from the original on 2015-08-15. Retrieved 2020-02-02.
- ""Download latest results for all electoral districts (tab-delimited format)"". Archived from the original on 2012-02-04. Retrieved 2015-10-25.
- "Pundits' Guide to Canadian Elections". Archived from the original on 2015-08-25. Retrieved 2015-09-22.
External links
- Riding history 1976-1987 from the Library of Parliament
- Riding history 1988-2008 from the Library of Parliament
- 2011 results from Elections Canada
- Campaign expense data from Elections Canada
.png.webp)