Nepean—Carleton
Nepean—Carleton was a federal electoral district in Ontario, Canada that was represented in the House of Commons from 1979 to 1988, and again from 1997 to 2015.
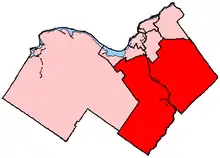 Nepean—Carleton in relation to other electoral districts in Ottawa | |
| Defunct federal electoral district | |
| Legislature | House of Commons |
| District created | 1976 |
| District abolished | 2013 |
| First contested | 1979 |
| Last contested | 2011 |
| District webpage | profile, map |
| Demographics | |
| Population (2011)[1] | 159,032 |
| Electors (2011) | 103,414 |
| Area (km²)[2] | 1,128.05 |
| Census division(s) | Ottawa |
| Census subdivision(s) | Ottawa |
It included the southern portion of the former city of Nepean and adjacent suburban and rural areas of west and southern Ottawa.
Geography
Nepean—Carleton consists of the part of the City of Ottawa lying east and south of a line drawn from the southwestern city limit, northeast along the southeast limit of the former Township of Goulbourn, northwest along McCordick Road and Eagleson Road to the southern limit of the former City of Kanata, then along the southern and eastern limits of Kanata, northwest along Eagleson Road, northeast along Highway 417, southwest along Richmond Road, east along the Canadian National Railway, southeast along Merivale Road, east along West Hunt Club Road, south along the Rideau River, east along the former southern limit of the City of Ottawa, south along Riverside Drive, southeast along Limebank Road, northeast along Leitrim Road, northwest along the Canadian Pacific Railway, northeast along Lester Road, northwest along Conroy Road, northeast along Hunt Club Road to Hawthorne Road and then in a straight line to Blake Road, and northeast along Blake Road, east along Highway 417, and southeast along Boundary Road to the eastern city limit.
History
The riding was created in 1976 from parts of Grenville—Carleton and Ottawa—Carleton. In 1987, it was abolished when it was redistributed between Nepean, Carleton—Gloucester and Lanark—Carleton ridings.
In 1996, it was re-created from parts of Nepean, Carleton—Gloucester, Lanark—Carleton and Ottawa South ridings.
It consisted initially of the townships of Goulbourn, Osgoode and Rideau, and the City of Nepean, excluding the northeastern part lying north and east of a line drawn from the western city limit east along the Queensway (Highway 417), southwest along Richmond Road, east along the Canadian National Railway, north along Merivale Road, and east along the northern boundary of the National Capital Commission buffer zone to the eastern city limit.
It was given its current boundaries described above in 2003.
The riding has been represented by Conservative Pierre Poilievre from 2004 until it was abolished due to the 2012 federal electoral boundaries redistribution, which saw the riding redistributed mostly into the ridings of Carleton and Nepean with small parts going to Orléans and Kanata—Carleton.
Members of Parliament
This riding has elected the following members of the House of Commons:
| Parliament | Years | Member | Party | |
|---|---|---|---|---|
| Nepean—Carleton Riding created from Grenville—Carleton and Ottawa—Carleton |
||||
| 31st | 1979–1980 | Walter Baker | Progressive Conservative | |
| 32nd | 1980–1984 | |||
| 33rd | 1984–1988 | William Tupper | ||
| Riding dissolved into Nepean, Carleton—Gloucester and Lanark—Carleton |
||||
| Riding re-created from Nepean, Carleton—Gloucester, Lanark—Carleton and Ottawa South |
||||
| 36th | 1997–2000 | David Pratt | Liberal | |
| 37th | 2000–2004 | |||
| 38th | 2004–2006 | Pierre Poilievre | Conservative | |
| 39th | 2006–2008 | |||
| 40th | 2008–2011 | |||
| 41st | 2011–2015 | |||
| Riding dissolved into Nepean, Carleton, Orléans, and Kanata—Carleton |
||||
Election results
1997 – 2015
| 2011 Canadian federal election | ||||||||
|---|---|---|---|---|---|---|---|---|
| Party | Candidate | Votes | % | ±% | Expenditures | |||
| Conservative | Pierre Poilievre | 43,477 | 54.45 | -1.39 | – | |||
| Liberal | Ryan Keon | 20,146 | 25.23 | +1.81 | – | |||
| New Democratic | Ric Dagenais | 12,962 | 16.23 | +6.52 | – | |||
| Green | Jean-Luc Cooke | 3,260 | 4.08 | -6.94 | – | |||
| Total valid votes/Expense limit | 79,845 | 100.00 | – | |||||
| Total rejected ballots | 272 | 0.34 | -0.05 | |||||
| Turnout | 80,117 | 72.55 | +3.16 | |||||
| Eligible voters | 110,425 | – | – | |||||
| 2008 Canadian federal election | ||||||||
|---|---|---|---|---|---|---|---|---|
| Party | Candidate | Votes | % | ±% | Expenditures | |||
| Conservative | Pierre Poilievre | 39,915 | 55.84 | +1.1 | $86,150 | |||
| Liberal | Ed Mahfouz | 16,743 | 23.42 | -4.6 | $40,049 | |||
| Green | Lori Gadzala | 7,880 | 11.02 | +5.3 | $21,886 | |||
| New Democratic | Phil Brown | 6,946 | 9.71 | -1.9 | $16,371 | |||
| Total valid votes/Expense limit | 71,484 | 100.00 | $99,843 | |||||
| Total rejected ballots | 280 | 0.39 | – | |||||
| Total votes | 71,764 | 69.39 | – | |||||
| 2006 Canadian federal election | ||||||||
|---|---|---|---|---|---|---|---|---|
| Party | Candidate | Votes | % | ±% | ||||
| Conservative | Pierre Poilievre | 39,260 | 54.7 | +9.0 | ||||
| Liberal | Michael Gaffney | 20,111 | 28.0 | -12.1 | ||||
| New Democratic | Laurel Gibbons | 8,324 | 11.6 | +2.5 | ||||
| Green | Lori Gadzala | 4,090 | 5.7 | +1.4 | ||||
| Total valid votes | 71,785 | 100.0 | ||||||
| 2004 Canadian federal election | ||||||||
|---|---|---|---|---|---|---|---|---|
| Party | Candidate | Votes | % | ±% | ||||
| Conservative | Pierre Poilievre | 30,420 | 45.7 | -7.7 | ||||
| Liberal | David Pratt | 26,684 | 40.1 | -1.1 | ||||
| New Democratic | Phil Brown | 6,072 | 9.1 | +5.4 | ||||
| Green | Chris Walker | 2,886 | 4.3 | +3.0 | ||||
| Marijuana | Brad Powers | 561 | 0.8 | |||||
| Total valid votes | 66,623 | 100.0 | ||||||
Note: Conservative vote is compared to the total of the Canadian Alliance vote and Progressive Conservative vote in 2000 election.
| 2000 Canadian federal election | ||||||||
|---|---|---|---|---|---|---|---|---|
| Party | Candidate | Votes | % | ±% | ||||
| Liberal | David Pratt | 24,570 | 41.2 | -7.6 | ||||
| Alliance | Michael Green | 22,310 | 37.4 | +11.0 | ||||
| Progressive Conservative | Bill Knott | 9,536 | 16.0 | -3.1 | ||||
| New Democratic | Craig Parsons | 2,223 | 3.7 | -1.1 | ||||
| Green | Isobel McGregor | 805 | 1.3 | |||||
| Canadian Action | Jack Waisvisz | 131 | 0.2 | -0.3 | ||||
| Natural Law | Lester Newby | 118 | 0.2 | -0.2 | ||||
| Total valid votes | 59,693 | 100.0 | ||||||
Note: Canadian Alliance vote is compared to the Reform vote in 1997 election.
| 1997 Canadian federal election | ||||||||
|---|---|---|---|---|---|---|---|---|
| Party | Candidate | Votes | % | |||||
| Liberal | David Pratt | 28,366 | 48.8 | |||||
| Reform | Paul Fitzgerald | 15,333 | 26.4 | |||||
| Progressive Conservative | Betty Hill | 11,072 | 19.0 | |||||
| New Democratic | Cathy Martin | 2,788 | 4.8 | |||||
| Canadian Action | Terrence Bell | 331 | 0.6 | |||||
| Natural Law | Brian Jackson | 238 | 0.4 | |||||
| Total valid votes | 58,128 | 100.0 | ||||||
1979 – 1988
| 1984 Canadian federal election | ||||||||
|---|---|---|---|---|---|---|---|---|
| Party | Candidate | Votes | % | ±% | ||||
| Progressive Conservative | Bill Tupper | 41,663 | 55.9 | +2.4 | ||||
| Liberal | Gord Hunter | 20,852 | 28.0 | -5.1 | ||||
| New Democratic | Bea Murray | 11,035 | 14.8 | +2.6 | ||||
| Green | Gregory Vezina | 737 | 1.0 | |||||
| Independent | Ray Turmel | 204 | 0.3 | |||||
| Total valid votes | 74,491 | 100.0 | ||||||
| 1980 Canadian federal election | ||||||||
|---|---|---|---|---|---|---|---|---|
| Party | Candidate | Votes | % | ±% | ||||
| Progressive Conservative | Walter Baker | 31,498 | 53.5 | -6.0 | ||||
| Liberal | Gord Hunter | 19,482 | 33.1 | +5.4 | ||||
| New Democratic | Alan White | 7,187 | 12.2 | -0.5 | ||||
| Rhinoceros | Alan Cockerell | 658 | 1.1 | |||||
| Total valid votes | 58,825 | 100.0 | ||||||
| 1979 Canadian federal election | ||||||||
|---|---|---|---|---|---|---|---|---|
| Party | Candidate | Votes | % | |||||
| Progressive Conservative | Walter Baker | 36,717 | 59.6 | |||||
| Liberal | Bluma Appel | 17,108 | 27.8 | |||||
| New Democratic | Marnie Girvan | 7,810 | 12.7 | |||||
| Total valid votes | 61,635 | 100.0 | ||||||