Kenora (electoral district)
Kenora is a federal electoral district in Ontario, Canada, that has been represented in the House of Commons of Canada since 2004.
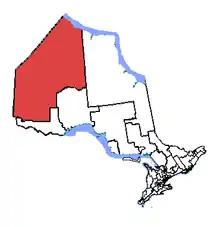 Kenora in relation to other Ontario electoral districts | |||
| Federal electoral district | |||
| Legislature | House of Commons | ||
| MP |
Conservative | ||
| District created | 2003 | ||
| First contested | 2004 | ||
| Last contested | 2019 | ||
| District webpage | profile, map | ||
| Demographics | |||
| Population (2011)[1] | 55,977 | ||
| Electors (2011) | 42,138 | ||
| Area (km²)[2] | 321,741 | ||
| Pop. density (per km²) | 0.17 | ||
| Census division(s) | Kenora, Thunder Bay | ||
| Census subdivision(s) | Dryden, Kenora, Red Lake, Sioux Lookout | ||
Of the federal electoral districts located in Ontario it is the largest by land mass, and the smallest by population. It encompasses most of Kenora District except for the eastern third, and a small section of the northwest corner of Thunder Bay District. It includes many remote First Nations reserves of extreme Northern Ontario. It succeeds the former federal riding of Kenora—Rainy River.
Geography
It consists of the part of the Territorial District of Kenora lying west of a line drawn due north from the northeast corner of the Territorial District of Thunder Bay (Albany River) to Hudson Bay; and the part of the Territorial District of Thunder Bay lying northwest of a line drawn east from the western limit of the territorial district along the 6th Base Line, north along eastern limit of the townships of Bertrand, McLaurin, Furlonge, Fletcher and Bulmer, and due north to the northern limit of the territorial district.
History
The federal riding was created in 2003 from parts of the Kenora—Rainy River riding. This riding was left unchanged after the 2012 electoral redistribution.
Member of Parliament
This riding has elected the following members of the House of Commons of Canada:
| Parliament | Years | Member | Party | |
|---|---|---|---|---|
| Kenora Riding created from Kenora—Rainy River |
||||
| 38th | 2004–2006 | Roger Valley | Liberal | |
| 39th | 2006–2008 | |||
| 40th | 2008–2011 | Greg Rickford | Conservative | |
| 41st | 2011–2015 | |||
| 42nd | 2015–2019 | Bob Nault | Liberal | |
| 43rd | 2019–present | Eric Melillo | Conservative | |
Election results
| 2019 Canadian federal election | ||||||||
|---|---|---|---|---|---|---|---|---|
| Party | Candidate | Votes | % | ±% | ||||
| Conservative | Eric Melillo | 9,313 | 34.1 | +5.64 | ||||
| Liberal | Bob Nault | 8,188 | 30.0 | -5.50 | ||||
| New Democratic | Rudy Turtle | 7,781 | 28.5 | -5.38 | ||||
| Green | Kirsi Ralko | 1,475 | 5.4 | +3.77 | ||||
| People's | Michael Di Pasquale | 382 | 1.4 | - | ||||
| Independent | Kelvin Boucher-Chicago | 165 | 0.6 | - | ||||
| Total valid votes | 27,304 | 100.00 | ||||||
| Conservative gain from Liberal | Swing | +9.04 | ||||||
| 2015 Canadian federal election | ||||||||
|---|---|---|---|---|---|---|---|---|
| Party | Candidate | Votes | % | ±% | Expenditures | |||
| Liberal | Bob Nault | 10,918 | 35.50 | +13.62 | $79,378.88 | |||
| New Democratic | Howard Hampton | 10,420 | 33.88 | +6.00 | $149,833.74 | |||
| Conservative | Greg Rickford | 8,751 | 28.46 | -18.59 | $143,556.97 | |||
| Green | Ember C. McKillop | 501 | 1.63 | -0.96 | $552.95 | |||
| Independent | Kelvin Boucher-Chicago | 162 | 0.53 | -0.07 | – | |||
| Total valid votes/Expense limit | 30,752 | 100.00 | $227,087.75 | |||||
| Total rejected ballots | 144 | 0.47 | – | |||||
| Turnout | 30,896 | 72.61 | – | |||||
| Eligible voters | 42,548 | |||||||
| Liberal gain from Conservative | Swing | +16.10 | ||||||
| Source: Elections Canada[3][4] | ||||||||
| 2011 Canadian federal election | ||||||||
|---|---|---|---|---|---|---|---|---|
| Party | Candidate | Votes | % | ±% | Expenditures | |||
| Conservative | Greg Rickford | 11,567 | 47.05 | +6.59 | – | |||
| New Democratic | Tania Cameron | 6,855 | 27.88 | +4.65 | – | |||
| Liberal | Roger Valley | 5,381 | 21.89 | -9.74 | – | |||
| Green | Mike Schwindt | 636 | 2.59 | -2.09 | – | |||
| Independent | Kelvin Chicago-Boucher | 147 | 0.60 | – | – | |||
| Total valid votes | 24,586 | 100.00 | ||||||
| Total rejected ballots | 120 | 0.49 | +0.09 | |||||
| Turnout | 24,706 | 60.38 | +5.01 | |||||
| Eligible voters | 40,917 | – | – | |||||
| 2008 Canadian federal election | ||||||||
|---|---|---|---|---|---|---|---|---|
| Party | Candidate | Votes | % | ±% | Expenditures | |||
| Conservative | Greg Rickford | 9,395 | 40.46 | +9.47 | $80,724 | |||
| Liberal | Roger Valley | 7,344 | 31.63 | -4.89 | $63,788 | |||
| New Democratic | Tania Cameron | 5,394 | 23.23 | -6.72 | $59,298 | |||
| Green | JoJo Holiday | 1,087 | 4.68 | +2.14 | $362 | |||
| Total valid votes/Expense limit | 23,220 | 100.00 | $90,484 | |||||
| Total rejected ballots | 94 | 0.40 | +0.09 | |||||
| Turnout | 23,314 | 55.37 | -8.11 | |||||
| Conservative gain from Liberal | Swing | -7.18 | ||||||
| 2006 Canadian federal election | ||||||||
|---|---|---|---|---|---|---|---|---|
| Party | Candidate | Votes | % | ±% | Expenditures | |||
| Liberal | Roger Valley | 9,937 | 36.52 | +0.29 | $75,329 | |||
| Conservative | Bill Brown | 8,434 | 30.99 | +3.07 | $62,258 | |||
| New Democratic | Susan Barclay | 8,149 | 29.95 | -2.11 | $79,469 | |||
| Green | Dave Vasey | 692 | 2.54 | -1.26 | $0 | |||
| Total valid votes/Expense limit | 27,212 | 100.00 | – | |||||
| Total rejected ballots | 85 | 0.31 | -0.22 | |||||
| Turnout | 27,297 | 63.48 | +8.22 | |||||
| 2004 Canadian federal election | ||||||||
|---|---|---|---|---|---|---|---|---|
| Party | Candidate | Votes | % | ±% | Expenditures | |||
| Liberal | Roger Valley | 8,563 | 36.23 | – | $66,623 | |||
| New Democratic | Susan Barclay | 7,577 | 32.06 | – | $34,796 | |||
| Conservative | Bill Brown | 6,598 | 27.92 | – | $27,132 | |||
| Green | Carl Chaboyer | 898 | 3.80 | – | $1,530 | |||
| Total valid votes/Expense limit | 23,636 | 100.00 | – | |||||
| Total rejected ballots | 126 | 0.53 | ||||||
| Turnout | 23,762 | 55.26 | ||||||
References
- "(Code 35035) Census Profile". 2011 census. Statistics Canada. 2012. Retrieved 2011-03-03.
External links
- Riding history from the Library of Parliament
- 2011 results from Elections Canada
- Campaign expense data from Elections Canada
.png.webp)