Richmond Hill (electoral district)
Richmond Hill is a federal electoral district in Ontario, Canada, that has been represented in the House of Commons of Canada since 2004.
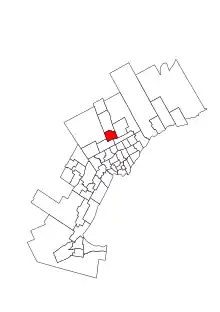 Richmond Hill in relation to other Greater Toronto ridings | |||
| Federal electoral district | |||
| Legislature | House of Commons | ||
| MP |
Liberal | ||
| District created | 2003 | ||
| First contested | 2004 | ||
| Last contested | 2019 | ||
| District webpage | profile, map | ||
| Demographics | |||
| Population (2016)[1] | 110,177 | ||
| Electors (2015) | 79,513 | ||
| Area (km²)[1] | 39.92 | ||
| Pop. density (per km²) | 2,759.9 | ||
| Census division(s) | York | ||
| Census subdivision(s) | Richmond Hill | ||
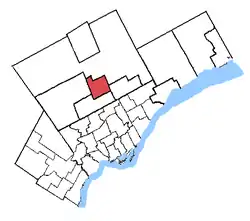
.png.webp)
It was created in 2003 from parts of Oak Ridges riding.
Geography
The riding includes the neighbourhoods of Elgin Mills, Bayview North, Bayview South, North Richvale, Hillsview, Bayview Hill, South Richvale, Langstaff and Doncrest in the City of Richmond Hill.
The electioral district consists of the part of Richmond Hill lying south of a line starting at the intersection of Bathurst Street and Elgin Mills Road West, east along Elgin Mills to Bayview, south along Bayview to the unnamed creek north of Taylor Mills Drive North, along the creek to Shirley Drive, Shirley Drive south to Major Mackenzie Drive, and east on Major Mackenzie to the eastern city limits. It also contains the part of the City of Markham east of Bayview Avenue, north of Highway 407, and west of Highway 404.[2]
Member of Parliament
This riding has elected the following member of the House of Commons of Canada:
| Parliament | Years | Member | Party | |
|---|---|---|---|---|
| Richmond Hill Riding created from Oak Ridges |
||||
| 38th | 2004–2006 | Bryon Wilfert | Liberal | |
| 39th | 2006–2008 | |||
| 40th | 2008–2011 | |||
| 41st | 2011–2015 | Costas Menegakis | Conservative | |
| 42nd | 2015–2019 | Majid Jowhari | Liberal | |
| 43rd | 2019–present | |||
Election results
| 2019 Canadian federal election | ||||||||
|---|---|---|---|---|---|---|---|---|
| Party | Candidate | Votes | % | ±% | Expenditures | |||
| Liberal | Majid Jowhari | 21,804 | 43.48 | -3.42 | $83,458.04 | |||
| Conservative | Costas Menegakis | 21,592 | 43.06 | -0.26 | $108,773.79 | |||
| New Democratic | Adam DeVita | 4,425 | 8.80 | +0.76 | $4,207.04 | |||
| Green | Ichha Kohli | 1,695 | 3.40 | +1.66 | $0.00 | |||
| People's | Igor Tvorogov | 507 | 1.0 | 0 | none listed | |||
| Rhinoceros | Otto Wevers | 126 | 0.2 | 0 | none listed | |||
| Total valid votes/Expense limit | 50,149 | 100.0 | ||||||
| Total rejected ballots | 584 | |||||||
| Turnout | 50,733 | 59.9 | ||||||
| Eligible voters | 84,660 | |||||||
| Source: Elections Canada[3][4] | ||||||||
| 2015 Canadian federal election | ||||||||
|---|---|---|---|---|---|---|---|---|
| Party | Candidate | Votes | % | ±% | Expenditures | |||
| Liberal | Majid Jowhari | 23,032 | 46.90 | +11.28 | $92,372.40 | |||
| Conservative | Michael Parsa | 21,275 | 43.32 | -0.23 | $139,598.40 | |||
| New Democratic | Adam DeVita | 3,950 | 8.04 | -8.99 | $11,776.30 | |||
| Green | Gwendolyn Veenema | 856 | 1.74 | -2.05 | – | |||
| Total valid votes/Expense limit | 49,113 | 100.0 | $215,221.97 | |||||
| Total rejected ballots | 253 | – | – | |||||
| Turnout | 49,366 | 61.39 | +5.43 | |||||
| Eligible voters | 80,402 | |||||||
| Liberal gain from Conservative | Swing | +5.76% | ||||||
| Source: Elections Canada[5][6] | ||||||||
| 2011 federal election redistributed results[7] | |||
|---|---|---|---|
| Party | Vote | % | |
| Conservative | 18,521 | 43.55 | |
| Liberal | 15,160 | 35.62 | |
| New Democratic | 7,245 | 17.03 | |
| Green | 1,612 | 3.79 | |
| Others | 4 | 0.01 | |
| 2011 Canadian federal election | ||||||||
|---|---|---|---|---|---|---|---|---|
| Party | Candidate | Votes | % | ±% | Expenditures | |||
| Conservative | Costas Menegakis | 22,078 | 44.14 | +8.45 | ||||
| Liberal | Bryon Wilfert | 17,671 | 35.33 | -11.66 | ||||
| New Democratic | Adam DeVita | 8,433 | 16.86 | +6.97 | ||||
| Green | Cameron Hastings | 1,832 | 3.66 | -3.75 | ||||
| Total valid votes/Expense limit | 50,014 | 100.00 | ||||||
| Total rejected ballots | 221 | 0.44 | -0.05 | |||||
| Turnout | 50,235 | 55.96 | +3.91 | |||||
| Eligible voters | 89,765 | – | – | |||||
| Conservative gain from Liberal | Swing | +10.05% | ||||||
| 2008 Canadian federal election | ||||||||
|---|---|---|---|---|---|---|---|---|
| Party | Candidate | Votes | % | ±% | Expenditures | |||
| Liberal | Bryon Wilfert | 21,488 | 46.99 | -6.58 | $76,540 | |||
| Conservative | Chungsen Leung | 16,318 | 35.69 | +3.81 | $86,007 | |||
| New Democratic | Wess Dowsett | 4,526 | 9.89 | -0.07 | $8,114 | |||
| Green | Dylan Marando | 3,388 | 7.41 | +2.84 | $6,267 | |||
| Total valid votes/Expense limit | 45,720 | 100.00 | $90,834 | |||||
| Total rejected ballots | 223 | 0.49 | +0.16 | |||||
| Turnout | 45,943 | 52.05 | -9.69 | |||||
| Liberal hold | Swing | -5.70% | ||||||
| 2006 Canadian federal election | ||||||||
|---|---|---|---|---|---|---|---|---|
| Party | Candidate | Votes | % | ±% | ||||
| Liberal | Bryon Wilfert | 27,837 | 53.57 | -4.91 | ||||
| Conservative | Joe Di Paola | 16,564 | 31.88 | +7.00 | ||||
| New Democratic | Wess Dowsett | 5,176 | 9.96 | +0.26 | ||||
| Green | Tim Rudkins | 2,379 | 4.57 | -0.06 | ||||
| Total valid votes | 51,956 | 100.00 | ||||||
| Total rejected ballots | 170 | 0.33 | ||||||
| Turnout | 52,126 | 61.74 | ||||||
| Liberal hold | Swing | -5.95% | ||||||
| 2004 Canadian federal election | ||||||||
|---|---|---|---|---|---|---|---|---|
| Party | Candidate | Votes | % | |||||
| Liberal | Bryon Wilfert | 27,102 | 58.48 | |||||
| Conservative | Pete Merrifield | 11,530 | 24.88 | |||||
| New Democratic | Nella Cotrupi | 4,495 | 9.70 | |||||
| Green | Tim Rudkins | 2,144 | 4.63 | |||||
| Progressive Canadian | Ellena Lam | 1,074 | 2.32 | |||||
| Total valid votes | 46,345 | 100.00 | ||||||
References
- "(Code 35075) Census Profile". 2011 census. Statistics Canada. 2012. Retrieved 2011-03-03.
- Riding history from the Library of Parliament
- Campaign expense data from Elections Canada
Notes
- "Census Profile, 2016 Census Richmond Hill". Statistics Canada. 2016. Retrieved 4 December 2018.
- "Richmond Hill district map". www.elections.ca. Elections Canada. Retrieved 29 January 2020.
- "List of confirmed candidates". Elections Canada. Retrieved October 3, 2019.
- "Election Night Results". Elections Canada. Retrieved November 4, 2019.
- Elections Canada – Confirmed candidates for Richmond Hill, 30 September 2015
- Elections Canada – Preliminary Election Expenses Limits for Candidates
- Pundits' Guide to Canadian Elections
Places adjacent to Richmond Hill (electoral district) | ||||||||||
|---|---|---|---|---|---|---|---|---|---|---|
| ||||||||||