Thunder Bay—Rainy River
Thunder Bay—Rainy River is a federal electoral district in Ontario, Canada, that has been represented in the House of Commons of Canada since 2004. It first elected a member in the 2004 federal election.
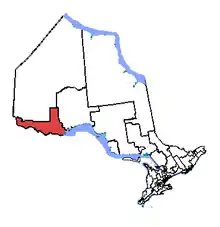 Thunder Bay—Rainy River in relation to the other area ridings | |||
| Federal electoral district | |||
| Legislature | House of Commons | ||
| MP |
Liberal | ||
| District created | 2003 | ||
| First contested | 2004 | ||
| Last contested | 2019 | ||
| District webpage | profile, map | ||
| Demographics | |||
| Population (2011)[1] | 82,984 | ||
| Electors (2015) | 62,207 | ||
| Area (km²)[2] | 39,545 | ||
| Pop. density (per km²) | 2.1 | ||
| Census division(s) | Thunder Bay District, Rainy River District | ||
| Census subdivision(s) | Thunder Bay, Fort Frances, Oliver Paipoonge, Atikokan, Neebing | ||
History
It was created in 2003 from parts of Kenora—Rainy River and Thunder Bay—Atikokan ridings.
This riding gained a fraction of territory from Thunder Bay—Superior North during the 2012 electoral redistribution.
Geography
It consists of the Territorial District of Rainy River, and the part of the Territorial District of Thunder Bay lying south and west of a line drawn from the western limit of the territorial district east along the 6th Base Line, south along longitude 90o00 W, Dog River and the western shoreline of Dog Lake, west along the northern boundary of the Township of Fowler, south along its western boundary, and east along its southern boundary, south along the Kaministiquia River, east along the northern limit of the Township of Oliver Paipoonge, south along its eastern limit and along Pole Line Road, north along Thunder Bay Expressway (Highways 11 and 17), east along Harbour Expressway and Main Street to 110th Avenue, and due east to the eastern limit of the City of Thunder Bay, along that limit to the northeast corner of the Township of Neebing, and southeast to the US border.
Member of Parliament
This riding has elected the following Member of Parliament:
| Parliament | Years | Member | Party | |
|---|---|---|---|---|
| Thunder Bay—Rainy River Riding created from Kenora—Rainy River and Thunder Bay—Atikokan |
||||
| 38th | 2004–2006 | Ken Boshcoff | Liberal | |
| 39th | 2006–2008 | |||
| 40th | 2008–2011 | John Rafferty | New Democratic | |
| 41st | 2011–2015 | |||
| 42nd | 2015–2019 | Don Rusnak | Liberal | |
| 43rd | 2019–present | Marcus Powlowski | ||
Election results
| 2019 Canadian federal election | ||||||||
|---|---|---|---|---|---|---|---|---|
| Party | Candidate | Votes | % | ±% | Expenditures | |||
| Liberal | Marcus Powlowski | 14,498 | 35.3 | -8.71 | $55,609.36 | |||
| Conservative | Linda Rydholm | 12,039 | 29.3 | +8.21 | $50,919.61 | |||
| New Democratic | Yuk-Sem Won | 11,944 | 29.1 | -0.56 | none listed | |||
| Green | Amanda Moddejonge | 1,829 | 4.5 | -0.73 | none listed | |||
| People's | Andrew Hartnell | 741 | 1.8 | – | none listed | |||
| Total valid votes/Expense limit | 41,051 | 100.0 | ||||||
| Total rejected ballots | 333 | |||||||
| Turnout | 41,384 | 63.0 | ||||||
| Eligible voters | 65,689 | |||||||
| Liberal hold | Swing | -8.46 | ||||||
| Source: Elections Canada[3][4] | ||||||||
| 2015 Canadian federal election | ||||||||
|---|---|---|---|---|---|---|---|---|
| Party | Candidate | Votes | % | ±% | Expenditures | |||
| Liberal | Don Rusnak | 18,523 | 44.01 | +22.31 | $69,724.11 | |||
| New Democratic | John Rafferty | 12,483 | 29.66 | -18.99 | $106,616.41 | |||
| Conservative | Moe Comuzzi | 8,876 | 21.09 | -6.12 | $64,890.91 | |||
| Green | Christy Radbourne | 2,201 | 5.23 | +2.79 | $3,586.52 | |||
| Total valid votes/Expense limit | 42,083 | 100.0 | $233,739.33 | |||||
| Total rejected ballots | 176 | – | – | |||||
| Turnout | 42,259 | 67.6 | +7.5 | |||||
| Eligible voters | 62,773 | |||||||
| Liberal gain from New Democratic | Swing | +20.65 | ||||||
| Source: Elections Canada[5][6] | ||||||||
| 2011 federal election redistributed results[7] | |||
|---|---|---|---|
| Party | Vote | % | |
| New Democratic | 18,126 | 48.65 | |
| Conservative | 10,138 | 27.21 | |
| Liberal | 8,085 | 21.70 | |
| Green | 911 | 2.44 | |
| Others | 1 | 0.00 | |
| 2011 Canadian federal election | ||||||||
|---|---|---|---|---|---|---|---|---|
| Party | Candidate | Votes | % | ±% | Expenditures | |||
| New Democratic | John Rafferty | 18,085 | 48.7 | +8.4 | – | |||
| Conservative | Maureen Comuzzi-Stehmann | 10,097 | 27.2 | +3.6 | – | |||
| Liberal | Ken Boshcoff | 8,067 | 21.7 | -10.6 | – | |||
| Green | Ed Shields | 909 | 2.4 | -1.4 | – | |||
| Total valid votes/Expense limit | 37,158 | 100.0 | ||||||
| Total rejected ballots | 130 | 0.3 | – | |||||
| Turnout | 37,288 | 60.1 | – | |||||
| Eligible voters | 62,018 | – | – | |||||
| New Democratic hold | Swing | +2.4 | ||||||
| 2008 Canadian federal election | ||||||||
|---|---|---|---|---|---|---|---|---|
| Party | Candidate | Votes | % | ±% | Expenditures | |||
| New Democratic | John Rafferty | 14,478 | 40.3 | +6.9 | $80,937 | |||
| Liberal | Ken Boshcoff | 11,589 | 32.3 | -2.8 | $63,482 | |||
| Conservative | Richard Neumann | 8,466 | 23.6 | -3.6 | $44,136 | |||
| Green | Russ Aegard | 1,377 | 3.8 | +0.7 | $1,292 | |||
| Total valid votes/Expense limit | 35,910 | 100.0 | $93,852 | |||||
| Total rejected ballots | 105 | |||||||
| Turnout | 36,015 | 57.05 | ||||||
| Eligible voters | 63,128 | |||||||
| New Democratic gain from Liberal | Swing | +4.85 | ||||||
| Source: Elections Canada [8] | ||||||||
| 2006 Canadian federal election | ||||||||
|---|---|---|---|---|---|---|---|---|
| Party | Candidate | Votes | % | ±% | ||||
| Liberal | Ken Boshcoff | 13,520 | 35.1 | -4.3 | ||||
| New Democratic | John Rafferty | 12,862 | 33.4 | +3.7 | ||||
| Conservative | David Leskowski | 10,485 | 27.2 | +0.9 | ||||
| Green | Russ Aegard | 1,193 | 3.1 | +0.7 | ||||
| Marijuana | Doug MacKay | 424 | 1.1 | -0.4 | ||||
| Total valid votes | 38,484 | 100.0 | ||||||
| Total rejected ballots | 134 | |||||||
| Turnout | 36,618 | 57.96 | ||||||
| Eligible voters | 63,180 | |||||||
| Liberal hold | Swing | -4.00 | ||||||
| Source: Elections Canada [9]}} | ||||||||
| 2004 Canadian federal election | ||||||||
|---|---|---|---|---|---|---|---|---|
| Party | Candidate | Votes | % | |||||
| Liberal | Ken Boshcoff | 14,290 | 39.4 | |||||
| New Democratic | John Rafferty | 10,781 | 29.7 | |||||
| Conservative | David Leskowski | 9,559 | 26.3 | |||||
| Green | Russ Aegard | 856 | 2.4 | |||||
| Marijuana | Doug Thompson | 547 | 1.5 | |||||
| Christian Heritage | Johannes Scheibler | 267 | 0.7 | |||||
| Total valid votes | 36,300 | 100.0 | ||||||
| Total rejected ballots | 162 | |||||||
| Turnout | 36,462 | 57.22 | ||||||
| Eligible voters | 63,718 | |||||||
| Source: Elections Canada [10] | ||||||||
References
- "(Code 35090) Census Profile". 2011 census. Statistics Canada. 2012. Retrieved 2011-03-03.
Notes
- Statistics Canada: 2012
- Statistics Canada: 2012
- "List of confirmed candidates". Elections Canada. Retrieved October 4, 2019.
- "Election Night Results". Elections Canada. Retrieved October 31, 2019.
- Elections Canada – Confirmed candidates for Thunder Bay—Rainy River, 30 September 2015
- Elections Canada – Preliminary Election Expenses Limits for Candidates
- Pundits' Guide to Canadian Elections
- "Official Voting Results - Fortieth General Election 2008". Elections Canada. Retrieved November 19, 2019.
- "Official Voting Results - Thirty-Ninth General Election". Elections Canada. Retrieved November 19, 2019.
- "Official Voting Results - Thirty-Eighth General Election". Elections Canada. Retrieved November 19, 2019.
External links
- Riding history from the Library of Parliament
- 2011 results from Elections Canada
- Campaign expense data from Elections Canada
.png.webp)