Humber River—Black Creek
Humber River—Black Creek is a federal electoral district in Toronto, Ontario, Canada, that has been represented in the House of Commons of Canada from 1867 to 1904 and since 1917. Prior to the 2015 election, the riding was known as York West.[3] The name was changed because the district is not located within the Region of York but within the City of Toronto.
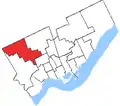
.png.webp) Humber River-Black Creek in relation to the other Toronto ridings (2013 boundaries) | |||
| Federal electoral district | |||
| Legislature | House of Commons | ||
| MP |
Liberal | ||
| District created | 1867 | ||
| First contested | 1867 | ||
| Last contested | 2019 | ||
| District webpage | profile, map | ||
| Demographics | |||
| Population (2011)[1] | 108,198 | ||
| Electors (2015) | 60,343 | ||
| Area (km²)[2] | 32 | ||
| Pop. density (per km²) | 3,381.2 | ||
| Census division(s) | Toronto | ||
| Census subdivision(s) | Toronto | ||
.gif)
As per the 2016 Census, Humber River—Black Creek is the City of Toronto riding with the highest percentage of people belonging to the Latin American (9.5%) and Southeast Asian (8.9%) visible minorities. It also the City of Toronto riding with the highest percentage of people of Jamaican (8.5%) and Vietnamese (8.0%) ethnic origins. At the same time, it is one of the only two (2) City of Toronto (besides Etobicoke Centre), where Italian is the most frequent ethnic origin (12.8%).
Geography
The district includes the northwest corner of the former city of North York. It includes the neighbourhoods of Humber Summit, Humbermede, Humberlea, York University Heights, Jane and Finch and the extreme western part of Downsview.
It consists of the part of the City of Toronto bounded on the north by the northern city limit, and on the east, south and west by a line drawn from the city limit south along Keele Street, west along Grandravine Drive, southeast along Black Creek, west along Sheppard Avenue West, south along Jane Street, west along Highway 401, and northwest along the Humber River to the northern city limit.
Member of Parliament
The riding is represented by Judy Sgro in the House of Commons of Canada.
History
It was created by the British North America Act which divided the County of York into two ridings: York East and York West.
The West Riding of York consisted of the Townships of Etobicoke, Vaughan and that part of the Township of York lying west of Yonge Street.
In 1874, it was expanded to include all of the Village of Richmond Hill, which had previously been divided between the two York ridings, after the village council had petitioned to have the whole village included in York West.
The electoral district was abolished in 1903 when York was divided into three ridings. York West was redistributed between the new ridings of York Centre and York South.
The riding was re-created in 1914 from parts of York Centre and York South when the county of York, including parts of the city of Toronto, was divided into four ridings: York North, South, East and West. West York was defined to consist of the townships of Vaughan and Etobicoke and the villages of Weston, New Toronto, Mimico and Woodbridge and Ward 7 of the city of Toronto; and the portion of the township of York lying between the western limit of the city of Toronto and the township of Etobicoke bounded on the south by Lake Ontario and on the north by Northland Avenue.
In 1924, it was redefined to consist of the part of the county of York lying west of Yonge Street, south of the south boundary of the township of Vaughan and outside the city of Toronto.
In 1933, it was redefined to consist of the part of the Township of York lying west of a line drawn north from the limits of the city of Toronto along Weston Road and west along Lambton Avenue to the Humber River, the Township of Etobicoke, the towns of Mimico and New Toronto and the villages of Long Branch and Swansea.
In 1952, it was redefined to consist of the town of New Toronto, the village of Long Branch and the part of the township of Etobicoke lying west of a line drawn from the southwest corner of the town of Mimico north along the west boundary of the town of Mimico, east along Queen Elizabeth Way, north along Royal York Road, east along Sunnydale Drive, north along Prince Edward Drive, east along Bloor Street West and Old Mill Road, north along the Humber River, to the northern boundary of the township of Etobicoke.
In 1966, it was redefined to consist of the part of Metropolitan Toronto bounded by a line drawn from Eglinton Avenue West, north along Jane Street, east along Lawrence Avenue West, north along the C.N.R. line, west along Highway 401, north along Keele Street, west along Calvington Drive, northwest along Exbury Road, north along Jane Street, west along Sheppard Avenue West, north along Highway 400, west along Steeles Avenue West, south along the boundary between the Townships of Etobicoke and Toronto, southeast along the West Branch of the Humber River, south along Kipling Avenue North, east along Rexdale Boulevard, south along Islington Avenue North, east along Dixon Side Road, southeast along the Humber River, and east Eglinton Avenue West to Jane Street.
In 1976, it was redefined to consist of the part of Metropolitan Toronto bounded on the north by Steeles Avenue West, on the west by the Humber River, and on the south and east by a line drawn from the Humber River east along Lawrence Avenue West, north along Keele Street, west along Sheppard Avenue West, and north along Highway No. 400 to Steeles Avenue West.
In 1987, it was redefined to consist of the parts of the cities of Etobicoke and North York bounded on the north by Steeles Avenue West, and on the west, south and east by a line drawn from Steeles Avenue south along Martin Grove Road, southeast along Albion Road, north along Kipling Avenue, southeast along Farr Avenue, east to Islington Avenue, north along Islington Avenue, south along the western limit of the City of North York, east along Highway 401, north along Jane Street, east along Grandravine Drive, and north along Black Creek to Steeles Avenue.
In 1996, it was redefined to consist of the part of the City of North York bounded on the north and west by the city limits, and on the east and south by a line drawn from Steeles Avenue south along Dufferin Street, west along Sheppard Avenue West, north along Keele Street, west along Grandravine Drive, south along Jane Street, and west along Highway 401 to the western city limit.
In 2003, it was given its current boundaries as described above.
Members of Parliament
This riding has elected the following Members of Parliament:
| Parliament | Years | Member | Party | |
|---|---|---|---|---|
| York West | ||||
| 1st | 1867–1868 | William Pearce Howland | Liberal–Conservative | |
| 1868–1872 | Amos Wright | Liberal | ||
| 2nd | 1872–1874 | David Blain | ||
| 3rd | 1874–1878 | |||
| 4th | 1878–1882 | Nathaniel Clarke Wallace | Conservative | |
| 5th | 1882–1887 | |||
| 6th | 1887–1891 | |||
| 7th | 1891–1896 | |||
| 8th | 1896–1897 | |||
| 1897–1900 | ||||
| 9th | 1900–1902 | |||
| 1902–1904 | Archibald Campbell | Liberal | ||
| Riding dissolved into York Centre and York South | ||||
| York West Riding re-created from York Centre and York South |
||||
| 13th | 1917–1921 | Thomas George Wallace | Government (Unionist) | |
| 14th | 1921–1925 | Henry Lumley Drayton | Conservative | |
| 15th | 1925–1926 | |||
| 16th | 1926–1928 | |||
| 1928–1930 | Earl Lawson | |||
| 17th | 1930–1935 | |||
| 18th | 1935–1940 | John Everett Lyle Streight | Liberal | |
| 19th | 1940–1945 | Agar Rodney Adamson | Progressive Conservative | |
| 20th | 1945–1949 | |||
| 21st | 1949–1953 | |||
| 22nd | 1953–1954 | |||
| 1954–1957 | John Borden Hamilton | |||
| 23rd | 1957–1958 | |||
| 24th | 1958–1962 | |||
| 25th | 1962–1963 | Red Kelly | Liberal | |
| 26th | 1963–1965 | |||
| 27th | 1965–1968 | Robert Winters | ||
| 28th | 1968–1972 | Philip Givens | ||
| 29th | 1972–1974 | James Fleming | ||
| 30th | 1974–1979 | |||
| 31st | 1979–1980 | |||
| 32nd | 1980–1984 | |||
| 33rd | 1984–1988 | Sergio Marchi | ||
| 34th | 1988–1993 | |||
| 35th | 1993–1997 | |||
| 36th | 1997–1999 | |||
| 1999–2000 | Judy Sgro | |||
| 37th | 2000–2004 | |||
| 38th | 2004–2006 | |||
| 39th | 2006–2008 | |||
| 40th | 2008–2011 | |||
| 41st | 2011–2015 | |||
| Humber River—Black Creek | ||||
| 42nd | 2015–2019 | Judy Sgro | Liberal | |
| 43rd | 2019–present | |||
Former boundaries
 1966 to 1976
 1976 to 1987
 1987 to 1996
 1996 to 2003
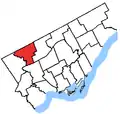 2003 to 2015
Election results
Humber River—Black Creek, 2015-present
| 2019 Canadian federal election | ||||||||
|---|---|---|---|---|---|---|---|---|
| Party | Candidate | Votes | % | ±% | Expenditures | |||
| Liberal | Judy Sgro | 23,187 | 61.1 | -5.81 | $93,410.00 | |||
| New Democratic | Maria Augimeri | 7,198 | 19.0 | +8.06 | $18,120.64 | |||
| Conservative | Iftikhar Choudry | 6,164 | 16.3 | -3.96 | $3,300.00 | |||
| Green | Mike Schmitz | 804 | 2.1 | +0.47 | none listed | |||
| People's | Ania Krosinska | 402 | 1.1 | – | none listed | |||
| United | Stenneth Smith | 114 | 0.3 | - | $0.00 | |||
| Marxist–Leninist | Christine Nugent | 89 | 0.2 | -0.36 | $0.00 | |||
| Total valid votes/Expense limit | 37,958 | 100.0 | ||||||
| Total rejected ballots | 503 | |||||||
| Turnout | 38,461 | 56.8 | ||||||
| Eligible voters | 67,656 | |||||||
| Source: Elections Canada[4][5] | ||||||||
| 2015 Canadian federal election | ||||||||
|---|---|---|---|---|---|---|---|---|
| Party | Candidate | Votes | % | ±% | Expenditures | |||
| Liberal | Judy Sgro | 23,995 | 66.91 | +19.92 | $81,660.40 | |||
| Conservative | Kerry Vandenberg | 7,228 | 20.16 | -1.93 | $60,649.16 | |||
| New Democratic | Darnel Harris | 3,851 | 10.74 | -17.11 | $3,291.83 | |||
| Green | Keith Jarrett | 584 | 1.63 | +0.01 | – | |||
| Marxist–Leninist | Christine Nugent | 201 | 0.56 | – | – | |||
| Total valid votes/Expense limit | 35,859 | 100.00 | $196,402.78 | |||||
| Total rejected ballots | 333 | 0.92 | – | |||||
| Turnout | 36,192 | 59.34 | – | |||||
| Eligible voters | 60,994 | |||||||
| Liberal hold | Swing | +10.92 | ||||||
| Source: Elections Canada[6][7] | ||||||||
York West, 1917–2015
| 2011 Canadian federal election | ||||||||
|---|---|---|---|---|---|---|---|---|
| Party | Candidate | Votes | % | ±% | Expenditures | |||
| Liberal | Judy Sgro | 13,030 | 47.0 | -12.4 | ||||
| New Democratic | Giulio Manfrini | 7,721 | 27.8 | +9.1 | ||||
| Conservative | Audrey Walters | 6,122 | 22.1 | +5.4 | ||||
| Green | Unblind Tibben | 450 | 1.6 | -3.6 | ||||
| Christian Heritage | George Okoth Otura | 231 | 0.8 | – | ||||
| Canadian Action | Arthur Smitherman | 170 | 0.6 | – | ||||
| Total valid votes/Expense limit | 27,724 | 100.0 | ||||||
| Total rejected ballots | 267 | 1.0 | +0.2 | |||||
| Turnout | 27,991 | 48.2 | -0.1 | |||||
| Eligible voters | 57,287 | – | – | |||||
| 2008 Canadian federal election | ||||||||
|---|---|---|---|---|---|---|---|---|
| Party | Candidate | Votes | % | ±% | Expenditures | |||
| Liberal | Judy Sgro | 16,997 | 59.4 | -4.4 | $35,514 | |||
| New Democratic | Giulio Manfrini | 5,363 | 18.7 | +4.6 | $12,354 | |||
| Conservative | Kevin Nguyen | 4,773 | 16.7 | -1.9 | $12,960 | |||
| Green | Nick Capra | 1,488 | 5.2 | +2.2 | $1,557 | |||
| Total valid votes/Expense limit | 28,621 | 100.0 | $77,457 | |||||
| Total rejected ballots | 219 | 0.8 | ||||||
| Turnout | 28,840 | 48.3 | ||||||
| 2006 Canadian federal election: York West | ||||||||
|---|---|---|---|---|---|---|---|---|
| Party | Candidate | Votes | % | Expenditures | ||||
| Liberal | Judy Sgro | 21,418 | 63.78 | $48,741.93 | ||||
| Conservative | Parm Gill | 6,244 | 18.59 | $71,005.65 | ||||
| New Democratic | Sandra Romano Anthony | 4,724 | 14.07 | $8,845.73 | ||||
| Green | Nick Capra | 1,002 | 2.98 | $1,692.18 | ||||
| Independent | Axcel Cocon | 192 | 0.57 | $1,801.61 | ||||
| Total valid votes | 33,580 | 100.00 | ||||||
| Total rejected ballots | 261 | |||||||
| Turnout | 33,841 | 57.90 | ||||||
| Electors on the lists | 58,450 | |||||||
| 2004 Canadian federal election | ||||||||
|---|---|---|---|---|---|---|---|---|
| Party | Candidate | Votes | % | ±% | ||||
| Liberal | Judy Sgro | 17,903 | 64.7 | -12.6 | ||||
| New Democratic | Sandra Romano Anthony | 4,228 | 15.2 | +6.0 | ||||
| Conservative | Leslie Soobrian | 3,120 | 11.2 | +0.5 | ||||
| Christian Heritage | Joseph Grubb | 1,580 | 5.7 | |||||
| Green | Tim McKellar | 824 | 3.0 | |||||
| Total valid votes | 27,655 | 100.0 | ||||||
Note: Conservative vote is compared to the total of the Canadian Alliance vote and Progressive Conservative vote in 2000 election.
| 2000 Canadian federal election | ||||||||
|---|---|---|---|---|---|---|---|---|
| Party | Candidate | Votes | % | ±% | ||||
| Liberal | Judy Sgro | 19,737 | 77.3 | +3.1 | ||||
| Alliance | Munish Chandra | 2,724 | 10.7 | +7.9 | ||||
| New Democratic | Julia McCrea | 2,361 | 9.2 | +1.5 | ||||
| Marijuana | G. Marcello Marchetti | 537 | 2.1 | |||||
| Marxist–Leninist | Amarjit Dhillon | 175 | 0.7 | |||||
| Total valid votes | 25,534 | 100.0 | ||||||
Note: Canadian Alliance vote is compared to the Reform vote in 1997 election.
| Canadian federal by-election, November 15, 1999: York West | ||||||||
|---|---|---|---|---|---|---|---|---|
| Party | Candidate | Votes | % | ±% | ||||
| Liberal | Judy Sgro | 10,034 | 74.2 | +0.5 | ||||
| Progressive Conservative | Elio Di Iorio | 1,721 | 12.7 | +5.2 | ||||
| New Democratic | Julia McCrea | 1,054 | 7.8 | -2.1 | ||||
| Reform | Enzo Granzotto | 377 | 2.8 | -6.2 | ||||
| Canadian Action | Stephen Burega | 242 | 1.8 | |||||
| Green | Henry Zeifman | 101 | 0.7 | |||||
| Total valid votes | 13,529 | 100.0 | ||||||
| Liberal hold | Swing | +1.3 | ||||||
| By-election due to the appointment of Sergio Marchi as Canadian Ambassador to the World Trade Organization | ||||||||
| 1997 Canadian federal election | ||||||||
|---|---|---|---|---|---|---|---|---|
| Party | Candidate | Votes | % | ±% | ||||
| Liberal | Sergio Marchi | 21,254 | 73.6 | -6.2 | ||||
| New Democratic | Lombe Chinkangala | 2,853 | 9.9 | +6.5 | ||||
| Reform | Ken Freeman | 2,598 | 9.0 | -1.7 | ||||
| Progressive Conservative | Richard Donovan | 2,165 | 7.5 | +2.8 | ||||
| Total valid votes | 28,870 | 100.0 | ||||||
| 1993 Canadian federal election | ||||||||
|---|---|---|---|---|---|---|---|---|
| Party | Candidate | Votes | % | ±% | ||||
| Liberal | Sergio Marchi | 25,356 | 79.8 | +20.2 | ||||
| Reform | Bruce A. Castleman | 3,385 | 10.7 | -8.4 | ||||
| Progressive Conservative | Marguerite Bebluk | 1,506 | 4.7 | -14.3 | ||||
| New Democratic | Rosanne Giulietti | 1,074 | 3.4 | -14.8 | ||||
| Natural Law | Claudio Paolini | 209 | 0.7 | |||||
| Marxist–Leninist | Jean-Paul Bédard | 164 | 0.5 | |||||
| Abolitionist | Ljiljana Medjedovic | 82 | 0.3 | |||||
| Total valid votes | 31,776 | 100.0 | ||||||
| 1988 Canadian federal election | ||||||||
|---|---|---|---|---|---|---|---|---|
| Party | Candidate | Votes | % | ±% | ||||
| Liberal | Sergio Marchi | 19,936 | 59.6 | +15.0 | ||||
| Progressive Conservative | Elizabeth Smith | 6,368 | 19.1 | -11.8 | ||||
| New Democratic | Alice Lambrinos | 6,088 | 18.2 | -3.8 | ||||
| Libertarian | Roma Kelembet | 498 | 1.5 | +0.7 | ||||
| Independent | Sherland R. Chhangur | 270 | 0.8 | |||||
| Independent | Gary Robert Walsh | 145 | 0.4 | |||||
| Communist | Jack C. Sweet | 119 | 0.4 | 0.0 | ||||
| Total valid votes | 33,424 | 100.0 | ||||||
| 1984 Canadian federal election | ||||||||
|---|---|---|---|---|---|---|---|---|
| Party | Candidate | Votes | % | ±% | ||||
| Liberal | Sergio Marchi | 17,629 | 44.6 | -12.2 | ||||
| Progressive Conservative | Frank Di Giorgio | 12,218 | 30.9 | +12.0 | ||||
| New Democratic | Bruno Pasquantonio | 8,718 | 22.0 | -1.5 | ||||
| Libertarian | Dusan Kubias | 335 | 0.8 | +0.3 | ||||
| Independent | Anna Esposito | 279 | 0.7 | |||||
| Green | Jutta I. Keylwerth | 238 | 0.6 | |||||
| Communist | Jack C. Sweet | 147 | 0.4 | +0.3 | ||||
| Total valid votes | 39,564 | 100.0 | ||||||
| 1980 Canadian federal election | ||||||||
|---|---|---|---|---|---|---|---|---|
| Party | Candidate | Votes | % | ±% | ||||
| Liberal | James Fleming | 21,385 | 56.8 | +9.7 | ||||
| New Democratic | Elio Costa | 8,884 | 23.6 | -3.4 | ||||
| Progressive Conservative | Don Cleveland | 7,101 | 18.8 | -6.0 | ||||
| Libertarian | Scott Hughes | 194 | 0.5 | -0.1 | ||||
| Communist | Nan McDonald | 85 | 0.2 | -0.2 | ||||
| Marxist–Leninist | Dagmar M. Rappold | 29 | 0.1 | -0.1 | ||||
| Total valid votes | 37,678 | 100.0 | ||||||
| 1979 Canadian federal election | ||||||||
|---|---|---|---|---|---|---|---|---|
| Party | Candidate | Votes | % | ±% | ||||
| Liberal | James Fleming | 18,410 | 47.0 | -5.9 | ||||
| Progressive Conservative | Robert Michener | 10,572 | 27.0 | +1.1 | ||||
| New Democratic | Elio Costa | 9,712 | 24.8 | +5.7 | ||||
| Libertarian | Dan A. Kornitzer | 246 | 0.6 | |||||
| Communist | Gordon Flowers | 151 | 0.4 | +0.1 | ||||
| Marxist–Leninist | Dagmar M. Rappold | 54 | 0.1 | 0.0 | ||||
| Total valid votes | 39,145 | 100.0 | ||||||
| 1974 Canadian federal election | ||||||||
|---|---|---|---|---|---|---|---|---|
| Party | Candidate | Votes | % | ±% | ||||
| Liberal | James Fleming | 28,075 | 52.9 | +13.4 | ||||
| Progressive Conservative | John Hanna | 13,734 | 25.9 | -0.7 | ||||
| New Democratic | Freda Hawkins | 10,139 | 19.1 | -13.9 | ||||
| Independent | Jim Laxer1 | 674 | 1.3 | |||||
| Independent | Thomas Frazer | 215 | 0.4 | |||||
| Communist | George Harris | 134 | 0.3 | |||||
| Marxist–Leninist | Christine A. Nugent | 71 | 0.1 | |||||
| Total valid votes | 53,042 | 100.0 | ||||||
1 Movement for an Independent Socialist Canada
| 1972 Canadian federal election | ||||||||
|---|---|---|---|---|---|---|---|---|
| Party | Candidate | Votes | % | ±% | ||||
| Liberal | James Fleming | 22,270 | 39.5 | -5.3 | ||||
| New Democratic | Val Scott | 18,639 | 33.1 | -2.5 | ||||
| Progressive Conservative | Clem Nusca | 14,997 | 26.6 | +8.3 | ||||
| Social Credit | David Horwood | 237 | 0.4 | |||||
| Independent | John Bizzell | 167 | 0.3 | |||||
| Independent | Sean Daly | 84 | 0.1 | |||||
| Total valid votes | 56,394 | 100.0 | ||||||
| 1968 Canadian federal election | ||||||||
|---|---|---|---|---|---|---|---|---|
| Party | Candidate | Votes | % | ±% | ||||
| Liberal | Philip G. Givens | 20,416 | 44.8 | -2.9 | ||||
| New Democratic | Val Scott | 16,204 | 35.6 | +12.7 | ||||
| Progressive Conservative | Wes Boddington | 8,344 | 18.3 | -11.2 | ||||
| Independent | Norman Gunn | 442 | 1.0 | |||||
| Communist | William Kashtan | 155 | 0.3 | |||||
| Total valid votes | 45,561 | 100.0 | ||||||
| 1965 Canadian federal election | ||||||||
|---|---|---|---|---|---|---|---|---|
| Party | Candidate | Votes | % | ±% | ||||
| Liberal | Robert H. Winters | 43,807 | 47.7 | -3.7 | ||||
| Progressive Conservative | George Hogan | 27,071 | 29.5 | -0.9 | ||||
| New Democratic | Martha Brewin | 20,993 | 22.9 | +5.5 | ||||
| Total valid votes | 91,871 | 100.0 | ||||||
| 1963 Canadian federal election | ||||||||
|---|---|---|---|---|---|---|---|---|
| Party | Candidate | Votes | % | ±% | ||||
| Liberal | Red Kelly | 41,480 | 51.4 | +9.1 | ||||
| Progressive Conservative | Alan Eagleson | 24,479 | 30.3 | -6.9 | ||||
| New Democratic | David Middleton | 14,003 | 17.4 | -1.4 | ||||
| Social Credit | David R. Milne | 697 | 0.9 | -0.7 | ||||
| Total valid votes | 80,659 | 100.0 | ||||||
| 1962 Canadian federal election | ||||||||
|---|---|---|---|---|---|---|---|---|
| Party | Candidate | Votes | % | ±% | ||||
| Liberal | Red Kelly | 32,362 | 42.4 | +15.0 | ||||
| Progressive Conservative | John B. Hamilton | 28,467 | 37.3 | -22.8 | ||||
| New Democratic | David Middleton | 14,356 | 18.8 | +7.4 | ||||
| Social Credit | David R. Milne | 1,205 | 1.6 | +0.5 | ||||
| Total valid votes | 76,390 | 100.0 | ||||||
Note: NDP vote is compared to CCF vote in 1958 election.
| 1958 Canadian federal election | ||||||||
|---|---|---|---|---|---|---|---|---|
| Party | Candidate | Votes | % | ±% | ||||
| Progressive Conservative | John B. Hamilton | 34,208 | 60.1 | +4.6 | ||||
| Liberal | Jack Bell | 15,589 | 27.4 | -0.7 | ||||
| Co-operative Commonwealth | Rose Sark | 6,502 | 11.4 | -2.1 | ||||
| Social Credit | David R. Milne | 612 | 1.1 | -1.7 | ||||
| Total valid votes | 56,911 | 100.0 | ||||||
| 1957 Canadian federal election | ||||||||
|---|---|---|---|---|---|---|---|---|
| Party | Candidate | Votes | % | ±% | ||||
| Progressive Conservative | John B. Hamilton | 27,035 | 55.5 | +10.2 | ||||
| Liberal | Jack Bell | 13,665 | 28.1 | -8.1 | ||||
| Co-operative Commonwealth | Rose Sark | 6,600 | 13.6 | -3.9 | ||||
| Social Credit | Frank V. Russell | 1,368 | 2.8 | |||||
| Total valid votes | 48,668 | 100.0 | ||||||
| By-election on September 8, 1954 | ||||||
| Party | Candidate | Votes | % | ±% | ||
|---|---|---|---|---|---|---|
| Progressive Conservative | John B. Hamilton | 12,228 | 45.3 | +3.8 | ||
| Liberal | Robert M. Campbell | 9,768 | 36.2 | +1.4 | ||
| Co-operative Commonwealth | Bruce William Evans | 4,711 | 17.5 | -4.8 | ||
| Labor–Progressive | Leslie Tom Morris | 282 | 1.0 | -0.4 | ||
| Total valid votes | 26,989 | 100.0 | ||||
| 1953 Canadian federal election | ||||||||
|---|---|---|---|---|---|---|---|---|
| Party | Candidate | Votes | % | ±% | ||||
| Progressive Conservative | Rodney Adamson | 12,228 | 41.5 | +3.4 | ||||
| Liberal | Robert M. Campbell | 10,262 | 34.8 | -2.3 | ||||
| Co-operative Commonwealth | Charles Hibbert Millard | 6,569 | 22.3 | -2.5 | ||||
| Labor–Progressive | Harry Hunter | 417 | 1.4 | |||||
| Total valid votes | 29,476 | 100.0 | ||||||
| 1949 Canadian federal election | ||||||||
|---|---|---|---|---|---|---|---|---|
| Party | Candidate | Votes | % | ±% | ||||
| Progressive Conservative | Rodney Adamson | 19,184 | 38.1 | -3.1 | ||||
| Liberal | Kenneth Thompson | 18,689 | 37.1 | +0.9 | ||||
| Co-operative Commonwealth | Murray S. Kernighan | 12,498 | 24.8 | +4.7 | ||||
| Total valid votes | 50,371 | 100.0 | ||||||
| 1945 Canadian federal election | ||||||||
|---|---|---|---|---|---|---|---|---|
| Party | Candidate | Votes | % | ±% | ||||
| Progressive Conservative | Rodney Adamson | 14,703 | 41.2 | -3.4 | ||||
| Liberal | Chris. J. Bennett | 12,947 | 36.2 | -6.0 | ||||
| Co-operative Commonwealth | Murray S. Kernighan | 7,183 | 20.1 | +6.9 | ||||
| Labor–Progressive | Alexander Whyte Welch | 886 | 2.5 | -97.5 | ||||
| Total valid votes | 35,719 | 100.0 | ||||||
Note: Progressive Conservative vote is compared to "National Government" vote in 1940 election.
| 1940 Canadian federal election | ||||||||
|---|---|---|---|---|---|---|---|---|
| Party | Candidate | Votes | % | ±% | ||||
| Conservative | Rodney Adamson | 12,788 | 44.6 | +12.9 | ||||
| Liberal | Chris. J. Bennett | 12,117 | 42.2 | +10.3 | ||||
| Co-operative Commonwealth | David Lewis | 3,787 | 13.2 | -6.4 | ||||
| Total valid votes | 28,692 | 100.0 | ||||||
Note: "National Government" vote is compared to Conservative vote in 1935 election.
| 1935 Canadian federal election | ||||||||
|---|---|---|---|---|---|---|---|---|
| Party | Candidate | Votes | % | ±% | ||||
| Liberal | J.E.L. Streight | 8,198 | 31.9 | -3.4 | ||||
| Conservative | Peter Laurie Brown | 8,138 | 31.7 | -33.0 | ||||
| Co-operative Commonwealth | Frederick Merriott Fish | 5,049 | 19.6 | |||||
| Reconstruction | Harry Herbert Hallatt | 4,319 | 16.8 | |||||
| Total valid votes | 25,704 | 100.0 | ||||||
| 1930 Canadian federal election | ||||||||
|---|---|---|---|---|---|---|---|---|
| Party | Candidate | Votes | % | ±% | ||||
| Conservative | James Earl Lawson | 20,843 | 64.7 | -13.2 | ||||
| Liberal | William Arthur Edwards | 11,368 | 35.3 | +13.2 | ||||
| Total valid votes | 32,211 | 100.0 | ||||||
Note: popular vote compared to vote in 1926 election.
| By-election on October 29, 1928 | |||||
| Party | Candidate | Votes | |||
|---|---|---|---|---|---|
| Conservative | James Earl Lawson | Acc. | |||
| 1926 Canadian federal election | ||||||||
|---|---|---|---|---|---|---|---|---|
| Party | Candidate | Votes | % | ±% | ||||
| Conservative | Henry Lumley Drayton | 16,479 | 77.9 | +2.1 | ||||
| Liberal | Alfred Taylour Hunter | 4,681 | 22.1 | -2.1 | ||||
| Total valid votes | 21,160 | 100.0 | ||||||
| 1925 Canadian federal election | ||||||||
|---|---|---|---|---|---|---|---|---|
| Party | Candidate | Votes | % | ±% | ||||
| Conservative | Henry Lumley Drayton | 23,637 | 75.8 | +30.6 | ||||
| Liberal | Alexander MacGregor | 7,536 | 24.2 | -16.7 | ||||
| Total valid votes | 31,173 | 100.0 | ||||||
| 1921 Canadian federal election | ||||||||
|---|---|---|---|---|---|---|---|---|
| Party | Candidate | Votes | % | ±% | ||||
| Conservative | Henry Lumley Drayton | 8,850 | 45.3 | -35.4 | ||||
| Liberal | J.E.L. Streight | 7,989 | 40.9 | +21.6 | ||||
| Progressive | James Alexander Cameron | 2,710 | 13.9 | |||||
| Total valid votes | 19,549 | 100.0 | ||||||
Note: Conservative vote is compared to Government vote in 1917 election, and Liberal vote is compared to Opposition vote.
| 1917 Canadian federal election | ||||||||
|---|---|---|---|---|---|---|---|---|
| Party | Candidate | Votes | % | |||||
| Government (Unionist) | Thomas George Wallace | 11,930 | 80.7 | |||||
| Opposition (Laurier Liberals) | Frank Denton | 2,856 | 19.3 | |||||
| Total valid votes | 14,786 | 100.0 | ||||||
York West, 1867–1904
| By-election on January 15, 1902 | ||||||
| Party | Candidate | Votes | % | ±% | ||
|---|---|---|---|---|---|---|
| Liberal | Archibald Campbell | 4,348 | 50.6 | +5.0 | ||
| Conservative | T.F. Wallace | 4,237 | 49.4 | -5.0 | ||
| Total valid votes | 8,585 | 100.0 | ||||
| 1900 Canadian federal election | ||||||||
|---|---|---|---|---|---|---|---|---|
| Party | Candidate | Votes | % | ±% | ||||
| Conservative | Nathaniel Clarke Wallace | 5,126 | 54.3 | -31.5 | ||||
| Liberal | Archibald Campbell | 4,306 | 45.7 | |||||
| Total valid votes | 9,432 | 100.0 | ||||||
| 1896 Canadian federal election | ||||||||
|---|---|---|---|---|---|---|---|---|
| Party | Candidate | Votes | % | ±% | ||||
| Conservative | Nathaniel Clarke Wallace | 5,018 | 74.8 | +18.2 | ||||
| Patrons of Industry | John Brown | 950 | 14.2 | |||||
| Conservative | James Platt | 745 | 11.1 | |||||
| Total valid votes | 6,713 | 100.0 | ||||||
Note: popular vote compared to vote in 1891 general election.
| By-election on December 21, 1892 | |||||
| Party | Candidate | Votes | |||
|---|---|---|---|---|---|
| Conservative | Nathaniel Clarke Wallace | Acclaimed | |||
Resigned to accept appointment as Controller of Customs but re-offered
| 1891 Canadian federal election | ||||||||
|---|---|---|---|---|---|---|---|---|
| Party | Candidate | Votes | % | ±% | ||||
| Conservative | Nathaniel Clarke Wallace | 3,434 | 56.6 | +1.1 | ||||
| Liberal | W.H.P. Clement | 2,628 | 43.4 | -1.1 | ||||
| Total valid votes | 6,062 | 100.0 | ||||||
| 1887 Canadian federal election | ||||||||
|---|---|---|---|---|---|---|---|---|
| Party | Candidate | Votes | % | ±% | ||||
| Conservative | Nathaniel Clarke Wallace | 2,638 | 55.6 | +1.5 | ||||
| Liberal | Adam Maconchy Lynd | 2,110 | 44.4 | |||||
| Total valid votes | 4,748 | 100.0 | ||||||
| 1882 Canadian federal election | ||||||||
|---|---|---|---|---|---|---|---|---|
| Party | Candidate | Votes | % | ±% | ||||
| Conservative | Nathaniel Clarke Wallace | 1,561 | 54.1 | 0.0 | ||||
| Independent | Thos. Hodgins | 1,324 | 45.9 | |||||
| Total valid votes | 2,885 | 100.0 | ||||||
| 1878 Canadian federal election | ||||||||
|---|---|---|---|---|---|---|---|---|
| Party | Candidate | Votes | % | ±% | ||||
| Conservative | Nathaniel Clarke Wallace | 1,326 | 54.1 | +22.4 | ||||
| Liberal | David Blain | 1,124 | 45.9 | -22.4 | ||||
| Total valid votes | 2,450 | 100.0 | ||||||
| 1874 Canadian federal election | ||||||||
|---|---|---|---|---|---|---|---|---|
| Party | Candidate | Votes | % | ±% | ||||
| Liberal | David Blain | 983 | 68.3 | +12.2 | ||||
| Conservative | N. Wallace | 456 | 31.7 | |||||
| Total valid votes | 1,439 | 100.0 | ||||||
| 1872 Canadian federal election | ||||||||
|---|---|---|---|---|---|---|---|---|
| Party | Candidate | Votes | % | ±% | ||||
| Liberal | David Blain | 973 | 56.1 | -16.3 | ||||
| Unknown | W. Tyrrell | 760 | 43.9 | |||||
| Total valid votes | 1,733 | 100.0 | ||||||
| By-election on August 14, 1868 | ||||||
| Party | Candidate | Votes | % | ±% | ||
|---|---|---|---|---|---|---|
| Liberal | Amos Wright | 654 | 72.4 | |||
| Unknown | John Bell | 249 | 27.6 | |||
| Total valid votes | 903 | 100.0 | ||||
| 1867 Canadian federal election | ||||||||
|---|---|---|---|---|---|---|---|---|
| Party | Candidate | Votes | % | |||||
| Liberal–Conservative | William Pierce Howland | 810 | 73.2 | |||||
| Unknown | H. S. Hubertus | 297 | 26.8 | |||||
| Unknown | David Blain | 0 | 0.0 | |||||
| Total valid votes | 1,107 | 100.0 | ||||||
References
- "(Code 35106) Census Profile". 2011 census. Statistics Canada. 2012. Retrieved 2011-03-03.
Notes
- Statistics Canada: 2011
- Statistics Canada: 2011
- http://www.parl.gc.ca/HousePublications/Publication.aspx?Language=E&Mode=1&DocId=6654879&File=4
- "List of confirmed candidates". Elections Canada. Retrieved October 4, 2019.
- "Election Night Results". Elections Canada. Retrieved November 4, 2019.
- Elections Canada – Confirmed candidates for Humber River—Black Creek, 30 September 2015
- Elections Canada – Preliminary Election Expenses Limits for Candidates Archived 2015-08-15 at the Wayback Machine
External links
- Riding history 1867-1903 from the Library of Parliament
- Riding history 1914-2008 from the Library of Parliament
- 2011 results from Elections Canada
- 2011 Results from Elections Canada
- Campaign expense data from Elections Canada