Brampton—Springdale
Brampton—Springdale is a federal electoral district in Ontario, Canada, that was represented in the House of Commons of Canada from 2004 until 2015, when it was abolished after the 2012 federal electoral redistribution.
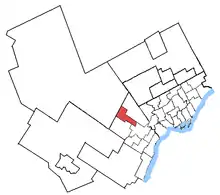 Brampton—Springdale in relation to other Ontario electoral districts | |
| Defunct federal electoral district | |
| Legislature | House of Commons |
| District created | 2003 |
| District abolished | 2013 |
| First contested | 2004 |
| Last contested | 2011 |
| District webpage | profile, map |
| Demographics | |
| Population (2011)[1] | 149,130 |
| Electors (2011) | 84,239 |
| Area (km²)[2] | 55.35 |
| Census division(s) | Peel |
| Census subdivision(s) | Brampton |
History
It was created in 2003 from Bramalea—Gore—Malton—Springdale and from Brampton Centre. It had a population of 116,775 in 2001 and an area of 59 km2. It consisted of the neighbourhoods of Snelgrove, the Villages of Heart Lake, Springdale (Brampton), Sandringham (Brampton), Madoc (Brampton)] and Bramalea Woods. Its last Member of Parliament was Parm Gill of the Conservative Party of Canada.
Member of Parliament
The riding has elected the following Members of Parliament:
| Parliament | Years | Member | Party | |
|---|---|---|---|---|
| Riding created from Bramalea—Gore—Malton—Springdale and Brampton Centre |
||||
| 38th | 2004–2006 | Ruby Dhalla | Liberal | |
| 39th | 2006–2008 | |||
| 40th | 2008–2011 | |||
| 41st | 2011–2015 | Parm Gill | Conservative | |
| Riding dissolved into Brampton Centre, Brampton North and Brampton East |
||||
Election results
.png.webp)
Map of Brampton-Springdale
| 2011 Canadian federal election | ||||||||
|---|---|---|---|---|---|---|---|---|
| Party | Candidate | Votes | % | ±% | Expenditures | |||
| Conservative | Parm Gill | 24,618 | 48.26 | +8.94 | ||||
| Liberal | Ruby Dhalla | 14,221 | 27.88 | -13.15 | ||||
| New Democratic | Manjit Grewal | 10,022 | 19.65 | +8.08 | ||||
| Green | Mark Hoffberg | 1,926 | 3.78 | -3.98 | ||||
| Communist | Liz Rowley | 219 | 0.43 | +0.14 | ||||
| Total valid votes | 51,006 | 100.00 | ||||||
| Total rejected ballots | 364 | 0.71 | -0.21 | |||||
| Turnout | 51,370 | 58.94 | +4.70 | |||||
| Eligible voters | 87,158 | – | – | |||||
| 2008 Canadian federal election | ||||||||
|---|---|---|---|---|---|---|---|---|
| Party | Candidate | Votes | % | ±% | Expenditures | |||
| Liberal | Ruby Dhalla | 18,577 | 41.03 | −6.3 | $80,011 | |||
| Conservative | Parm Gill | 17,804 | 39.32 | +5.5 | $86,444 | |||
| New Democratic | Mani Singh | 5,238 | 11.57 | −6.1 | $21,152 | |||
| Green | Dave Finlay | 3,516 | 7.76 | +3.9 | $746 | |||
| Communist | Dimitrios Kabitsis | 135 | 0.29 | +0.1 | $407 | |||
| Total valid votes/Expense Limit | 45,270 | 100.0 | – | $87,594 | ||||
| Total rejected ballots | 419 | 0.92 | ||||||
| Turnout | 45,689 | 54.24 | −7.0 | |||||
| Electors on the lists | 84,239 | |||||||
| 2006 Canadian federal election | ||||||||
|---|---|---|---|---|---|---|---|---|
| Party | Candidate | Votes | % | ±% | Expenditures | |||
| Liberal | Ruby Dhalla | 22,294 | 47.3 | −0.4 | $74,424 | |||
| Conservative | Sam Hundal | 14,492 | 30.8 | +3.3 | $67,020 | |||
| New Democratic | Anna Mather | 8,345 | 17.7 | −2.2 | $13,867 | |||
| Green | Ian Raymond Chiocchio | 1,853 | 3.9 | −0.8 | $1,280 | |||
| Communist | U.J.W. Rallage | 110 | 0.2 | – | $1,108 | |||
| Total valid votes | 47,094 | 100.0 | ||||||
| Total rejected ballots | 220 | 0.5 | ||||||
| Turnout | 47,314 | 61.2 | +6.3 | |||||
| Electors on the lists | 77,368 | |||||||
| Sources: Official Results, Elections Canada and Financial Returns, Elections Canada. | ||||||||
| 2004 Canadian federal election | ||||||||
|---|---|---|---|---|---|---|---|---|
| Party | Candidate | Votes | % | Expenditures | ||||
| Liberal | Ruby Dhalla | 19,385 | 47.7 | $61,377 | ||||
| Conservative | Sam Hundal | 11,182 | 27.5 | $72,905 | ||||
| New Democratic | Kathy Pounder | 8,038 | 19.8 | $12,009 | ||||
| Green | Nick Hudson | 1,927 | 4.7 | $944 | ||||
| Communist | Gurdev Singh Mattu | 86 | 0.2 | $599 | ||||
| Total valid votes | 40,618 | 100.0 | ||||||
| Total rejected ballots | 294 | 0.7 | ||||||
| Turnout | 40,912 | 54.9 | ||||||
| Electors on the lists | 74,591 | |||||||
| Percentage change figures are factored for redistribution. Conservative Party percentages are contrasted with the combined Canadian Alliance and Progressive Conservative percentages from 2000. | ||||||||
| Official Results, Elections Canada and Financial Returns, Elections Canada. | ||||||||
References
- "(Code 35007) Census Profile". 2011 census. Statistics Canada. 2012. Retrieved 2012-03-01.
- 2004-2008 Election results from the Library of Parliament website
- 2011 Results from Elections Canada
- Campaign expenses from Elections Canada website
This article is issued from Wikipedia. The text is licensed under Creative Commons - Attribution - Sharealike. Additional terms may apply for the media files.