Willowdale (electoral district)
Willowdale is a federal electoral district in Toronto, Ontario, Canada. It has been represented in the House of Commons of Canada since 1979.
.png.webp) Willowdale in relation to the other Toronto ridings (2013 boundaries) | |||
| Federal electoral district | |||
| Legislature | House of Commons | ||
| MP |
Liberal | ||
| District created | 1976 | ||
| First contested | 1979 | ||
| Last contested | 2019 | ||
| District webpage | profile, map | ||
| Demographics | |||
| Population (2011)[1] | 109,680 | ||
| Electors (2015) | 74,205 | ||
| Area (km²)[2] | 21 | ||
| Pop. density (per km²) | 5,222.9 | ||
| Census division(s) | Toronto | ||
| Census subdivision(s) | Toronto | ||
.gif)
For a long time this riding was considered a Liberal stronghold, having been won by the Liberal Party of Canada in all but one election since 1980. Longtime Liberal MP Jim Peterson was the riding's MP from 1980 to 1984 and from 1988 to 2007, and Martha Hall Findlay was the riding MP from 2008 to 2011. Long considered a safe Liberal seat, Conservative candidate Chungsen Leung won by 932 votes on the May 2, 2011 federal election. In the 2015 federal election, the seat returned to the Liberal Party with Ali Ehsassi unseating Leung. This district is home to some landmarks like Mel Lastman Square, the Toronto Centre for the Arts and the Claude Watson School for the Arts.
Geography
Consisting of that part of the City of Toronto described as follows: commencing at the intersection of the northerly limit of said city with Bayview Avenue; thence southerly along said avenue to Highway No. 401; thence generally southwesterly along said highway to the Don River West Branch; thence generally northwesterly along said branch to Bathurst Street; thence northerly along said street to the northerly limit of said city; thence easterly along said limit to the point of commencement.[3]
The riding contains the neighbourhoods of Willowdale, Lansing, Newtonbrook and North York Centre.
Demographics
- According to the Canada 2011 Census; 2013 representation[4][5]
Languages: 35.7% English, 19.1% Chinese, 9.8% Persian, 9.2% Korean, 5.8% Russian, 2.6% Tagalog, 1.7% Italian, 1.6% Spanish, 1.3% French, 1.2% Arabic
Religions: 46.0% Christian (20.6% Catholic, 4.3% Christian Orthodox, 3.2% Presbyterian, 2.4% United Church, 2.4% Anglican, 1.8% Baptist, 6.5% Pentecostal, 11.3% Other), 11.6% Muslim, 6.6% Jewish, 2.9% Buddhist, 1.8% Hindu, 30.4% No religion
Median income (2010): $26,200
Average income (2010): $42,045
As per the 2016 Census, Willowdale has highest percentage of ethnic Iranians (12.1%) and ethnic Koreans (10.6%) of all City of Toronto ridings, and is one of the only four ridings with Chinese being the most frequent ethnic origin. At the same vein, it is the City of Toronto riding with the highest percentage of people belonging to the West Asian (10.9%) and Korean (10.3%) visible minorities.
Ethnicity groups: White: 33.1%, Chinese: 25.3%, West Asian: 10.9%, Korean: 10.3%, South Asian: 5.9%, Filipino: 5.4%
Ethnic origins: Chinese 25.9%, Iranian 12.1%, Korean 10.6%, English 6.4%, Filipino 5.8%, Canadian 5.6%, Russian 5.2%
History
The riding was created in 1976 from part of Eglinton, York North and York Centre.
Willowdale consisted initially of the part of the Borough of North York bounded on the north by the borough limit (Steeles Avenue), on the West by the West Branch of the Don River and Bathurst Street, on the south by Highway 401, and on the east by Bayview Avenue.
In 1987, it was redefined to consist of the part of the City of North York bounded on the north by the borough limits (Steeles Avenue), and on the east, south and west by a line drawn from the borough limit southeast along the Don River West Branch, south along Bayview Avenue, east along Finch Avenue East, south along the Don River East Branch, west along Highway 401, and northwest along the Don River West Branch to the borough limit.
In 1996, it was redefined to consist of the part of the City of North York bounded on the north by the borough limits (Steeles Avenue), and on the east, south and west by a line drawn from the borough limit south along the eastern limit of the city, west along the hydro-electric transmission line situated south of McNicoll Avenue, south along Highway 404, west along Finch Avenue East, south along the Don River East Branch, west along Highway 401, northwest along the Don River West Branch, north along Bathurst Street, east along Drewry Avenue, north along Chelmsford Avenue, west along Greenwin Village Road, and north along Village Gate to the northern city limit.
In 2003, it was redefined to consist of that part of the City of Toronto described as follows: commencing at the intersection of the northerly limit of said city with Victoria Park Avenue; thence southerly along said avenue to the hydroelectric transmission line situated northerly of Apache Trail; thence southwesterly along said transmission line to Highway No. 404; thence southerly along said highway to Finch Avenue East; thence generally westerly along said avenue to Leslie Street; thence southerly along said street to Highway No. 401; thence generally southwesterly along said highway to the Don River West Branch; thence generally northwesterly along said branch to Bathurst Street; thence northerly along said street to the hydroelectric transmission line situated northerly of Finch Avenue West; thence generally easterly along said transmission line to Yonge Street; thence northerly along said street to the northerly limit of said city; thence easterly along said limit to the point of commencement.
This riding lost territory (36%) to Don Valley North, and gained territory from York Centre (16%) during the 2012 electoral redistribution. The reduction in land area of the riding was primarily facilitated by substantial population growth along Yonge Street where the on-going redevelopment of land into additional high-rise residential buildings continued with medium-density development (low-rise residential buildings and townhomes) occurring slightly further from Yonge Street and along Sheppard and Finch Avenues. The portion of the City of Toronto north of Highway 401 and east of Victoria Park Avenue (the former boundary with Scarborough) was allocated an additional riding now having five ridings versus the previous four.
Former boundaries
 1976 to 1987
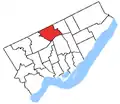 1987 to 1996
 1996 to 2003
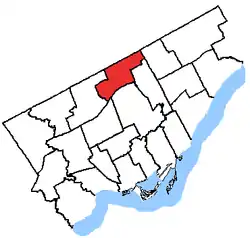 2003 to 2015
Members of Parliament
This riding has elected the following Members of Parliament:
| Parliament | Years | Member | Party | |
|---|---|---|---|---|
| Willowdale Riding created from Eglinton, York North and York Centre |
||||
| 31st | 1979–1980 | Bob Jarvis | Progressive Conservative | |
| 32nd | 1980–1984 | Jim Peterson | Liberal | |
| 33rd | 1984–1988 | John Oostrom | Progressive Conservative | |
| 34th | 1988–1993 | Jim Peterson | Liberal | |
| 35th | 1993–1997 | |||
| 36th | 1997–2000 | |||
| 37th | 2000–2004 | |||
| 38th | 2004–2006 | |||
| 39th | 2006–2007 | |||
| 2008–2008 | Martha Hall Findlay | |||
| 40th | 2008–2011 | |||
| 41st | 2011–2015 | Chungsen Leung | Conservative | |
| 42nd | 2015–2019 | Ali Ehsassi | Liberal | |
| 43rd | 2019–present | |||
Election results
| 2019 Canadian federal election | ||||||||
|---|---|---|---|---|---|---|---|---|
| Party | Candidate | Votes | % | ±% | Expenditures | |||
| Liberal | Ali Ehsassi | 22,282 | 49.0 | -4.4 | $103,868.26 | |||
| Conservative | Daniel Lee | 16,452 | 36.2 | -0.8 | $82,193.67 | |||
| New Democratic | Leah Kalsi | 4,231 | 9.3 | +2.3 | none listed | |||
| Green | Sharolyn Vettese | 1,671 | 3.7 | +1.5 | $0.00 | |||
| People's | Richard Hillier | 563 | 1.2 | - | $1,005.61 | |||
| Independent | Birinder Singh Ahluwalia | 200 | 0.4 | -0.1 | none listed | |||
| Independent | Shodja Ziaian | 71 | 0.2 | - | none listed | |||
| Total valid votes/Expense limit | 45,470 | 100.0 | ||||||
| Total rejected ballots | 410 | |||||||
| Turnout | 45,880 | 58.2 | ||||||
| Eligible voters | 78,809 | |||||||
| Source: Elections Canada[6][7] | ||||||||
| 2015 Canadian federal election | ||||||||
|---|---|---|---|---|---|---|---|---|
| Party | Candidate | Votes | % | ±% | Expenditures | |||
| Liberal | Ali Ehsassi | 24,519 | 53.4 | +13.5 | $89,151.49 | |||
| Conservative | Chungsen Leung | 16,990 | 37.0 | -4.7 | $135,960.85 | |||
| New Democratic | Pouyan Tabasinejad | 3,203 | 7.0 | -11.4 | $6,678.16 | |||
| Green | James Arruda | 1,025 | 2.2 | +1.81 | $7,484.51 | |||
| Independent | Birinder Singh Ahluwalia | 216 | 0.5 | – | $39,117.06 | |||
| Total valid votes/Expense limit | 45,953 | 100.0 | $207,725.33 | |||||
| Total rejected ballots | 251 | 0.5 | -0.1 | |||||
| Turnout | 46,204 | 61.46 | +3.06 | |||||
| Eligible voters | 75,172 | |||||||
| Liberal gain from Conservative | Swing | +9.1 | ||||||
| Source: Elections Canada[8][9] | ||||||||
| 2011 federal election redistributed results[10] | |||
|---|---|---|---|
| Party | Vote | % | |
| Conservative | 16,168 | 41.47 | |
| Liberal | 15,280 | 39.20 | |
| New Democratic | 7,383 | 18.94 | |
| Green | 152 | 0.39 | |
| 2011 Canadian federal election | ||||||||
|---|---|---|---|---|---|---|---|---|
| Party | Candidate | Votes | % | ±% | Expenditures | |||
| Conservative | Chungsen Leung | 22,207 | 41.7 | +9.2 | ||||
| Liberal | Martha Hall Findlay | 21,275 | 39.9 | -8.8 | ||||
| New Democratic | Mehdi Mollahasani | 9,777 | 18.4 | +8.2 | ||||
| Total valid votes/Expense limit | 53,259 | 100.0 | ||||||
| Total rejected ballots | 295 | 0.6 | +0.2 | |||||
| Turnout | 53,554 | 58.4 | +6.5 | |||||
| Eligible voters | 91,631 | – | – | |||||
| Conservative gain from Liberal | Swing | +9.0 | ||||||
| 2008 Canadian federal election | ||||||||
|---|---|---|---|---|---|---|---|---|
| Party | Candidate | Votes | % | ±% | Expenditures | |||
| Liberal | Martha Hall Findlay | 23,889 | 48.7 | -10.6 | $47,844.17 | |||
| Conservative | Jake Karns | 15,931 | 32.5 | +2.4 | $75,479.99 | |||
| New Democratic | Susan Wallace | 5,011 | 10.2 | +5.4 | $8,175.95 | |||
| Green | Lou Carcasole | 3,130 | 6.4 | +0.6 | $4,270.98 | |||
| Progressive Canadian | Bahman Roudgarnia | 864 | 1.8 | – | $4,500 | |||
| Independent | Bernadette Michael | 260 | 0.5 | $421.93 | ||||
| Total valid votes/Expense limit | 49,085 | 100.0 | $94,573.51 | |||||
| Total rejected ballots | 203 | 0.4 | ||||||
| Turnout | 49,288 | 51.9 | ||||||
| By-election on March 17, 2008 | ||||||
| Party | Candidate | Votes | % | ±% | ||
|---|---|---|---|---|---|---|
| Liberal | Martha Hall Findlay | 13,524 | 59.3 | +7.1 | ||
| Conservative | Maureen Harquail | 6,864 | 30.1 | +0.8 | ||
| Green | Lou Carcasole | 1,325 | 5.8 | +1.7 | ||
| New Democratic | Rini Ghosh | 1,084 | 4.8 | -6.6 | ||
| Total valid votes | 22,797 | 100.0 | $ | |||
| Liberal hold | Swing | +3.1 | ||||
| 2006 Canadian federal election | ||||||||
|---|---|---|---|---|---|---|---|---|
| Party | Candidate | Votes | % | ±% | Expenditures | |||
| Liberal | Jim Peterson | 30,623 | 55.2 | -6.2 | $77,156 | |||
| Conservative | Jovan Boseovski | 16,254 | 29.3 | +6.2 | $81,690 | |||
| New Democratic | Rochelle Carnegie | 6,297 | 11.4 | +1.8 | $12,532 | |||
| Green | Sharolyn Vettese | 2,268 | 4.1 | +0.4 | $5,067 | |||
| Total valid votes | 55,442 | 100.0 | ||||||
| Total rejected ballots | 216 | 0.4 | ||||||
| Turnout | 55,658 | 62.8 | ||||||
| Liberal hold | Swing | -7.7 | ||||||
| 2004 Canadian federal election | ||||||||
|---|---|---|---|---|---|---|---|---|
| Party | Candidate | Votes | % | ±% | ||||
| Liberal | Jim Peterson | 30,855 | 61.4 | +0.1 | ||||
| Conservative | Jovan Boseovski | 11,615 | 23.1 | -9.9 | ||||
| New Democratic | Yvonne Bobb | 4,812 | 9.6 | +4.2 | ||||
| Green | Sharolyn Vettese | 1,844 | 3.7 | |||||
| Progressive Canadian | Ardavan Behrouzi | 883 | 1.8 | |||||
| Independent | Bernadette Michael | 253 | 0.5 | |||||
| Total valid votes | 50,262 | 100.0 | ||||||
Note: Conservative vote is compared to the total of the Canadian Alliance vote and Progressive Conservative vote in 2000 election.
| 2000 Canadian federal election | ||||||||
|---|---|---|---|---|---|---|---|---|
| Party | Candidate | Votes | % | ±% | ||||
| Liberal | Jim Peterson | 27,038 | 61.3 | +3.0 | ||||
| Alliance | Kevyn Nightingale | 7,411 | 16.8 | +4.0 | ||||
| Progressive Conservative | Chungsen Leung | 7,134 | 16.2 | -5.3 | ||||
| New Democratic | Yvonne Bobb | 2,404 | 5.4 | -0.6 | ||||
| Marxist–Leninist | Roger Carter | 145 | 0.3 | |||||
| Total valid votes | 44,132 | 100.0 | ||||||
Note: Canadian Alliance vote is compared to the Reform vote in 1997 election.
| 1997 Canadian federal election | ||||||||
|---|---|---|---|---|---|---|---|---|
| Party | Candidate | Votes | % | ±% | ||||
| Liberal | Jim Peterson | 27,311 | 58.3 | -2.8 | ||||
| Progressive Conservative | Norm Gardner | 10,043 | 21.4 | +4.8 | ||||
| Reform | Peter Cobbold | 6,007 | 12.8 | -2.4 | ||||
| New Democratic | Mikael Swayze | 2,833 | 6.0 | +2.4 | ||||
| Natural Law | Don Murray | 268 | 0.6 | 0.0 | ||||
| Independent | Paul Coulbeck | 266 | 0.6 | |||||
| Canadian Action | Randall Whitcomb | 128 | 0.3 | |||||
| Total valid votes | 46,856 | 100.0 | ||||||
| 1993 Canadian federal election | ||||||||
|---|---|---|---|---|---|---|---|---|
| Party | Candidate | Votes | % | ±% | ||||
| Liberal | Jim Peterson | 28,372 | 61.0 | +14.0 | ||||
| Progressive Conservative | John Oostrom | 7,733 | 16.6 | -26.7 | ||||
| Reform | Gerry Welbourn | 7,052 | 15.2 | |||||
| New Democratic | Mary Maron | 1,682 | 3.6 | -5.2 | ||||
| National | Shelley Goldstein | 674 | 1.5 | |||||
| Green | Tom Salsberg | 461 | 1.0 | |||||
| Natural Law | Mike Dubinsky | 248 | 0.5 | |||||
| Independent | Owen Smith | 204 | 0.4 | |||||
| Abolitionist | Jewel McKenzie | 53 | 0.1 | |||||
| Total valid votes | 46,479 | 100.0 | ||||||
| 1988 Canadian federal election | ||||||||
|---|---|---|---|---|---|---|---|---|
| Party | Candidate | Votes | % | ±% | ||||
| Liberal | Jim Peterson | 24,230 | 47.0 | +4.2 | ||||
| Progressive Conservative | John Oostrom | 22,347 | 43.4 | -0.1 | ||||
| New Democratic | Anne Adelson | 4,517 | 8.8 | -4.3 | ||||
| Rhinoceros | Peeter Tammisto | 268 | 0.5 | |||||
| Libertarian | Hans Wienhold | 147 | 0.3 | -0.4 | ||||
| Total valid votes | 51,509 | 100.0 | ||||||
| 1984 Canadian federal election | ||||||||
|---|---|---|---|---|---|---|---|---|
| Party | Candidate | Votes | % | ±% | ||||
| Progressive Conservative | John Oostrom | 22,425 | 43.5 | +6.1 | ||||
| Liberal | Jim Peterson | 22,063 | 42.8 | -4.6 | ||||
| New Democratic | John Fagan | 6,711 | 13.0 | -1.7 | ||||
| Libertarian | George Graham | 329 | 0.6 | +0.3 | ||||
| Total valid votes | 51,528 | 100.0 | ||||||
| 1980 Canadian federal election | ||||||||
|---|---|---|---|---|---|---|---|---|
| Party | Candidate | Votes | % | ±% | ||||
| Liberal | Jim Peterson | 22,235 | 47.4 | +7.5 | ||||
| Progressive Conservative | Bob Jarvis | 17,527 | 37.4 | -7.4 | ||||
| New Democratic | Bob Hebdon | 6,889 | 14.7 | +0.4 | ||||
| Libertarian | Shannon Vale | 170 | 0.4 | -0.4 | ||||
| Marxist–Leninist | Rae Greig | 46 | 0.1 | 0.0 | ||||
| Total valid votes | 46,867 | 100.0 | ||||||
| 1979 Canadian federal election | ||||||||
|---|---|---|---|---|---|---|---|---|
| Party | Candidate | Votes | % | |||||
| Progressive Conservative | Bob Jarvis | 22,238 | 44.8 | |||||
| Liberal | Jim Peterson | 19,848 | 40.0 | |||||
| New Democratic | Chris Thurrott | 7,128 | 14.3 | |||||
| Libertarian | Robert Austin Leber | 391 | 0.8 | |||||
| Marxist–Leninist | Rae Greig | 71 | 0.1 | |||||
| Total valid votes | 49,676 | 100.0 | ||||||
References
- "(Code 35100) Census Profile". 2011 census. Statistics Canada. 2012. Retrieved 2011-03-03.
Notes
- Statistics Canada: 2011
- Statistics Canada: 2011
- "Willowdale - Maps Corner - Elections Canada Online". Elections Canada. Retrieved 28 August 2015.
- http://www12.statcan.gc.ca/nhs-enm/2011/dp-pd/prof/details/page.cfm?Lang=E&Geo1=FED2013&Code1=35115&Data=Count&SearchText=Willowdale&SearchType=Begins&SearchPR=01&A1=All&B1=All&Custom=&TABID=1
- http://www12.statcan.gc.ca/nhs-enm/2011/dp-pd/prof/details/page.cfm?Lang=E&Geo1=FED2013&Code1=35115&Data=Count&SearchText=Willowdale&SearchType=Begins&SearchPR=01&A1=All&B1=All&Custom=&TABID=1#tabs2
- "List of confirmed candidates". Elections Canada. Retrieved October 4, 2019.
- "Election Night Results". Elections Canada. Retrieved November 5, 2019.
- Elections Canada – Confirmed candidates for Willowdale, 30 September 2015
- Elections Canada – Preliminary Election Expenses Limits for Candidates
- Pundits' Guide to Canadian Elections
External links
- Riding history from the Library of Parliament
- 2011 results from Elections Canada
- Campaign expense data from Elections Canada