Essex (electoral district)
Essex (formerly known as Essex—Windsor) is a federal electoral district in Ontario, Canada, represented in the House of Commons of Canada from 1867 to 1882 and since 1968.
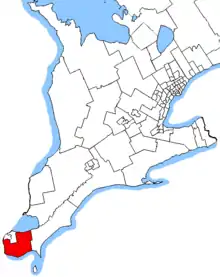 Essex in relation to other Ontario electoral districts | |||
| Federal electoral district | |||
| Legislature | House of Commons | ||
| MP |
Conservative | ||
| District created | 1966 | ||
| First contested | 1968 | ||
| Last contested | 2019 | ||
| District webpage | profile, map | ||
| Demographics | |||
| Population (2016)[1] | 125,442 | ||
| Electors (2015) | 90,591 | ||
| Area (km²)[2] | 1,177 | ||
| Pop. density (per km²) | 106.6 | ||
| Census division(s) | Essex | ||
| Census subdivision(s) | Amherstburg, Essex, Kingsville, Lakeshore, LaSalle | ||
Geography
The riding includes the Municipalities of LaSalle, Amherstburg, Essex, Kingsville, and the western/central portion of Lakeshore. See Elections Canada map.[3]
History
Essex was created in the British North America Act of 1867. It consisted of Essex County. It was abolished in 1882 when it was redistributed into Essex North and Essex South ridings.
Essex was re-created in 1966 from Essex East, Essex South and Essex West. The new riding consisted initially of the Town of Essex, the Townships of Anderdon, Colchester North, Colchester South, Malden, Rochester, Sandwich South, Tilbury North and Tilbury West, and the southern parts of the Township of Sandwich West and the City of Windsor, and the southeastern part of the Township of Maidstone. The name of the electoral district was changed in 1972 to "Essex—Windsor".
In 1976, the riding was re-defined to consist of the Townships of Anderdon, Colchester North, Maidstone, Malden, Rochester, Sandwich South, Sandwich West, Tilbury North and Tilbury West, including the Town of Essex, but excluding the Town of Tecumseh and the Village of St. Clair Beach, and the southeast part of the City of Windsor.
In 1987, the riding was re-defined to consist of the southeastern part of the City of Windsor, the towns of Amherstburg, Belle River and Essex, and the townships of Anderdon, Maidstone, Malden, Rochester, Sandwich South, Sandwich West, Tilbury North and Tilbury West.
Essex—Windsor was abolished in 1996 when it was re-distributed between a new "Essex" riding and Windsor West. The new Essex riding was created from parts of Essex—Windsor and Essex—Kent ridings.
It consisted initially of Pelee Island and the County of Essex excluding the City of Windsor, the towns of Leamington and Tecumseh, the Village of St. Clair Beach and the Township of Mersea. In 2003, it was redefined to consist of the County of Essex excluding the City of Windsor and the towns of Leamington and Tecumseh.
This riding lost territory to Chatham-Kent—Leamington during the 2012 electoral redistribution. Namely, Pelee Island and the eastern portion of the Town of Lakeshore.
Members of Parliament
This riding has elected the following Members of Parliament:
| Parliament | Years | Member | Party | |
|---|---|---|---|---|
| Essex | ||||
| 1st | 1867–1872 | John O'Connor | Conservative | |
| 2nd | 1872–1874 | |||
| 3rd | 1874–1878 | William McGregor | Liberal | |
| 4th | 1878–1882 | J.C. Patterson | Conservative | |
| Riding dissolved into Essex North and Essex South | ||||
| Essex Riding re-created from Essex East, Essex South and Essex West |
||||
| 28th | 1968–1972 | Eugene Whelan | Liberal | |
| Essex—Windsor | ||||
| 29th | 1972–1974 | Eugene Whelan | Liberal | |
| 30th | 1974–1979 | |||
| 31st | 1979–1980 | |||
| 32nd | 1980–1984 | |||
| 33rd | 1984–1988 | Steven W. Langdon | New Democratic | |
| 34th | 1988–1993 | |||
| 35th | 1993–1997 | Susan Whelan | Liberal | |
| Essex | ||||
| 36th | 1997–2000 | Susan Whelan | Liberal | |
| 37th | 2000–2004 | |||
| 38th | 2004–2006 | Jeff Watson | Conservative | |
| 39th | 2006–2008 | |||
| 40th | 2008–2011 | |||
| 41st | 2011–2015 | |||
| 42nd | 2015–2019 | Tracey Ramsey | New Democratic | |
| 43rd | 2019–present | Chris Lewis | Conservative | |
Election results
Essex 1996–present
| 2019 Canadian federal election | ||||||||
|---|---|---|---|---|---|---|---|---|
| Party | Candidate | Votes | % | ±% | Expenditures | |||
| Conservative | Chris Lewis | 28,274 | 41.4 | +5.86 | $80,950.70 | |||
| New Democratic | Tracey Ramsey | 23,603 | 34.6 | -6.92 | $117,072.74 | |||
| Liberal | Audrey Festeryga | 12,987 | 19.0 | -1.91 | $41,233.04 | |||
| Green | Jennifer Alderson | 2,173 | 3.2 | +1.28 | none listed | |||
| People's | Bill Capes | 1,251 | 1.8 | – | $4,604.15 | |||
| Total valid votes/Expense limit | 68,288 | 100.0 | ||||||
| Total rejected ballots | 450 | |||||||
| Turnout | 68,738 | 67.3 | ||||||
| Eligible voters | 102,153 | |||||||
| Conservative gain from New Democratic | Swing | +6.39 | ||||||
| Source: Elections Canada[4][5] | ||||||||
| 2015 Canadian federal election | ||||||||
|---|---|---|---|---|---|---|---|---|
| Party | Candidate | Votes | % | ±% | Expenditures | |||
| New Democratic | Tracey Ramsey | 25,072 | 41.42 | +6.52 | $106,087.64 | |||
| Conservative | Jeff Watson | 21,602 | 35.69 | -12.58 | $87,656.45 | |||
| Liberal | Audrey Festeryga | 12,639 | 20.88 | +6.62 | $78,480.89 | |||
| Green | Jennifer Alderson | 1,141 | 1.88 | -0.54 | – | |||
| Marxist–Leninist | Enver Villamizar | 77 | 0.13 | -0.02 | – | |||
| Total valid votes/Expense limit | 60,531 | 100.00 | $233,865.23 | |||||
| Total rejected ballots | 241 | 0.40 | – | |||||
| Turnout | 60,772 | 66.19 | – | |||||
| Eligible voters | 91,816 | |||||||
| New Democratic gain from Conservative | Swing | +9.55 | ||||||
| Source: Elections Canada[6][7] | ||||||||
| 2011 federal election redistributed results[8] | |||
|---|---|---|---|
| Party | Vote | % | |
| Conservative | 24,239 | 48.27 | |
| New Democratic | 17,528 | 34.90 | |
| Liberal | 7,162 | 14.26 | |
| Green | 1,217 | 2.42 | |
| Others | 73 | 0.15 | |
| 2011 Canadian federal election | ||||||||
|---|---|---|---|---|---|---|---|---|
| Party | Candidate | Votes | % | ±% | ||||
| Conservative | Jeff Watson | 25,327 | 48.1% | +8.1% | ||||
| New Democratic | Taras Natyshak | 18,538 | 35.2% | +8.6% | ||||
| Liberal | Nelson Santos | 7,465 | 14.2% | -14.9% | ||||
| Green | Cora Carriveau | 1,290 | 2.4% | -1.9% | ||||
| Marxist–Leninist | Enver Villamizar | 77 | 0.1% | -0.1% | ||||
| Total valid votes | 52,697 | 99.6% | ||||||
| Total rejected ballots | 233 | 0.4% | ||||||
| Total votes | 52,930 | 100.0% | ||||||
Source: Elections Canada
| 2008 Canadian federal election | ||||||||
|---|---|---|---|---|---|---|---|---|
| Party | Candidate | Votes | % | ±% | Expenditures | |||
| Conservative | Jeff Watson | 20,608 | 40.0% | -0.4% | $87,306 | |||
| Liberal | Susan Whelan | 14,973 | 29.1% | -5.0% | $87,544 | |||
| New Democratic | Taras Natyshak | 13,703 | 26.6% | +3.9% | $47,430 | |||
| Green | Richard Bachynsky | 2,234 | 4.3% | +1.6% | $0 | |||
| Total valid votes/Expense limit | 51,518 | 100.0% | $90,595 | |||||
| Total rejected ballots | 206 | |||||||
| Turnout | 51,724 | % | ||||||
| 2006 Canadian federal election | ||||||||
|---|---|---|---|---|---|---|---|---|
| Party | Candidate | Votes | % | ±% | ||||
| Conservative | Jeff Watson | 23,125 | 40.4% | +3.8% | ||||
| Liberal | Susan Whelan | 19,508 | 34.1% | -0.9% | ||||
| New Democratic | Taras Natyshak | 12,992 | 22.7% | -1.7% | ||||
| Green | James McVeity | 1,518 | 2.7% | -1.2% | ||||
| Marxist–Leninist | Robert Cruise | 108 | 0.2% | 0.0% | ||||
| Total valid votes | 57,251 | |||||||
| Total valid votes | 57,251 | 100.0% | ||||||
| 2004 Canadian federal election | ||||||||
|---|---|---|---|---|---|---|---|---|
| Party | Candidate | Votes | % | ±% | ||||
| Conservative | Jeff Watson | 18,755 | 36.6% | -4.9% | ||||
| Liberal | Susan Whelan | 17,926 | 35.0% | -9.4% | ||||
| New Democratic | David Tremblay | 12,519 | 24.4% | +10.5% | ||||
| Green | Paul Forman | 1,981 | 3.9% | |||||
| Marxist–Leninist | Robert Cruise | 105 | 0.2% | -0.1% | ||||
| Total valid votes | 51,286 | 100.0% | ||||||
Note: Conservative vote is compared to the total of the Canadian Alliance vote and Progressive Conservative vote in 2000 election.
| 2000 Canadian federal election | ||||||||
|---|---|---|---|---|---|---|---|---|
| Party | Candidate | Votes | % | ±% | ||||
| Liberal | Susan Whelan | 20,524 | 44.3% | -1.7% | ||||
| Alliance | Scott Cowan | 16,019 | 34.6% | +16.7% | ||||
| New Democratic | Marion Overholt | 6,431 | 13.9% | -15.7% | ||||
| Progressive Conservative | Merrill Baker | 3,175 | 6.9% | +0.4% | ||||
| Marxist–Leninist | Robert Cruise | 152 | 0.3% | |||||
| Total valid votes | 46,301 | 100.0% | ||||||
Note: Canadian Alliance vote is compared to the Reform vote in 1997 election.
| 1997 Canadian federal election | ||||||||
|---|---|---|---|---|---|---|---|---|
| Party | Candidate | Votes | % | ±% | ||||
| Liberal | Susan Whelan | 22,052 | 46.1% | -9.1% | ||||
| New Democratic | Gerry Bastien | 14,180 | 29.6% | +1.9% | ||||
| Reform | John Larsen | 8,545 | 17.9% | +4.7% | ||||
| Progressive Conservative | Dave Wylupek | 3,086 | 6.4% | +3.2% | ||||
| Total valid votes | 47,863 | 100.0% | ||||||
Essex—Windsor 1970–1996
| 1993 Canadian federal election | ||||||||
|---|---|---|---|---|---|---|---|---|
| Party | Candidate | Votes | % | ±% | ||||
| Liberal | Susan Whelan | 25,200 | 55.1% | +13.8% | ||||
| New Democratic | Steven W. Langdon | 12,650 | 27.7% | -16.4% | ||||
| Reform | John Larsen | 6,029 | 13.2% | |||||
| Progressive Conservative | Brian Payne | 1,481 | 3.2% | -11.1% | ||||
| National | George Opacic | 194 | 0.4% | |||||
| Marxist–Leninist | Paul Hawkins | 83 | 0.2% | |||||
| Commonwealth of Canada | Vlado Zugaj | 67 | 0.1% | |||||
| Total valid votes | 45,704 | 100.0% | ||||||
| 1988 Canadian federal election | ||||||||
|---|---|---|---|---|---|---|---|---|
| Party | Candidate | Votes | % | ±% | ||||
| New Democratic | Steven W. Langdon | 18,926 | 44.1% | +4.8% | ||||
| Liberal | Ray Robinet | 17,715 | 41.3% | +12.2% | ||||
| Progressive Conservative | Ted Aver | 6,154 | 14.3% | -17.3% | ||||
| Independent | Margaret Villamizar | 98 | 0.2% | |||||
| Total valid votes | 42,893 | 100.0% | ||||||
| 1984 Canadian federal election | ||||||||
|---|---|---|---|---|---|---|---|---|
| Party | Candidate | Votes | % | ±% | ||||
| New Democratic | Steven W. Langdon | 18,746 | 39.3% | -0.5% | ||||
| Progressive Conservative | John Martel | 15,073 | 31.6% | +22.9% | ||||
| Liberal | Brian Ducharme | 13,866 | 29.1% | -22.2% | ||||
| Total valid votes | 47,685 | 100.0% | ||||||
| 1980 Canadian federal election | ||||||||
|---|---|---|---|---|---|---|---|---|
| Party | Candidate | Votes | % | ±% | ||||
| Liberal | Eugene Whelan | 24,651 | 51.3% | +7.0% | ||||
| New Democratic | Steven W. Langdon | 19,123 | 39.8% | -0.7% | ||||
| Progressive Conservative | Kathy Flood | 4,184 | 8.7% | -6.2% | ||||
| Marxist–Leninist | Peter Ewart | 103 | 0.2% | -0.1% | ||||
| Total valid votes | 48,061 | 100.0% | ||||||
| 1979 Canadian federal election | ||||||||
|---|---|---|---|---|---|---|---|---|
| Party | Candidate | Votes | % | ±% | ||||
| Liberal | Eugene Whelan | 20,373 | 44.3% | -10.9% | ||||
| New Democratic | Steven W. Langdon | 18,603 | 40.4% | +5.0% | ||||
| Progressive Conservative | Kathy Flood | 6,875 | 14.9% | 5.6% | ||||
| Marxist–Leninist | Pete Ewart | 144 | 0.3% | |||||
| Total valid votes | 45,995 | 100.0% | ||||||
| 1974 Canadian federal election | ||||||||
|---|---|---|---|---|---|---|---|---|
| Party | Candidate | Votes | % | ±% | ||||
| Liberal | Eugene Whelan | 24,357 | 55.2% | +7.1% | ||||
| New Democratic | Charles Brooks | 15,656 | 35.5% | -4.6% | ||||
| Progressive Conservative | Dennis Herring | 4,148 | 9.4% | -2.6% | ||||
| Total valid votes | 44,161 | 100.0% | ||||||
| 1972 Canadian federal election | ||||||||
|---|---|---|---|---|---|---|---|---|
| Party | Candidate | Votes | % | ±% | ||||
| Liberal | Eugene Whelan | 19,793 | 48.0% | -1.7% | ||||
| New Democratic | Ralph N. Wensley | 16,503 | 40.0% | +8.3% | ||||
| Progressive Conservative | Edmund A. Michael | 4,929 | 12.0% | -6.6% | ||||
| Total valid votes | 41,225 | 100.0% | ||||||
Essex 1966–1970
| 1968 Canadian federal election | ||||||||
|---|---|---|---|---|---|---|---|---|
| Party | Candidate | Votes | % | |||||
| Liberal | Eugene Whelan | 14,707 | 49.7% | |||||
| New Democratic | Ralph N. Wensley | 9,399 | 31.8% | |||||
| Progressive Conservative | Tom Taylor | 5,485 | 18.5% | |||||
| Total valid votes | 29,591 | 100.0% | ||||||
Essex 1867–1882
| 1878 Canadian federal election | ||||||||
|---|---|---|---|---|---|---|---|---|
| Party | Candidate | Votes | % | ±% | ||||
| Conservative | J.C. Patterson | 2,596 | 52.5% | |||||
| Liberal | William McGregor | 2,318 | 46.9% | -23.2% | ||||
| Unknown | J.H. Morgan | 27 | 0.5% | |||||
| Total valid votes | 4,941 | 100.0% | ||||||
| Canadian federal by-election, 22 October 1874 | ||||||||
|---|---|---|---|---|---|---|---|---|
| Party | Candidate | Votes | % | ±% | ||||
| On Mr. McGregor being unseated on petition, 26 August 1874 | ||||||||
| Liberal | William McGregor | 1,763 | 70.2% | +11.4% | ||||
| Unknown | Jeremiah O'Connor | 750 | 29.8% | -11.4% | ||||
| Total valid votes | 2,513 | 100.0% | ||||||
| 1874 Canadian federal election | ||||||||
|---|---|---|---|---|---|---|---|---|
| Party | Candidate | Votes | % | ±% | ||||
| Liberal | William McGregor | 2,508 | 58.7% | |||||
| Unknown | O'Connor | 1,763 | 41.3% | |||||
| Total valid votes | 4,271 | 100.0% | ||||||
| 1872 Canadian federal election | ||||||||
|---|---|---|---|---|---|---|---|---|
| Party | Candidate | Votes | % | ±% | ||||
| Conservative | John O'Connor | 1,999 | 61.8% | +11.6% | ||||
| Unknown | A. Rankin | 1,238 | 38.2% | -11.6% | ||||
| Total valid votes | 3,237 | 100.0% | ||||||
| 1867 Canadian federal election | ||||||||
|---|---|---|---|---|---|---|---|---|
| Party | Candidate | Votes | % | |||||
| Conservative | John O'Connor | 1,439 | 50.1% | |||||
| Unknown | A. Rankin | 1,432 | 49.9% | |||||
| Total valid votes | 2,871 | 100.0% | ||||||
References
- "(Code 35021) Census Profile". 2011 census. Statistics Canada. 2012. Retrieved 3 March 2011.
Notes
- Statistics Canada: 2012
- Statistics Canada: 2012
- http://www.elections.ca/res/cir/maps2/mapprov.asp?map=35026&lang=e
- "List of confirmed candidates". Elections Canada. Retrieved 4 October 2019.
- "Election Night Results". Elections Canada. Retrieved 30 October 2019.
- Elections Canada – Confirmed candidates for Essex, 30 September 2015
- Elections Canada – Preliminary Election Expenses Limits for Candidates Archived 15 August 2015 at the Wayback Machine
- Pundits' Guide to Canadian Elections
External links
- Federal riding history from the Library of Parliament:
- Campaign expense data from Elections Canada
.png.webp)