Hastings—Lennox and Addington
Hastings—Lennox and Addington is a federal electoral district in Ontario.
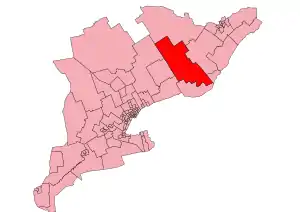 Hastings-Lennox and Addington in relation to other electoral districts in Southern Ontario | |||
| Federal electoral district | |||
| Legislature | House of Commons | ||
| MP |
Independent | ||
| District created | 2013 | ||
| First contested | 2015 | ||
| Last contested | 2019 | ||
| District webpage | profile, map | ||
| Demographics | |||
| Population (2011)[1] | 92,528 | ||
| Electors (2015) | 71,818 | ||
| Area (km²)[1] | 9,217 | ||
| Pop. density (per km²) | 10 | ||
| Census division(s) | Hastings, Lennox and Addington | ||
| Census subdivision(s) | Belleville (part), Centre Hastings, Greater Napanee, Hastings Highlands, Loyalist, Marmora and Lake, Stirling-Rawdon, Stone Mills, Tweed, Tyendinaga, Tyendinaga Mohawk Territory | ||
Hastings—Lennox and Addington was created by the 2012 federal electoral boundaries redistribution and was legally defined in the 2013 representation order. It came into effect upon the call of the 42nd Canadian federal election, scheduled for 19 October 2015.[2] It was created out of parts of Prince Edward—Hastings and Lanark—Frontenac—Lennox and Addington.[3]
Demographics
- According to the Canada 2011 Census; 2013 representation[4][5]
Ethnic groups: 91.9% White, 6.8% Aboriginal
Languages: 95.3% English, 1.6% French
Religions: 72.5% Christian (20.8% United Church, 20.4% Catholic, 12.2% Anglican, 2.9% Pentecostal, 2.6% Presbyterian, 1.5% Baptist, 12.1% Other), 26.6% No religion
Median income (2010): $27,448
Average income (2010): $34,241
Members of Parliament
This riding has elected the following Members of Parliament:
| Parliament | Years | Member | Party | |
|---|---|---|---|---|
| Hastings—Lennox and Addington Riding created from Lanark—Frontenac—Lennox and Addington and Prince Edward—Hastings |
||||
| 42nd | 2015–2019 | Mike Bossio | Liberal | |
| 43rd | 2019–2021 | Derek Sloan | Conservative | |
| 2021–present | Independent | |||
Election results
| 2019 Canadian federal election | ||||||||
|---|---|---|---|---|---|---|---|---|
| Party | Candidate | Votes | % | ±% | Expenditures | |||
| Conservative | Derek Sloan | 21,968 | 41.4 | -0.5 | $34,287.91 | |||
| Liberal | Mike Bossio | 19,721 | 37.1 | -5.3 | $103,242.32 | |||
| New Democratic | David Tough | 6,984 | 13.2 | +0.5 | $4,351.46 | |||
| Green | Sari Watson | 3,114 | 5.87 | +3.0 | none listed | |||
| People's | Adam L. E. Gray | 1,307 | 2.46 | $1,020.01 | ||||
| Total valid votes/Expense limit | 53,094 | 100.0 | ||||||
| Total rejected ballots | 352 | |||||||
| Turnout | 53,446 | 66.7 | ||||||
| Eligible voters | 80,079 | |||||||
| Conservative gain from Liberal | Swing | +2.40 | ||||||
| Source: Elections Canada[6][7] | ||||||||
| 2015 Canadian federal election | ||||||||
|---|---|---|---|---|---|---|---|---|
| Party | Candidate | Votes | % | ±% | Expenditures | |||
| Liberal | Mike Bossio | 21,104 | 42.38 | +25.31 | $87,494.06 | |||
| Conservative | Daryl Kramp | 20,879 | 41.93 | -12.92 | $112,894.94 | |||
| New Democratic | Betty Bannon | 6,348 | 12.75 | -11.24 | $17,112.70 | |||
| Green | Cam Mather | 1,466 | 2.94 | -0.48 | – | |||
| Total valid votes/Expense limit | 49,797 | 99.60 | $214,092.91 | |||||
| Total rejected ballots | 199 | 0.40 | – | |||||
| Turnout | 49,996 | 68.83 | – | |||||
| Eligible voters | 72,641 | |||||||
| Liberal notional gain from Conservative | Swing | +19.12 | ||||||
| Source: Elections Canada[8][9] | ||||||||
| 2011 federal election redistributed results[10] | |||
|---|---|---|---|
| Party | Vote | % | |
| Conservative | 23,628 | 54.85 | |
| New Democratic | 10,333 | 23.99 | |
| Liberal | 7,353 | 17.07 | |
| Green | 1,476 | 3.43 | |
| Others | 285 | 0.66 | |
References
- Statistics Canada: 2012
- Timeline for the Redistribution of Federal Electoral Districts
- Final Report – Ontario
- http://www12.statcan.gc.ca/nhs-enm/2011/dp-pd/prof/details/page.cfm?Lang=E&Geo1=FED2013&Code1=35039&Data=Count&SearchText=Hastings&SearchType=Begins&SearchPR=01&A1=All&B1=All&Custom=&TABID=1
- http://www12.statcan.gc.ca/nhs-enm/2011/dp-pd/prof/details/page.cfm?Lang=E&Geo1=FED2013&Code1=35039&Data=Count&SearchText=Hastings&SearchType=Begins&SearchPR=01&A1=All&B1=All&Custom=&TABID=1#tabs2
- "List of confirmed candidates". Elections Canada. Retrieved October 3, 2019.
- "Election Night Results". Elections Canada. Retrieved October 31, 2019.
- Elections Canada – Confirmed candidates for Hastings—Lennox and Addington, 30 September 2015
- Elections Canada – Preliminary Election Expenses Limits for Candidates
- Pundits' Guide to Canadian Elections