Toronto—Danforth
Toronto—Danforth (formerly Broadview—Greenwood) is a federal electoral district in Ontario, Canada, that has been represented in the House of Commons of Canada since 1979. It lies to the east of Downtown Toronto. Its best-known MP was New Democratic Party (NDP) leader and Leader of the Opposition Jack Layton.
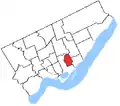
 Location in Toronto | |||
| Federal electoral district | |||
| Legislature | House of Commons | ||
| MP |
Liberal | ||
| District created | 1976 | ||
| First contested | 1979 | ||
| Last contested | 2019 | ||
| District webpage | profile, map | ||
| Demographics | |||
| Population (2011)[1] | 104,017 | ||
| Electors (2015) | 76,567 | ||
| Area (km²)[2] | 19.75 | ||
| Pop. density (per km²) | 5,266.7 | ||
| Census division(s) | Toronto | ||
| Census subdivision(s) | Toronto | ||
.gif)
Toronto—Danforth includes an array of ethnicities, including large Greek, Chinese, Muslim and South Asian communities. It has the highest percentage of ethnic Greeks among all Toronto ridings (7.3%).
Historically, the riding has tilted to the left, particularly since the 1990s. Most election contests take place between the NDP and the Liberal Party. Even with the end of vote-splitting on the centre-right, the Conservatives are almost nonexistent in the riding; no Conservative candidate has crossed the 15 percent mark.
The NDP held the riding for the first nine years of its existence before Liberal Dennis Mills won the seat in 1988 and held it during the long period of Liberal dominance of the federal scene. He was unseated in 2004 by Layton, who had previously run against Mills in 1997. Layton held the seat until his death on August 22, 2011. The seat was vacant until a by-election on March 29, 2012, which was won by NDP candidate and human rights lawyer Craig Scott. However, Scott was narrowly defeated by Liberal Julie Dabrusin in the 2015 election in a major upset.
Demographics
- According to the Canada 2016 Census; 2013 representation[3][4]
Ethnic groups: 65.2% White, 12.3% Chinese, 5.0% Black, 2.3% Filipino, 2.0% Aboriginal, 1.4% Southeast Asian, 1.3% Latin American, 1.7% Multiple
Languages: 67.7% English, 6.3% Cantonese, 4.5% Greek, 2.6% French, 2.3% Mandarin, 1.4% Spanish, 1.2% Tagalog, 1.1% Italian
Religions (2011): 48.7% Christian (19.0% Catholic, 9.9% Christian Orthodox, 4.7% Anglican, 3.5% United Church, 1.4% Presbyterian, 1.5% Pentecostal, 10.2% Other), 4.6% Buddhist, 4.4% Muslim, 1.9% Jewish, 1.0% Hindu, 38.4% No religion
Median income (2015): $35,056
Average income (2015): $54,560
History
The riding was created in 1976 as "Broadview—Greenwood" from parts of Broadview and York East and a small part of Greenwood.
It consisted initially of the part of the Municipality of Metropolitan Toronto bounded on the south by Queen Street East, on the west by the Don River, and on the east and north by a line drawn north from Queen Street along Jones Avenue, east along Gerrard Street East, north along Greenwood Avenue, west along O'Connor Drive, north along Don Mills Road to the Don River.
In 1987, it was redefined to consist of the part of the City of Toronto and the Borough of East York bounded on the west by the Don River, on the south by Queen Street, and on the east and north by a line drawn from the lake north along Leslie Street, east along Queen Street East, north along Greenwood Avenue, east along Danforth Avenue, north along Coxwell Avenue and Coxwell Boulevard, and west along Taylor Creek and the Don River East Branch to the Don River.
In 1996, it was defined to consist of the parts of the City of Toronto and the Borough of East York north along Leslie Street, east along Queen Street East, north along Greenwood Avenue, east along Gerrard Street East, north along Coxwell Avenue and Coxwell Boulevard, west along Taylor Creek, the Don River East Branch and the Don River, northwest along Millwood Road, southwest along the Canadian Pacific Railway and the eastern limit of the City of Toronto, south along the Don River to Toronto Harbour.
The name of the electoral district was changed in 2000 to "Toronto—Danforth" on the suggestion of Dennis Mills, the riding's Member of Parliament. Many local citizens were upset at the name change, particularly because of the lack of public say in the matter. Layton sought neighbourhood input for another name change to the riding, but the name was not changed.
In 2003, it was given its current boundaries, which consist of the part of the City of Toronto bounded on the south by Lake Ontario and Toronto Harbour, on the east by Coxwell Avenue and Coxwell Boulevard, on the north by Taylor Creek and the Don River East Branch, and on the west by the Don River. This riding was unchanged after the 2012 electoral redistribution.
Former boundaries
 1976 to 1987
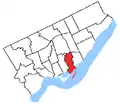 1987 to 1996
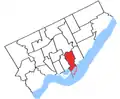 1996 to 2003
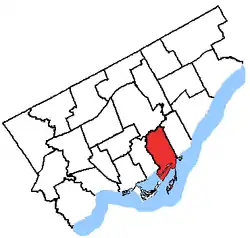 2003 to 2015
Members of Parliament
This riding has elected the following Members of Parliament:
| Parliament | Years | Member | Party | |
|---|---|---|---|---|
| Broadview—Greenwood Riding created from Broadview, York East and Greenwood |
||||
| 31st | 1979–1980 | Bob Rae | New Democratic | |
| 32nd | 1980–1982 | |||
| 1982–1984 | Lynn McDonald | |||
| 33rd | 1984–1988 | |||
| 34th | 1988–1993 | Dennis Mills | Liberal | |
| 35th | 1993–1997 | |||
| 36th | 1997–2000 | |||
| Toronto—Danforth | ||||
| 37th | 2000–2004 | Dennis Mills | Liberal | |
| 38th | 2004–2006 | Jack Layton | New Democratic | |
| 39th | 2006–2008 | |||
| 40th | 2008–2011 | |||
| 41st | 2011–2011 | |||
| 2012–2015 | Craig Scott | |||
| 42nd | 2015–2019 | Julie Dabrusin | Liberal | |
| 43rd | 2019–present | |||
Election results
Toronto—Danforth, 2000–present
| 2019 Canadian federal election | ||||||||
|---|---|---|---|---|---|---|---|---|
| Party | Candidate | Votes | % | ±% | Expenditures | |||
| Liberal | Julie Dabrusin | 27,681 | 47.7 | +5.36 | $75,766 | |||
| New Democratic | Min Sook Lee | 19,283 | 33.2 | -6.97 | $102,067 | |||
| Conservative | Zia Choudhary | 6,091 | 10.5 | +0.64 | $19,351 | |||
| Green | Chris Tolley | 3,761 | 6.5 | +1.79 | ||||
| People's | Tara Dos Remedios | 621 | 1.1 | - | $3,633 | |||
| Animal Protection | Elizabeth Abbott | 261 | 0.4 | -0.24 | £2,645 | |||
| Independent | John Kladitis | 210 | 0.4 | - | $2,953 | |||
| Communist | Ivan Byard | 151 | 0.3 | - | ||||
| Total valid votes/Expense limit | 58,059 | 100.0 | ||||||
| Total rejected ballots | 413 | |||||||
| Turnout | 58,472 | 71.9 | ||||||
| Eligible voters | 81,283 | |||||||
| Source: Elections Canada[5][6] | ||||||||
| 2015 Canadian federal election | ||||||||
|---|---|---|---|---|---|---|---|---|
| Party | Candidate | Votes | % | ±% | Expenditures | |||
| Liberal | Julie Dabrusin | 23,531 | 42.34 | +24.75 | $76,557.98 | |||
| New Democratic | Craig Scott | 22,325 | 40.17 | -20.70 | $177,088.37 | |||
| Conservative | Benjamin Dichter | 5,478 | 9.86 | -4.44 | $7,898.04 | |||
| Green | Chris Tolley | 2,618 | 4.71 | -1.74 | $8,441.33 | |||
| Progressive Canadian | John Richardson | 1,275 | 2.29 | – | – | |||
| Animal Alliance | Elizabeth Abbott | 354 | 0.64 | – | $216.83 | |||
| Total valid votes/Expense limit | 55,581 | 100.00 | $210,111.71 | |||||
| Total rejected ballots | 269 | 0.48 | – | |||||
| Turnout | 55,850 | 72.38 | – | |||||
| Eligible voters | 77,158 | |||||||
| Liberal gain from New Democratic | Swing | +22.73 | ||||||
| Source: Elections Canada[7][8] | ||||||||
| Canadian federal by-election, March 19, 2012 Death of Jack Layton | ||||||||
|---|---|---|---|---|---|---|---|---|
| Party | Candidate | Votes | % | ±% | Expenditures | |||
| New Democratic | Craig Scott | 19,210 | 59.44 | −1.36 | $ 82,847.22 | |||
| Liberal | Grant Gordon | 9,215 | 28.51 | +10.89 | 86,016.54 | |||
| Conservative | Andrew Keyes | 1,736 | 5.37 | −8.95 | 73,735.56 | |||
| Green | Adriana Mugnatto-Hamu | 1,517 | 4.69 | −1.77 | 57,955.38 | |||
| Progressive Canadian | Dorian Baxter | 208 | 0.64 | – | 1,473.73 | |||
| Libertarian | John C. Recker | 133 | 0.41 | – | 2,433.05 | |||
| Independent | Leslie Bory | 77 | 0.24 | – | 898.69 | |||
| Canadian Action | Christopher Porter | 75 | 0.23 | – | 3,163.57 | |||
| Independent | John Turmel | 57 | 0.18 | – | – | |||
| United | Brian Jedan | 55 | 0.17 | – | 130.18 | |||
| Independent | Bahman Yazdanfar | 36 | 0.11 | – | 622.86 | |||
| Total valid votes/Expense limit | 32,319 | 100.00 | $ 86,821.95 | |||||
| Total rejected ballots | 150 | 0.46 | −0.13 | |||||
| Turnout | 32,469 | 43.58 | −21.32 | |||||
| New Democratic hold | Swing | −6.1 | ||||||
Source(s)
"By-election March 19, 2012 – Official Voting Results". Elections Canada. Retrieved October 29, 2014. "Financial Reports: Candidate's Electoral Campaign Return – March 19, 2012 By-election". Retrieved October 29, 2014. | ||||||||
| 2011 Canadian federal election | ||||||||
|---|---|---|---|---|---|---|---|---|
| Party | Candidate | Votes | % | ±% | Expenditures | |||
| New Democratic | Jack Layton | 29,235 | 60.80 | +16.02 | $ 71,037.96 | |||
| Liberal | Andrew Lang | 8,472 | 17.62 | -11.76 | 62,218.04 | |||
| Conservative | Katarina Von Koenig | 6,885 | 14.32 | +2.67 | 4,113.58 | |||
| Green | Adriana Mugnatto-Hamu | 3,107 | 6.46 | -6.75 | 47,241.28 | |||
| Animal Alliance | Marie Crawford | 387 | 0.80 | +0.41 | – | |||
| Total valid votes/Expense limit | 48,086 | 100.00 | – | $ 84,621.69 | ||||
| Total rejected ballots | 284 | 0.59 | +0.17 | |||||
| Turnout | 48,370 | 64.90 | +3.99 | |||||
| New Democratic hold | Swing | +13.9 | ||||||
Source(s)
"Official Voting Results – Forty-First General Election 2011". (Table 12). Retrieved October 29, 2014. "Financial Reports: Candidate's Electoral Campaign Return". Elections Canada. Retrieved October 29, 2014. | ||||||||
| 2008 Canadian federal election | ||||||||
|---|---|---|---|---|---|---|---|---|
| Party | Candidate | Votes | % | ±% | Expenditures | |||
| New Democratic | Jack Layton | 20,323 | 44.78 | -3.64 | $ 79,280.87 | |||
| Liberal | Andrew Lang | 13,336 | 29.38 | -4.85 | 65,423.39 | |||
| Green | Sharon Howarth | 5,995 | 13.21 | +6.10 | 37,793.55 | |||
| Conservative | Christina Perreault | 5,287 | 11.65 | +1.75 | 16,514.92 | |||
| Animal Alliance | Marie Crawford | 175 | 0.39 | – | – | |||
| Independent | John Richardson | 130 | 0.29 | – | 38.98 | |||
| Marxist–Leninist | Marcell Rodden | 87 | 0.19 | -0.15 | – | |||
| Canadian Action | Bahman Yazdanfar | 54 | 0.12 | – | 125.00 | |||
| Total valid votes/Expense limit | 45,387 | 100.00 | – | $ 82,496.98 | ||||
| Total rejected ballots | 191 | 0.42 | -0.06 | |||||
| Turnout | 45,578 | 60.91 | -6.76 | |||||
| New Democratic hold | Swing | +0.6 | ||||||
Source(s)
"Official Voting Results – Fortieth General Election 2008". (Table 12). Retrieved October 29, 2014. "Financial Reports: Candidate's Electoral Campaign Return". Elections Canada. Retrieved October 29, 2014. | ||||||||
| 2006 Canadian federal election | ||||||||
|---|---|---|---|---|---|---|---|---|
| Party | Candidate | Votes | % | ±% | Expenditures | |||
| New Democratic | Jack Layton | 24,412 | 48.42 | +2.08 | $ 74,966.33 | |||
| Liberal | Deborah Coyne | 17,256 | 34.23 | -7.11 | 74,304.11 | |||
| Conservative | Kren Clausen | 4,992 | 9.90 | +3.69 | 32,138.91 | |||
| Green | Al Hart | 3,583 | 7.11 | +1.73 | 6,770.73 | |||
| Marxist–Leninist | Marcell Rodden | 172 | 0.34 | +0.16 | – | |||
| Total valid votes/Expense limit | 50,415 | 100.00 | – | $ 76,419.79 | ||||
| Total rejected ballots | 242 | 0.48 | -0.08 | |||||
| Turnout | 50,657 | 67.67 | +3.57 | |||||
| New Democratic hold | Swing | +4.6 | ||||||
Source(s)
"Official Voting Results – Thirty-ninth General Election". (Table 12). Retrieved October 29, 2014. "Financial Reports: Candidate's Electoral Campaign Return". Elections Canada. Retrieved October 29, 2014. | ||||||||
| 2004 Canadian federal election | ||||||||
|---|---|---|---|---|---|---|---|---|
| Party | Candidate | Votes | % | ±% | Expenditures | |||
| New Democratic | Jack Layton | 22,198 | 46.34 | +18.69 | $ 72,751.01 | |||
| Liberal | Dennis Mills | 19,803 | 41.34 | -10.56 | 73,909.41 | |||
| Conservative | Loftus Cuddy | 2,975 | 6.21 | -9.51 | 12,400.00 | |||
| Green | Jim Harris | 2,575 | 5.38 | +3.42 | 11,139.51 | |||
| Marijuana | Scott Yee | 265 | 0.55 | -0.76 | – | |||
| Marxist–Leninist | Marcell Rodden | 84 | 0.18 | -0.03 | – | |||
| Total valid votes/Expense limit | 47,900 | 100.00 | $ 75,271.84 | |||||
| Total rejected ballots | 269 | 0.56 | ||||||
| Turnout | 48,169 | 64.10 | ||||||
| New Democratic gain from Liberal | Swing | -14.6 | ||||||
Source(s)
"Official Voting Results – Thirty-eighth General Election". (Table 12). Retrieved October 29, 2014. "Financial Reports: Candidate's Electoral Campaign Return". Elections Canada. Retrieved October 29, 2014. | ||||||||
Note: Change from 2000 for top three parties is based on redistributed results. Conservative Party change is based on the total of Canadian Alliance and Progressive Conservative Party votes.
Broadview—Greenwood, 1976–2000
| 2000 Canadian federal election | ||||||||
|---|---|---|---|---|---|---|---|---|
| Party | Candidate | Votes | % | ±% | ||||
| Liberal | Dennis Mills | 20,330 | 51.90 | +2.14 | ||||
| New Democratic | Paula Turtle | 10,830 | 27.65 | -5.12 | ||||
| Progressive Conservative | Rose A. Dyson | 3,138 | 8.01 | +0.38 | ||||
| Alliance | Chris Butryn | 3,021 | 7.71 | +0.06 | ||||
| Green | Robert Nevin | 769 | 1.96 | +0.96 | ||||
| Marijuana | Sean Keir | 513 | 1.31 | – | ||||
| Canadian Action | William Angus Millar | 202 | 0.52 | – | ||||
| Natural Law | Linda Martin | 154 | 0.39 | -0.09 | ||||
| Communist | Miguel Figueroa | 129 | 0.33 | – | ||||
| Marxist–Leninist | Melanie Cishecki | 82 | 0.21 | +0.01 | ||||
| Total valid votes | 39,168 | 100.00 | – | |||||
Note: Canadian Alliance vote is compared to the Reform vote in 1997 election.
| 1997 Canadian federal election | ||||||||
|---|---|---|---|---|---|---|---|---|
| Party | Candidate | Votes | % | ±% | ||||
| Liberal | Dennis Mills | 21,108 | 49.76 | -11.31 | ||||
| New Democratic | Jack Layton | 13,903 | 32.77 | +18.82 | ||||
| Reform | Brian Higgins | 3,247 | 7.65 | -3.64 | ||||
| Progressive Conservative | Dianne Garrels | 3,238 | 7.63 | -1.71 | ||||
| Green | Karen McCarthy | 426 | 1.00 | – | ||||
| Independent | Kevin Mark Clarke | 211 | 0.50 | – | ||||
| Natural Law | Bob Hyman | 205 | 0.48 | -0.53 | ||||
| Marxist–Leninist | Gurdev Singh | 85 | 0.20 | -0.04 | ||||
| Total valid votes | 42,423 | 100.00 | – | |||||
| 1993 Canadian federal election | ||||||||
|---|---|---|---|---|---|---|---|---|
| Party | Candidate | Votes | % | ±% | ||||
| Liberal | Dennis Mills | 23,558 | 61.07 | +22.18 | ||||
| New Democratic | Lynn McDonald | 5,381 | 13.95 | -22.01 | ||||
| Reform | Frank Meyers | 4,356 | 11.29 | – | ||||
| Progressive Conservative | John Papadakis | 3,601 | 9.34 | -13.08 | ||||
| National | Barbara A. Sim | 976 | 2.53 | – | ||||
| Natural Law | Bob Hyman | 389 | 1.01 | – | ||||
| Independent | Elizabeth Rowley | 148 | 0.38 | – | ||||
| Marxist–Leninist | Manuel Gitterman | 92 | 0.24 | – | ||||
| Abolitionist | Brian Blonski | 74 | 0.19 | – | ||||
| Total valid votes | 38,575 | 100.00 | – | |||||
| 1988 Canadian federal election | ||||||||
|---|---|---|---|---|---|---|---|---|
| Party | Candidate | Votes | % | ±% | ||||
| Liberal | Dennis Mills | 15,808 | 38.89 | +20.55 | ||||
| New Democratic | Lynn McDonald | 14,616 | 35.96 | -9.63 | ||||
| Progressive Conservative | Wayne Allan Shillinglaw | 9,112 | 22.42 | -12.25 | ||||
| Libertarian | Byron J. Garby | 431 | 1.06 | – | ||||
| Green | Elizabeth Rhodes | 296 | 0.73 | +0.01 | ||||
| Rhinoceros | Hank Wright Snell | 243 | 0.60 | -0.08 | ||||
| Commonwealth of Canada | David S. Moyer | 137 | 0.34 | – | ||||
| Total valid votes | 40,643 | 100.00 | – | |||||
| 1984 Canadian federal election | ||||||||
|---|---|---|---|---|---|---|---|---|
| Party | Candidate | Votes | % | ±% | ||||
| New Democratic | Lynn McDonald | 15,066 | 45.59 | +6.48 | ||||
| Progressive Conservative | Peter Worthington | 11,455 | 34.67 | -15.26 | ||||
| Liberal | Ken Paige | 6,060 | 18.34 | +8.61 | ||||
| Green | Rolf Tegtmeyer | 239 | 0.72 | – | ||||
| Rhinoceros | Nora Rodden | 224 | 0.68 | +0.36 | ||||
| Total valid votes | 33,044 | 100.00 | – | |||||
Note: the popular vote of Progressive Conservative candidate Peter Worthington is compared to the total popular vote in the 1982 by-election earned by the PC candidate Bill Fatsis and by Mr. Worthington running without affiliation.
| Canadian federal by-election, October 12, 1982: Toronto-Danforth | ||||||||
|---|---|---|---|---|---|---|---|---|
| Party | Candidate | Votes | % | ±% | ||||
| New Democratic | Lynn McDonald | 10,967 | 39.11 | -1.26 | ||||
| Independent | Peter Worthington | 9,004 | 32.11 | – | ||||
| Progressive Conservative | Bill Fatsis | 4,999 | 17.82 | -6.10 | ||||
| Liberal | Dave O'Connor | 2,728 | 9.73 | -23.31 | ||||
| Independent | Donald Y. Hsu | 159 | 0.57 | – | ||||
| Rhinoceros | Terry The Pirate Roche | 90 | 0.32 | -0.29 | ||||
| Independent | Christopher R.C. Boddy | 41 | 0.15 | – | ||||
| Independent | Sydney Thompson | 38 | 0.14 | – | ||||
| Independent | John Turmel | 19 | 0.07 | – | ||||
| Total valid votes | 28,045 | 100.00 | – | |||||
| 1980 Canadian federal election | ||||||||
|---|---|---|---|---|---|---|---|---|
| Party | Candidate | Votes | % | ±% | ||||
| New Democratic | Bob Rae | 12,953 | 40.37 | +0.65 | ||||
| Liberal | Philippe Gigantès | 10,601 | 33.04 | +5.06 | ||||
| Progressive Conservative | Michael Clarke | 7,677 | 23.92 | -6.16 | ||||
| Libertarian | Walter Belej | 352 | 1.10 | -0.33 | ||||
| Rhinoceros | Vicki Butterfield | 196 | 0.61 | – | ||||
| Communist | Ed McDonald | 164 | 0.51 | +0.07 | ||||
| Independent | Don Hayward | 53 | 0.17 | – | ||||
| Marxist–Leninist | Dorothy J. O'Donnell | 53 | 0.17 | 0.00 | ||||
| Independent | Milorad Novich | 40 | 0.12 | -0.07 | ||||
| Total valid votes | 32,089 | 100.00 | – | |||||
| 1979 Canadian federal election | ||||||||
|---|---|---|---|---|---|---|---|---|
| Party | Candidate | Votes | % | |||||
| New Democratic | Bob Rae | 13,187 | 39.72 | |||||
| Progressive Conservative | Michael Clarke | 9,987 | 30.08 | |||||
| Liberal | Philipp Varelis | 9,290 | 27.98 | |||||
| Libertarian | Walter Belej | 474 | 1.43 | |||||
| Communist | John Bizzell | 145 | 0.44 | |||||
| Independent | Milorad Novich | 64 | 0.19 | |||||
| Marxist–Leninist | Dorothy J. O'Donnell | 57 | 0.17 | |||||
| Total valid votes | 33,204 | 100.00 | ||||||
References
Citations
- Statistics Canada: 2011
- Statistics Canada: 2011
- https://www12.statcan.gc.ca/census-recensement/2016/dp-pd/prof/details/page.cfm?Lang=E&Geo1=FED&Code1=35109&Geo2=PR&Code2=35&SearchText=Danforth&SearchType=Contains&SearchPR=01&B1=All&TABID=1&type=0
- https://www12.statcan.gc.ca/nhs-enm/2011/dp-pd/prof/details/page.cfm?Lang=E&Geo1=FED2013&Code1=35109&Data=Count&SearchText=Toronto&SearchType=Begins&SearchPR=01&A1=All&B1=All&Custom=&TABID=1
- "List of confirmed candidates". Elections Canada. Retrieved October 4, 2019.
- "Election Night Results". Elections Canada. Retrieved November 6, 2019.
- Elections Canada – Confirmed candidates for Toronto—Danforth, 30 September 2015
- Elections Canada – Preliminary Election Expenses Limits for Candidates
General references
- "(Code 35094) Census Profile". 2011 census. Statistics Canada. 2012. Retrieved March 3, 2011.
- Broadview—Greenwood federal riding history from the Library of Parliament
- Toronto—Danforth federal riding history from the Library of Parliament
- Campaign expense data from Elections Canada