Pickering—Uxbridge
Pickering—Uxbridge is a federal electoral district in Ontario. It consists of the City of Pickering and the Township of Uxbridge.
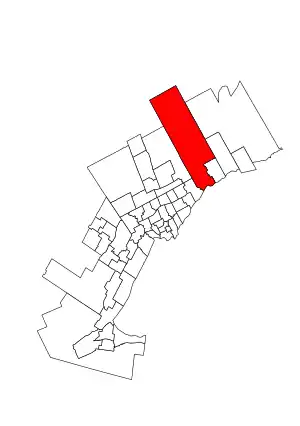 Pickering-Uxbridge in relation to other Greater Toronto Area districts | |||
| Coordinates: | 44.042°N 79.181°W | ||
| Federal electoral district | |||
| Legislature | House of Commons | ||
| MP |
Liberal | ||
| District created | 2013 | ||
| First contested | 2015 | ||
| Last contested | 2019 | ||
| District webpage | profile, map | ||
| Demographics | |||
| Population (2016)[1] | 112,947 | ||
| Electors (2015) | 84,997 | ||
| Area (km²) | 687 | ||
| Pop. density (per km²) | 164.4 | ||
| Census division(s) | Durham | ||
| Census subdivision(s) | Pickering, Uxbridge | ||
Pickering—Uxbridge was created by the 2012 federal electoral boundaries redistribution and was legally defined in the 2013 representation order. It came into effect upon the call of the 42nd Canadian federal election, scheduled for 19 October 2015.[2] It was created out of parts of Pickering—Scarborough East, Ajax—Pickering and Durham.[3]
Demographics
- According to the Canada 2011 Census; 2013 representation[4][5]
Ethnic groups: 70.5% White, 9.5% Black, 9.1% South Asian, 2.8% Filipino, 2.0% Chinese
Languages: 82.9% English, 1.5% French, 1.3% Italian, 1.3% Tagalog, 1.3% Urdu, 1.0% German
Religions: 66.4% Christian (28.3% Catholic, 8.2% United Church, 7.9% Anglican, 3.1% Presbyterian, 3.1% Christian Orthodox, 2.4% Baptist, 2.4% Pentecostal, 11.0% Other), 4.9% Muslim, 3.1% Hindu, 24.0% No religion
Median income (2010): $35,306
Average income (2010): $48,210
Members of Parliament
This riding has elected the following Members of Parliament:
| Parliament | Years | Member | Party | |
|---|---|---|---|---|
| Pickering—Uxbridge Riding created from Ajax—Pickering, Durham and Pickering—Scarborough East |
||||
| 42nd | 2015–2019 | Jennifer O'Connell | Liberal | |
| 43rd | 2019–present | |||
Election results
| 2019 Canadian federal election | ||||||||
|---|---|---|---|---|---|---|---|---|
| Party | Candidate | Votes | % | ±% | Expenditures | |||
| Liberal | Jennifer O'Connell | 32,387 | 51.0 | +0.7 | $79,048.14 | |||
| Conservative | Cyma Musarat | 18,462 | 29.1 | -9.1 | $56,879.42 | |||
| New Democratic | Eileen Higdon | 7,582 | 11.9 | +2.7 | $9,433.88 | |||
| Green | Peter Forint | 3,799 | 6.0 | +3.7 | $7,976.00 | |||
| People's | Corneliu Chisu | 1,265 | 2.0 | $7,989.04 | ||||
| Total valid votes/Expense limit | 63,495 | 100.0 | ||||||
| Total rejected ballots | 407 | |||||||
| Turnout | 63,902 | 68.9 | ||||||
| Eligible voters | 92,699 | |||||||
| Source: Elections Canada[6] | ||||||||
| 2015 Canadian federal election | ||||||||
|---|---|---|---|---|---|---|---|---|
| Party | Candidate | Votes | % | ±% | Expenditures | |||
| Liberal | Jennifer O'Connell | 29,757 | 50.30 | +16.73 | $92,326.80 | |||
| Conservative | Corneliu Chisu | 22,591 | 38.19 | -7.79 | $119,840.70 | |||
| New Democratic | Pamela Downward | 5,446 | 9.21 | -6.54 | $12,890.87 | |||
| Green | Anthony Jordan Navarro | 1,365 | 2.31 | -2.21 | $4,275.04 | |||
| Total valid votes/Expense limit | 59,159 | 100.0 | $224,063.76 | |||||
| Total rejected ballots | 222 | 0.3% | – | |||||
| Turnout | 59,381 | – | – | |||||
| Eligible voters | 85,794 | |||||||
| Source: Elections Canada[7][8][9] | ||||||||
| 2011 federal election redistributed results[10] | |||
|---|---|---|---|
| Party | Vote | % | |
| Conservative | 22,574 | 45.98 | |
| Liberal | 16,480 | 33.57 | |
| New Democratic | 7,731 | 15.75 | |
| Green | 2,217 | 4.52 | |
| Others | 95 | 0.19 | |
References
- [[Statistics Canada. 2017. Pickering--Uxbridge [Federal electoral district], Ontario and Ontario [Province] (table). Census Profile. 2016 Census. Statistics Canada Catalogue no. 98-316-X2016001. Ottawa. Released November 29, 2017. https://www12.statcan.gc.ca/census-recensement/2016/dp-pd/prof/index.cfm?Lang=E (accessed October 22, 2019)]]: 2016
- Timeline for the Redistribution of Federal Electoral Districts
- Final Report – Ontario
- http://www12.statcan.gc.ca/nhs-enm/2011/dp-pd/prof/details/page.cfm?Lang=E&Geo1=FED2013&Code1=35085&Data=Count&SearchText=Pickering&SearchType=Begins&SearchPR=01&A1=All&B1=All&Custom=&TABID=1
- http://www12.statcan.gc.ca/nhs-enm/2011/dp-pd/prof/details/page.cfm?Lang=E&Geo1=FED2013&Code1=35085&Data=Count&SearchText=Pickering&SearchType=Begins&SearchPR=01&A1=All&B1=All&Custom=&TABID=1#tabs2
- "Election Night Results". Elections Canada. Retrieved November 4, 2019.
- Elections Canada – Confirmed candidates for Pickering—Uxbridge, 30 September 2015
- "Elections Canada – Preliminary Election Expenses Limits for Candidates". Archived from the original on 2015-08-15. Retrieved 2020-05-06.
- "Jennifer O'Connell wins Pickering-Uxbridge riding for Liberals". durhamregion.com/.
- Pundits' Guide to Canadian Elections