Gregory County, South Dakota
Gregory County is a county in the U.S. state of South Dakota. As of the 2010 United States Census, the population was 4,271.[1] Its county seat is Burke.[2] The county was created in 1862 and organized in 1898.[3] It was named for the politician J. Shaw Gregory.[4]
Gregory County | |
|---|---|
 | |
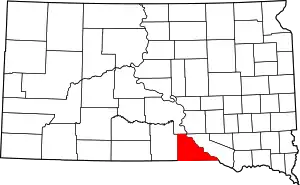 Location within the U.S. state of South Dakota | |
 South Dakota's location within the U.S. | |
| Coordinates: 43°12′N 99°11′W | |
| Country | |
| State | |
| Founded | 1862 (created) 1898 (organized) |
| Named for | J. Shaw Gregory |
| Seat | Burke |
| Largest city | Gregory |
| Area | |
| • Total | 1,054 sq mi (2,730 km2) |
| • Land | 1,015 sq mi (2,630 km2) |
| • Water | 39 sq mi (100 km2) 3.7% |
| Population (2010) | |
| • Total | 4,271 |
| • Estimate (2018) | 4,212 |
| • Density | 4.1/sq mi (1.6/km2) |
| Time zone | UTC−6 (Central) |
| • Summer (DST) | UTC−5 (CDT) |
| Congressional district | At-large |
| Website | gregory |
Geography
Gregory County lies on the south line of South Dakota. Its south boundary line abuts the north boundary line of Nebraska. The Missouri River flows southeastward along its east boundary line. The county terrain consists of rolling hills, sloping to the southeast. The eastern part of the county is etched with gullies and drainages, flowing to the river basin.[5] The county's highest point is in the SW corner, at 2,247' (685m) ASL.[6]
Gregory County has a total area of 1,054 square miles (2,730 km2), of which 1,015 square miles (2,630 km2) is land and 39 square miles (100 km2) (3.7%) is water.[7]
Major highways
 U.S. Highway 18
 U.S. Highway 281
 South Dakota Highway 43
 South Dakota Highway 44
 South Dakota Highway 47
 South Dakota Highway 251
 South Dakota Highway 1806
Adjacent counties
- Lyman County - north
- Charles Mix County - east
- Boyd County, Nebraska - south
- Keya Paha County, Nebraska - southwest
- Tripp County - west
Protected areas[5]
- Burke Lake State Recreation Area
- Buryanek State Game Production Area
- Buryanek State Recreation Area
- Central Gregory State Game Production Area
- Dixon Dam State Game Production Area
- Herrick Lake State Game Production Area
- Karl E. Mundt National Wildlife Refuge (part)
- Landing Creek State Game Production Area
- Missouri National Recreational River (part)
- Randall Creek State Recreation Area
- Scalp Creek State Game Production Area
- Southern Gregory State Game Production Area
- South Scalp Creek State Lakeside Use Area
- South Shore State Lakeside Use Area
- South Wheeler State Lakeside Area
- Whetstone Bay State Lakeside Use Area
- Whetstone State Game Production Area
Lakes[5]
- Burke Lake
- Indian Lake
- Lake Berry
- Lake Burch
- Lake Francis Case (part)
Demographics
| Historical population | |||
|---|---|---|---|
| Census | Pop. | %± | |
| 1890 | 295 | — | |
| 1900 | 2,211 | 649.5% | |
| 1910 | 13,061 | 490.7% | |
| 1920 | 12,700 | −2.8% | |
| 1930 | 11,420 | −10.1% | |
| 1940 | 9,554 | −16.3% | |
| 1950 | 8,556 | −10.4% | |
| 1960 | 7,399 | −13.5% | |
| 1970 | 6,710 | −9.3% | |
| 1980 | 6,015 | −10.4% | |
| 1990 | 5,359 | −10.9% | |
| 2000 | 4,792 | −10.6% | |
| 2010 | 4,271 | −10.9% | |
| 2019 (est.) | 4,185 | [8] | −2.0% |
| US Decennial Census[9] 1790-1960[10] 1900-1990[11] 1990-2000[12] 2010-2018[1] | |||
2000 census
As of the 2000 United States Census,[13] there were 4,792 people, 2,022 households, and 1,290 families in the county. The population density was 5 people per square mile (2/km2). There were 2,405 housing units at an average density of 2 per square mile (1/km2). The racial makeup of the county was 93.18% White, 0.04% Black or African American, 5.59% Native American, 0.23% Asian, 0.10% from other races, and 0.86% from two or more races. 0.86% of the population were Hispanic or Latino of any race. 50.0% were of German, 7.9% Czech, 6.3% Irish, 5.7% American and 5.5% English ancestry.
There were 2,022 households, out of which 26.40% had children under the age of 18 living with them, 55.20% were married couples living together, 5.70% had a female householder with no husband present, and 36.20% were non-families. 33.90% of all households were made up of individuals, and 20.30% had someone living alone who was 65 years of age or older. The average household size was 2.32 and the average family size was 2.98.
The county population contained 24.30% under the age of 18, 5.10% from 18 to 24, 22.00% from 25 to 44, 23.80% from 45 to 64, and 24.80% who were 65 years of age or older. The median age was 44 years. For every 100 females there were 94.50 males. For every 100 females age 18 and over, there were 91.90 males.
The median income for a household in the county was $22,732, and the median income for a family was $30,833. Males had a median income of $21,063 versus $16,920 for females. The per capita income for the county was $13,656. About 15.10% of families and 20.10% of the population were below the poverty line, including 24.50% of those under age 18 and 20.60% of those age 65 or over.
2010 census
As of the 2010 United States Census, there were 4,271 people, 1,936 households, and 1,172 families in the county.[14] The population density was 4.2 inhabitants per square mile (1.6/km2). There were 2,503 housing units at an average density of 2.5 per square mile (0.97/km2).[15] The racial makeup of the county was 89.6% white, 7.5% American Indian, 0.3% Asian, 0.2% black or African American, 0.2% from other races, and 2.2% from two or more races. Those of Hispanic or Latino origin made up 0.9% of the population.[14] In terms of ancestry, 54.5% were German, 11.4% were Irish, 10.9% were Czech, 7.1% were English, 6.0% were Norwegian, and 2.4% were American.[16]
Of the 1,936 households, 23.7% had children under the age of 18 living with them, 49.9% were married couples living together, 7.4% had a female householder with no husband present, 39.5% were non-families, and 36.6% of all households were made up of individuals. The average household size was 2.18 and the average family size was 2.84. The median age was 48.2 years.[14]
The median income for a household in the county was $33,940 and the median income for a family was $44,333. Males had a median income of $30,401 versus $25,804 for females. The per capita income for the county was $21,311. About 10.7% of families and 16.0% of the population were below the poverty line, including 27.1% of those under age 18 and 19.2% of those age 65 or over.[17]
Communities
Census-designated place
Townships
- Burke
- Carlock
- Dickens
- Dixon
- Edens
- Ellston
- Fairfax
- Jones
- Landing Creek
- Pleasant Valley
- Star Valley
- Whetstone
Unorganized territories
- East Gregory
- North Gregory
- Southeast Gregory
- Spring Valley
Economy
Farming and ranching are two main economic factors of the county.
Politics
Like all of South Dakota outside Native American counties, Gregory County is powerfully Republican. No Democrat has carried Gregory County since Jimmy Carter in 1976. Like almost all of rural America, recent swings away from the socially liberal Democratic Party have been very rapid: Donald Trump's 76.5 percent of the county's vote is the largest any candidate has obtained in the county since South Dakota statehood.
| Year | Republican | Democratic | Third parties |
|---|---|---|---|
| 2020 | 78.4% 1,771 | 20.2% 455 | 1.4% 32 |
| 2016 | 76.5% 1,600 | 18.7% 391 | 4.8% 100 |
| 2012 | 70.1% 1,507 | 27.9% 599 | 2.1% 45 |
| 2008 | 63.3% 1,423 | 34.3% 771 | 2.4% 53 |
| 2004 | 66.2% 1,685 | 31.9% 813 | 1.9% 48 |
| 2000 | 65.9% 1,487 | 31.8% 718 | 2.3% 52 |
| 1996 | 49.7% 1,208 | 37.9% 923 | 12.4% 302 |
| 1992 | 39.3% 1,027 | 33.6% 879 | 27.1% 709 |
| 1988 | 57.5% 1,566 | 41.8% 1,138 | 0.7% 18 |
| 1984 | 69.2% 1,777 | 30.4% 780 | 0.5% 12 |
| 1980 | 68.4% 2,283 | 26.4% 883 | 5.2% 174 |
| 1976 | 46.9% 1,475 | 52.7% 1,658 | 0.4% 12 |
| 1972 | 51.6% 1,670 | 48.0% 1,555 | 0.4% 12 |
| 1968 | 54.4% 1,810 | 38.1% 1,266 | 7.5% 251 |
| 1964 | 45.2% 1,644 | 54.8% 1,995 | |
| 1960 | 53.7% 2,063 | 46.3% 1,778 | |
| 1956 | 52.0% 1,945 | 48.0% 1,795 | |
| 1952 | 64.2% 2,463 | 35.8% 1,372 | |
| 1948 | 48.4% 1,723 | 50.3% 1,793 | 1.3% 46 |
| 1944 | 56.2% 2,067 | 43.8% 1,613 | |
| 1940 | 54.9% 2,478 | 45.1% 2,035 | |
| 1936 | 41.1% 1,868 | 57.3% 2,603 | 1.6% 74 |
| 1932 | 26.1% 1,169 | 73.3% 3,278 | 0.6% 25 |
| 1928 | 53.0% 2,274 | 46.7% 2,001 | 0.3% 12 |
| 1924 | 44.6% 1,643 | 22.2% 818 | 33.2% 1,222 |
| 1920 | 57.6% 1,833 | 23.4% 744 | 19.0% 605 |
| 1916 | 51.9% 1,434 | 44.9% 1,242 | 3.2% 89 |
| 1912 | 44.5% 1,176 | 55.5% 1,469 | |
| 1908 | 52.8% 1,550 | 43.2% 1,266 | 4.0% 118 |
| 1904 | 67.1% 675 | 28.0% 282 | 4.9% 49 |
| 1900 | 55.0% 323 | 44.1% 259 | 0.9% 5 |
| 1896 | 48.7% 110 | 51.3% 116 |
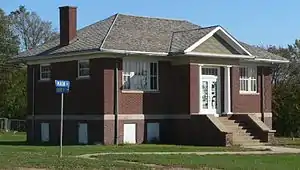
National Register of Historic Places sites
References
- "State & County QuickFacts". United States Census Bureau. Archived from the original on June 7, 2011. Retrieved November 25, 2013.
- "Find a County". National Association of Counties. Archived from the original on May 31, 2011. Retrieved June 7, 2011.
- "Dakota Territory, South Dakota, and North Dakota: Individual County Chronologies". Dakota Territory Atlas of Historical County Boundaries. The Newberry Library. 2006. Retrieved March 29, 2015.
- Gannett, Henry (1905). The Origin of Certain Place Names in the United States. Govt. Print. Off. p. 144.
- Gregory County SD Google Maps (accessed 3 February 2019)
- ""Find an Altitude" Google Maps (accessed 3 February 2019)". Archived from the original on 21 May 2019. Retrieved 3 February 2019.
- "2010 Census Gazetteer Files". United States Census Bureau. August 22, 2012. Retrieved March 26, 2015.
- "Annual Estimates of the Resident Population for Counties: April 1, 2010 to July 1, 2019". Retrieved April 10, 2020.
- "US Decennial Census". US Census Bureau. Retrieved March 26, 2015.
- "Historical Census Browser". University of Virginia Library. Retrieved March 26, 2015.
- Forstall, Richard L., ed. (March 27, 1995). "Population of Counties by Decennial Census: 1900 to 1990". US Census Bureau. Retrieved March 26, 2015.
- "Census 2000 PHC-T-4. Ranking Tables for Counties: 1990 and 2000" (PDF). US Census Bureau. April 2, 2001. Retrieved March 26, 2015.
- "U.S. Census website". US Census Bureau. Retrieved May 14, 2011.
- "Profile of General Population and Housing Characteristics: 2010 Demographic Profile Data". US Census Bureau. Archived from the original on 13 February 2020. Retrieved 11 March 2016.
- "Population, Housing Units, Area, and Density: 2010 - County". US Census Bureau. Archived from the original on February 13, 2020. Retrieved March 11, 2016.
- "Selected Social Characteristics in the US – 2006-2010 American Community Survey 5-Year Estimates". US Census Bureau. Archived from the original on February 13, 2020. Retrieved March 11, 2016.
- "Selected Economic Characteristics – 2006-2010 American Community Survey 5-Year Estimates". U.S. Census Bureau. Archived from the original on February 13, 2020. Retrieved March 11, 2016.
- Carlock SD Google Maps (accessed 3 February 2019)
- Dixon, Gregory County SD Google Maps (accessed 3 February 2019)
- Lucas SD Google Maps (accessed 3 February 2019)
- Leip, David. "Atlas of US Presidential Elections". uselectionatlas.org. Retrieved 15 April 2018.
Places adjacent to Gregory County, South Dakota | ||||||||||
|---|---|---|---|---|---|---|---|---|---|---|
| ||||||||||
Municipalities and communities of Gregory County, South Dakota, United States | ||
|---|---|---|
| Cities | | |
| Towns | ||
| CDP | ||
| Unincorporated communities | ||
| Indian reservation | ||
| Footnotes | ‡This populated place also has portions in an adjacent county or counties | |
| ||
