Statewide opinion polling for the 2020 United States presidential election
This is a list of statewide public opinion polls that have been conducted relating to the 2020 United States presidential election. The persons named in the polls are declared candidates or have received media speculation about their possible candidacy.
| |||||||||||||||||||
Leading presidential candidate by state or district, based on opinion polls. This map only represents polling data, it is not a prediction for the election. | |||||||||||||||||||
|---|---|---|---|---|---|---|---|---|---|---|---|---|---|---|---|---|---|---|---|
|
| |||||||||||||||||||
 ▼
183
33
36
162
44
20
60
| |||||||||||||||||||
| |||||||||||||||||||
If multiple versions of polls are provided, the version among likely voters is prioritized, then registered voters, then adults.
Polling aggregation in swing states
The following graph depicts the difference between Joe Biden and Donald Trump in each swing state in the poll aggregators from March 2020 to the election, with the election results for comparison.
| Polls by state/district |
| New Hampshire |
| Minnesota |
| Wisconsin |
| Michigan |
| Nevada |
| Pennsylvania |
| Nebraska CD-2 |
| Maine CD-2 |
| Arizona |
| Florida |
| North Carolina |
| Georgia |
| Ohio |
| Texas |
| Iowa |
| Montana |
| Missouri |
| Alaska |
| South Carolina |
| Nebraska |
| Kansas |
Alabama
- Graphical summary
Aggregate polls
| Source of poll aggregation |
Dates administered |
Dates updated |
Joe Biden Democratic |
Donald Trump Republican |
Other/ Undecided [lower-alpha 1] |
Margin |
|---|---|---|---|---|---|---|
| 270 to Win | September 1 – October 13, 2020 | October 27, 2020 | 38.0% | 58.0% | 4.0% | Trump +20.0 |
| FiveThirtyEight | until October 25, 2020 | October 27, 2020 | 38.5% | 56.8% | 4.7% | Trump +18.3 |
| Average | 38.3% | 57.4% | 4.3% | Trump +19.1 | ||
- Polls
| Poll source | Date(s) administered |
Sample size[lower-alpha 2] |
Margin of error |
Donald Trump Republican |
Joe Biden Democratic |
Jo Jorgensen Libertarian |
Other | Undecided |
|---|---|---|---|---|---|---|---|---|
| SurveyMonkey/Axios | Oct 20 – Nov 2, 2020 | 1,808 (LV) | ± 3.5% | 62%[lower-alpha 3] | 36% | – | – | – |
| Swayable | Oct 27 – Nov 1, 2020 | 330 (LV) | ± 7.9% | 55% | 38% | 7% | – | – |
| Data for Progress | Oct 27 – Nov 1, 2020 | 1,045 (LV) | ± 3% | 58% | 38% | 3% | 1% | 0%[lower-alpha 4] |
| Auburn University At Montgomery | Oct 23–28, 2020 | 853 (LV) | ± 4.4% | 58% | 39% | – | 3% | – |
| SurveyMonkey/Axios | Oct 1–28, 2020 | 3,363 (LV) | – | 61% | 37% | – | – | – |
| Swayable | Oct 23–26, 2020 | 266 (LV) | ± 7.8% | 56% | 37% | 7% | – | – |
| Moore Information (R)[upper-alpha 1] | Oct 11–14, 2020 | 504 (LV) | ± 4.5% | 55% | 38% | – | – | – |
| Auburn University at Montgomery | Sep 30 – Oct 3, 2020 | 1,072 (RV) | ± 4.0% | 57% | 37% | – | 6% | – |
| SurveyMonkey/Axios | Sep 1–30, 2020 | 1,354 (LV) | – | 59% | 39% | – | – | 2% |
| SurveyMonkey/Axios | Aug 1–31, 2020 | 1,220 (LV) | – | 65% | 33% | – | – | 2% |
| Tyson Group/Consumer Energy Alliance[upper-alpha 2] | Aug 17–19, 2020 | 600 (LV) | ± 4% | 48% | 44% | 0% | 0%[lower-alpha 5] | 7% |
| Morning Consult | Jul 24 – Aug 2, 2020 | 609 (LV) | ± 4.0% | 58% | 36% | – | 2%[lower-alpha 6] | 4% |
| SurveyMonkey/Axios | Jul 1–31, 2020 | 1,583 (LV) | – | 63% | 35% | – | – | 2% |
| Auburn University at Montgomery | Jul 2–9, 2020 | 567 (RV) | ± 5.1% | 55% | 41% | – | 4% | 1% |
| SurveyMonkey/Axios | Jun 8–30, 2020 | 649 (LV) | – | 63% | 35% | – | – | 2% |
| FM3 Research/Doug Jones[upper-alpha 3] | May 14–18, 2020 | 601 (LV) | ± 4% | 53% | 39% | – | – | – |
| Mason-Dixon | Feb 4–6, 2020 | 625 (RV) | ± 4% | 58% | 38% | – | – | 4% |
| WPA Intelligence | Jan 7–9, 2020 | 500 (LV) | – | 59% | 38% | – | – | 3% |
Alaska
- Graphical summary
Aggregate polls
| Source of poll aggregation |
Dates administered |
Dates updated |
Joe Biden Democratic |
Donald Trump Republican |
Other/ Undecided [lower-alpha 1] |
Margin |
|---|---|---|---|---|---|---|
| 270 to Win | September 26 – October 28, 2020 | November 1, 2020 | 43.3% | 49.3% | 7.4% | Trump +6.0 |
| FiveThirtyEight | until October 31, 2020 | November 1, 2020 | 43.4% | 51.2% | 5.4% | Trump +7.8 |
| Average | 43.4% | 50.3% | 6.3% | Trump +6.9 | ||
- Polls
| Poll source | Date(s) administered |
Sample size[lower-alpha 7] |
Margin of error |
Donald Trump Republican |
Joe Biden Democratic |
Jo Jorgensen Libertarian |
Other | Undecided |
|---|---|---|---|---|---|---|---|---|
| SurveyMonkey/Axios | Oct 20 – Nov 2, 2020 | 634 (LV) | ± 5% | 54%[lower-alpha 8] | 45% | – | – | – |
| Gravis Marketing | Oct 26–28, 2020 | 770 (LV) | ± 3.5% | 52% | 43% | – | – | 5% |
| SurveyMonkey/Axios | Oct 1–28, 2020 | 1,147 (LV) | – | 54% | 44% | – | – | – |
| Public Policy Polling/Protect Our Care[upper-alpha 4] | Oct 19–20, 2020 | 800 (V) | ± 3.5% | 50% | 45% | - | – | 5% |
| Siena College/NYT Upshot | Oct 9–14, 2020 | 423 (LV) | ± 5.7% | 45% | 39% | 8% | 2%[lower-alpha 9] | 6%[lower-alpha 10] |
| Patinkin Research Strategies | Sep 30 – Oct 4, 2020 | 600 (LV) | ± 4% | 49% | 46% | – | 3%[lower-alpha 11] | 2% |
| Alaska Survey Research | Sep 26 – Oct 4, 2020 | 696 (LV) | – | 50% | 46% | - | - | 4% |
| SurveyMonkey/Axios | Sep 1–30, 2020 | 563 (LV) | – | 53% | 45% | - | - | 2% |
| Harstad Strategic Research/Independent Alaska[upper-alpha 5] | Sep 20–23, 2020 | 602 (LV) | ± 4% | 47% | 46% | - | - | – |
| SurveyMonkey/Axios | Aug 1–31, 2020 | 472 (LV) | – | 57% | 42% | - | - | 1% |
| SurveyMonkey/Axios | Jul 1–31, 2020 | 412 (LV) | – | 55% | 43% | - | - | 2% |
| Public Policy Polling (D)[upper-alpha 6] | Jul 23–24, 2020 | 885 (V) | – | 50% | 44% | - | - | 6% |
| Public Policy Polling[lower-alpha 12] | Jul 7–8, 2020 | 1,081 (RV) | ± 3.0% | 48% | 45% | - | - | 6% |
| Alaska Survey Research | Jun 23 – Jul 7, 2020 | 663 (LV) | ± 3.9% | 49% | 48% | - | - | 4% |
| SurveyMonkey/Axios | Jun 8–30, 2020 | 161 (LV) | – | 52% | 46% | - | - | 2% |
| Zogby Interactive/JZ Analytics | Jul 22 – Aug 9, 2019 | 321 (LV) | ± 5.5% | 45% | 40% | - | - | 15% |
Arizona
- Graphical summary
Aggregate polls
| Source of poll aggregation |
Dates administered |
Dates updated |
Joe Biden Democratic |
Donald Trump Republican |
Other/ Undecided [lower-alpha 1] |
Margin |
|---|---|---|---|---|---|---|
| 270 to Win | October 22 – November 2, 2020 | November 3, 2020 | 48.0% | 45.8% | 6.2% | Biden +2.2 |
| Real Clear Politics | October 25 – November 1, 2020 | November 3, 2020 | 47.9% | 47.0% | 5.1% | Biden +0.9 |
| FiveThirtyEight | until November 2, 2020 | November 3, 2020 | 48.7% | 46.1% | 5.2% | Biden +2.6 |
| Average | 48.2% | 46.3% | 5.5% | Biden +1.9 | ||
2020 polls
| Poll source | Date(s) administered |
Sample size[lower-alpha 13] |
Margin of error |
Donald Trump Republican |
Joe Biden Democratic |
Jo Jorgensen Libertarian |
Howie Hawkins Green |
Other | Undecided |
|---|---|---|---|---|---|---|---|---|---|
| Ipsos/Reuters | Oct 27 – Nov 2 | 610 (LV) | ± 4.5% | 47%[lower-alpha 14] | 50% | 1% | 0% | 2%[lower-alpha 15] | – |
| 47%[lower-alpha 16] | 49% | - | - | 2%[lower-alpha 17] | 1% | ||||
| 48%[lower-alpha 18] | 50% | - | - | 2%[lower-alpha 19] | – | ||||
| SurveyMonkey/Axios | Oct 20 – Nov 2 | 4,278 (LV) | ± 2.5% | 46%[lower-alpha 20] | 52% | - | - | – | – |
| Change Research/CNBC | Oct 29 – Nov 1 | 409 (LV) | ± 4.85% | 47% | 50% | 2% | - | – | 1% |
| Marist College/NBC | Oct 29 – Nov 1 | 717 (LV) | ± 4.5% | 48% | 48% | - | - | 3% | 1% |
| Swayable | Oct 27 – Nov 1 | 360 (LV) | ± 7.1% | 46% | 51% | 4% | - | – | – |
| Data for Progress | Oct 27 – Nov 1 | 1,195 (LV) | ± 2.8% | 47% | 50% | 2% | 1% | 0%[lower-alpha 21] | – |
| AtlasIntel | Oct 30–31 | 641 (LV) | ± 4% | 50.4% | 48.1% | - | - | 1.5%[lower-alpha 22] | – |
| Emerson College | Oct 29–31 | 732 (LV) | ± 3.6% | 46% | 48% | - | - | 6%[lower-alpha 23] | – |
| Morning Consult | Oct 22–31 | 1,059 (LV) | ± 3% | 46% | 48% | - | - | – | – |
| Data Orbital | Oct 28–30 | 550 (LV) | ± 4.2% | 45.3% | 45.9% | 3% | - | 6%[lower-alpha 24] | 5% |
| Siena College/NYT Upshot | Oct 26–30 | 1,253 (LV) | ± 3% | 43% | 49% | 3% | - | 1%[lower-alpha 25] | 5%[lower-alpha 26] |
| Grand Canyon Battleground Poll | Oct 25–30 | 910 (LV) | ± 3.1% | 48% | 45% | 3% | - | 4% | |
| CNN/SSRS | Oct 23–30 | 892 (LV) | ± 4.0% | 46% | 50% | 3% | - | 1%[lower-alpha 27] | 1% |
| Pulse Opinion Research/Rasmussen Reports | Oct 27–29 | 800 (LV) | ± 3.5% | 49% | 45% | - | - | 3%[lower-alpha 28] | – |
| Redfield & Wilton Strategies | Oct 26–29 | 889 (LV) | – | 46% | 50% | 2% | 0% | 1% | 2% |
| Gravis Marketing | Oct 26–28 | 704 (LV) | ± 3.7% | 44% | 48% | - | - | – | 8% |
| Trafalgar Group | Oct 25–28 | 1,002 (LV) | ± 3% | 49% | 46.5% | 2.1% | - | 1.7%[lower-alpha 29] | 0.7% |
| SurveyMonkey/Axios | Oct 1–28 | 5,687 (LV) | – | 46% | 52% | - | - | – | – |
| Ipsos/Reuters | Oct 21–27 | 714 (LV) | ± 4.2% | 47%[lower-alpha 14] | 47% | 2% | 0% | 3%[lower-alpha 30] | – |
| 46%[lower-alpha 31] | 48% | - | - | 3%[lower-alpha 32] | 2% | ||||
| Swayable | Oct 23–26 | 304 (LV) | ± 7.2% | 44% | 52% | 3% | - | – | – |
| Justice Collaborative Project[upper-alpha 7] | Oct 22–25 | 874 (LV) | ± 3.1% | 43% | 49% | - | - | – | 5% |
| OH Predictive Insights | Oct 22–25 | 716 (LV) | ± 3.7% | 46% | 49% | 3% | - | 1%[lower-alpha 33] | 1% |
| Univision/University of Houston/Latino Decisions/North Star Opinion Research |
Oct 17–25 | 725 (RV) | ± 3.64% | 45% | 50% | - | - | 2%[lower-alpha 34] | 3% |
| Patinkin Research Strategies/Arizona Research Consortium (D) | Oct 21–24 | 729 (LV) | ± 3.6% | 45% | 52% | - | - | 2% | 1% |
| Y2 Analytics/Salt Lake Tribune | Oct 15–24 | 700 (LV) | ± 3.7% | 47% | 50% | - | - | – | – |
| Susquehanna Polling & Research Inc./Center for American Greatness[upper-alpha 8] | Oct 19–22 | 504 (LV) | ± 4.4% | 46%[lower-alpha 35] | 46% | 4% | - | 2%[lower-alpha 36] | 1% |
| Ipsos/Reuters | Oct 14–21 | 658 (LV) | ± 4.4% | 46%[lower-alpha 14] | 50% | 1% | - | 2%[lower-alpha 37] | – |
| 46%[lower-alpha 38] | 49% | - | - | 3%[lower-alpha 39] | 2% | ||||
| Morning Consult | Oct 11–20 | 1,066 (LV) | ± 3% | 48% | 47% | - | - | – | – |
| Pulse Opinion Research/Rasmussen Reports | Oct 18–19 | 800 (LV) | ± 3.5% | 46% | 48% | - | - | 3%[lower-alpha 40] | 3% |
| Change Research/CNBC | Oct 16–19 | 232 (LV)[lower-alpha 41] | – | 45% | 51% | - | - | – | – |
| RMG Research/PoliticalIQ | Oct 14–19 | 800 (LV) | ± 3.5% | 46%[lower-alpha 14] | 47% | - | - | 3%[lower-alpha 42] | 5% |
| 44%[lower-alpha 43] | 49% | - | - | 3%[lower-alpha 44] | 5% | ||||
| 47%[lower-alpha 45] | 45% | - | - | 3%[lower-alpha 46] | 5% | ||||
| Data Orbital | Oct 16–18 | 550 (LV) | ± 4.18% | 42% | 47% | 3% | - | 5%[lower-alpha 47] | 2% |
| YouGov/CBS | Oct 13–16 | 1,074 (LV) | ± 4.1% | 45% | 49% | - | - | 3%[lower-alpha 48] | 3% |
| Ipsos/Reuters | Oct 7–14 | 667 (LV) | ± 4.3% | 47%[lower-alpha 14] | 49% | 1% | 0% | 2%[lower-alpha 49] | – |
| 46%[lower-alpha 50] | 50% | - | - | 2%[lower-alpha 51] | 3% | ||||
| Monmouth University | Oct 11–13 | 502 (RV) | ± 4.4% | 44% | 50% | 2% | - | 1%[lower-alpha 52] | 4% |
| 502 (LV) | 44%[lower-alpha 53] | 51% | - | - | 2% | – | |||
| 47%[lower-alpha 54] | 49% | - | - | 1% | – | ||||
| Redfield & Wilton Strategies | Oct 10–13 | 750 (LV) | – | 45%[lower-alpha 41] | 48% | 1% | 0% | – | – |
| Morning Consult | Oct 2–11 | 1,144 (LV) | ± 2.9% | 46% | 49% | - | - | – | – |
| Redfield & Wilton Strategies | Oct 9–10 | 720 (LV) | – | 46%[lower-alpha 41] | 48% | 1% | 0% | – | – |
| Trafalgar Group | Oct 6–8 | 1,087 (LV) | ± 2.89% | 48% | 44% | 2% | - | 2%[lower-alpha 55] | 5% |
| OH Predictive Insights | Oct 4–8 | 608 (LV) | ± 3.97% | 45%[lower-alpha 14] | 49% | 4% | - | 0%[lower-alpha 56] | 3% |
| 47%[lower-alpha 57] | 50% | - | - | 0%[lower-alpha 58] | 3% | ||||
| Redfield and Wilton Strategies | Oct 4–7 | 727 (LV) | ± 3.63% | 43% | 49% | 1% | 1% | 1%[lower-alpha 59] | 6% |
| Ipsos/Reuters | Sep 29 – Oct 7 | 633 (LV) | ± 4.3% | 46% | 48% | - | - | 2%[lower-alpha 60] | 4% |
| Latino Decisions/Democrats for Education Reform[upper-alpha 9] | Sep 28 – Oct 6 | 600 (LV) | ± 4% | 45% | 48% | - | - | – | 5% |
| Basswood Research/American Action Forum[upper-alpha 10] | Oct 3–5 | 800 (LV) | ± 3.5% | 48% | 48% | 2% | - | – | 3% |
| Data Orbital | Oct 3–5 | 550 (LV) | ± 4.18% | 43% | 48% | 3% | - | 3%[lower-alpha 61] | 4% |
| HighGround Inc. | Sep 28 – Oct 5 | 400 (LV) | ± 4.9% | 45% | 46% | - | - | 4%[lower-alpha 62] | 5% |
| Change Research/CNBC | Oct 2–4 | 296 (LV) | – | 45% | 51% | - | - | – | – |
| Siena College/NYT Upshot | Oct 1–3 | 655 (LV) | ± 4.2% | 41% | 49% | 3% | – | 1%[lower-alpha 63] | 6%[lower-alpha 64] |
| Patinkin Research Strategies/Arizona Research Consortium (D) | Oct 1–3 | 604 (LV) | ± 3.8% | 46% | 50% | - | - | 3% | 1% |
| Targoz Market Research/PollSmart | Sep 23 – Oct 2 | 1,045 (LV) | ± 3.03% | 46% | 45% | - | - | 10% | – |
| Suffolk University | Sep 26–30 | 500 (LV) | ± 4.4% | 46% | 50% | 1% | - | 1%[lower-alpha 65] | 2% |
| SurveyMonkey/Axios | Sep 1–30 | 7,100 (LV) | – | 47% | 51% | - | - | – | 2% |
| Strategies 360/Smart and Safe Arizona[upper-alpha 11] | Sep 24–29 | 800 (LV) | ± 3.5% | 45% | 49% | - | - | 2%[lower-alpha 66] | 4% |
| Susquehanna Polling & Research Inc/Center for American Greatness[upper-alpha 8] | Sep 25–28 | 500 (LV) | ± 4.3% | 47% | 47% | - | - | – | – |
| Data for Progress (D) | Sep 23–28 | 808 (LV) | ± 3.4% | 45%[lower-alpha 14] | 49% | 1% | 0% | – | 4% |
| 46%[lower-alpha 67] | 50% | - | - | – | 4% | ||||
| Redfield & Wilton Strategies | Sep 23–26 | 871 (LV) | ± 3.32% | 44% | 47% | 1% | 1% | 1%[lower-alpha 68] | 6% |
| Data For Progress[upper-alpha 12] | Sep 15–22 | 481 (LV) | ± 4.4% | 46% | 45% | - | - | – | 10% |
| Change Research/CNBC | Sep 18–20 | 262 (LV) | – | 43% | 49% | - | - | – | – |
| ABC/Washington Post | Sep 15–20 | 579 (LV) | ± 4.5% | 49% | 48% | - | - | 2%[lower-alpha 69] | 1% |
| Hart Research Associates/Human Rights Campaign[upper-alpha 13] | Sep 17–19 | 400 (LV) | ± 4.9% | 42% | 53% | - | - | – | – |
| Data Orbital | Sep 14–17 | 550 (LV) | – | 47% | 49% | - | - | – | – |
| Ipsos/Reuters | Sep 11–17 | 565 (LV) | ± 4.7% | 46% | 47% | - | - | 2%[lower-alpha 70] | 5% |
| Redfield & Wilton Strategies | Sep 12–16 | 855 (LV) | ± 3.35% | 42% | 47% | 1% | 0% | 1%[lower-alpha 71] | 8% |
| Monmouth University | Sep 11–15 | 420 (RV) | ± 4.8% | 44% | 48% | 4% | - | 1%[lower-alpha 72] | 3% |
| 420 (LV) | 46%[lower-alpha 73] | 48% | - | - | 3% | 3% | |||
| 47%[lower-alpha 74] | 47% | - | - | 3% | 3% | ||||
| Siena College/NYT Upshot | Sep 10–15 | 653 (LV) | ± 4.1% | 40% | 49% | 4% | - | 1%[lower-alpha 75] | 6%[lower-alpha 76] |
| Patinkin Research Strategies/Arizona Research Consortium (D) | Sep 10–13 | 679 (LV) | ± 3.8% | 46% | 49% | - | - | 4% | 2% |
| Kaiser Family Foundation/Cook Political Report | Aug 29 – Sep 13 | 1,298 (RV) | ± 3% | 40% | 45% | - | - | 4%[lower-alpha 77] | 11% |
| Gravis Marketing | Sep 10–11 | 684 (LV) | ± 3.8% | 48% | 50% | - | - | – | 2% |
| YouGov/CBS | Sep 9–11 | 1,106 (LV) | ± 3.9% | 44% | 47% | - | - | 3%[lower-alpha 78] | 6% |
| OH Predictive Insights | Sep 8–10 | 600 (LV) | ± 4% | 42% | 52% | - | - | – | 5% |
| Benenson Strategy Group/GS Strategy Group/AARP | Aug 28 – Sep 8 | 1,600 (LV) | ± 2.5% | 47% | 48% | - | - | 1%[lower-alpha 79] | 4% |
| Morning Consult | Aug 29 – Sep 7 | 901 (LV) | ± (2%–4%) | 46%[lower-alpha 80] | 49% | - | - | – | – |
| Change Research/CNBC | Sep 4–6 | 470 (LV) | – | 45% | 49% | - | - | 6%[lower-alpha 81] | – |
| Redfield & Wilton Strategies | Aug 30 – Sep 4 | 830 (LV) | ± 3.4% | 43% | 48% | 0% | 1% | 0%[lower-alpha 82] | 6% |
| FOX News | Aug 29 – Sep 1 | 772 (LV) | ± 3.5% | 40% | 49% | 3% | - | 1%[lower-alpha 83] | 6% |
| 858 (RV) | ± 3.0% | 39% | 49% | 3% | - | 3%[lower-alpha 84] | 6% | ||
| Basswood Research/American Action Forum[upper-alpha 10] | Aug 29–31, 2020 | 800 (LV) | ± 3.5% | 48%[lower-alpha 14] | 47% | 1%[lower-alpha 85] | 2% | – | 2% |
| 49%[lower-alpha 86] | 48% | - | - | – | 3% | ||||
| SurveyMonkey/Axios | Aug 1–31 | 6,456 (LV) | – | 52% | 47% | - | - | – | 2% |
| Morning Consult | Aug 21–30 | 943 (LV) | ± 3.0% | 42% | 52% | - | - | – | – |
| Change Research/CNBC | Aug 21–23 | 344 (LV) | – | 47% | 49% | - | - | – | – |
| Redfield and Wilton Strategies | Aug 16–18 | 856 (LV) | ± 3.4% | 38% | 47% | 1% | 1% | 3%[lower-alpha 87] | 10% |
| Morning Consult | Aug 7–16 | 947 (LV) | ± (2%–4%) | 47% | 45% | - | - | – | – |
| Emerson College | Aug 8–10 | 661 (LV) | ± 3.8% | 47%[lower-alpha 88] | 53% | - | - | – | – |
| Change Research/CNBC | Aug 7–9 | 428 (LV) | – | 44% | 45% | - | - | – | – |
| Trafalgar Group | Aug 5–8 | 1,013 (LV) | ± 2.9% | 46% | 45% | 3% | - | 1%[lower-alpha 89] | 4% |
| OH Predictive Insights | Aug 3–4 | 603 (LV) | ± 4.0% | 45% | 49% | - | - | – | – |
| OnMessage Inc./Heritage Action[upper-alpha 14] | Aug 2–4 | 400 (LV) | ± 4.9% | 51% | 48% | - | - | – | 2% |
| Data for Progress | Jul 24 – Aug 2 | 1,215 (LV) | – | 43%[lower-alpha 14] | 45% | 2% | 1% | – | 10% |
| 44%[lower-alpha 90] | 47% | - | - | – | 8% | ||||
| SurveyMonkey/Axios | Jul 1–31 | 4,995 (LV) | – | 51% | 47% | - | - | – | 2% |
| Change Research/CNBC | Jul 24–26 | 365 (LV) | – | 45% | 47% | - | - | – | – |
| Morning Consult | Jul 17–26 | 908 (LV) | ± 3.3% | 42%[lower-alpha 91] | 49% | - | - | – | – |
| Morning Consult | Jul 16–25 | – (LV)[lower-alpha 92] | – | 43% | 49% | - | - | – | – |
| CNN/SSRS | Jul 18–24 | 873 (RV) | ± 3.8% | 45% | 49% | - | - | 4%[lower-alpha 93] | 2% |
| Redfield & Wilton Strategies | Jul 19–23 | 858 (LV) | – | 38% | 46% | 2% | 1% | 3%[lower-alpha 94] | 11% |
| NBC News/Marist College | Jul 14–22 | 826 (RV) | ± 4.1% | 45% | 50% | - | - | 1% | 3% |
| Public Policy Polling/AFSCME[upper-alpha 6] | Jul 17–18 | 960 (RV) | – | 45% | 49% | - | - | – | 6% |
| Spry Strategies/American Principles Project[upper-alpha 15] | Jul 11–16 | 700 (LV) | ± 3.7% | 45% | 49% | - | - | – | 6% |
| Morning Consult | Jul 6–15 | – (LV)[lower-alpha 95] | – | 45% | 47% | - | - | – | – |
| Change Research/CNBC | Jul 10–12 | 345 (LV) | – | 45% | 51% | - | - | – | – |
| YouGov/CBS | Jul 7–10 | 1,087 (LV) | ± 3.8% | 46% | 46% | - | - | 4%[lower-alpha 96] | 4% |
| OH Predictive Insights | Jul 6–7 | 600 (LV) | ± 4.0% | 44% | 49% | - | - | 0%[lower-alpha 97] | 7% |
| Morning Consult | Jun 26 – Jul 5 | – (LV)[lower-alpha 98] | – | 42% | 48% | - | - | – | – |
| SurveyMonkey/Axios | Jun 8–30 | 2,365 (LV) | – | 52% | 46% | - | - | – | 2% |
| Data Orbital | Jun 27–29 | 600 (LV) | ± 4.0% | 45% | 47% | - | - | 3.3%[lower-alpha 99] | 4.2% |
| Morning Consult | Jun 16–25 | – (LV)[lower-alpha 100] | – | 43% | 47% | - | - | – | – |
| Change Research/CNBC | Jun 26–28 | 311 (LV)[lower-alpha 41] | – | 44% | 51% | - | - | – | – |
| Gravis Marketing/OANN | Jun 27 | 527 (LV) | ± 4.3% | 49% | 45% | - | - | – | 7% |
| Redfield & Wilton Strategies | Jun 14–17 | 865 (LV) | ± 3.3% | 39% | 43% | 2% | 1% | 2%[lower-alpha 101] | 13% |
| Siena College/NYT Upshot | Jun 8–16 | 650 (RV) | ± 4.3% | 41% | 48% | - | - | 4%[lower-alpha 102] | 8% |
| Civiqs/Daily Kos | Jun 13–15 | 1,368 (RV) | ± 2.9% | 45% | 49% | - | - | 5%[lower-alpha 103] | 1% |
| Morning Consult | Jun 6–15 | – (LV)[lower-alpha 104] | – | 44% | 47% | - | - | – | – |
| Change Research/CNBC | Jun 12–14 | 201 (LV)[lower-alpha 41] | – | 44% | 45% | - | - | 5%[lower-alpha 105] | – |
| Morning Consult | May 27 – Jun 5 | – (LV)[lower-alpha 106] | – | 47% | 45% | - | - | – | – |
| FOX News | May 30 – Jun 2 | 1,002 (RV) | ± 3% | 42% | 46% | - | - | 6%[lower-alpha 107] | 5% |
| Change Research/CNBC | May 29–31 | 329 (LV)[lower-alpha 41] | – | 45% | 44% | - | - | 9% | 2% |
| Morning Consult | May 17–26 | 784 (LV) | – | 47%[lower-alpha 108] | 45% | - | - | – | – |
| Morning Consult | May 16–25 | – (LV)[lower-alpha 109] | – | 46% | 46% | - | - | – | – |
| HighGround Inc. | May 18–22 | 400 (LV) | ± 4.9% | 45% | 47% | - | - | 4%[lower-alpha 110] | 4%[lower-alpha 111] |
| Redfield & Wilton Strategies | May 10–14 | 946 (LV) | ± 3.2% | 41% | 45% | - | - | 3%[lower-alpha 112] | 10% |
| OH Predictive Insights | May 9–11 | 600 (LV) | ± 4% | 43% | 50% | - | - | 1%[lower-alpha 113] | 6% |
| Morning Consult | May 6–15 | – (LV)[lower-alpha 114] | – | 47% | 45% | - | - | – | – |
| GBAO Strategies/PLUS Paid Family Leave | Apr 13–16 | 500 (LV) | – | 46% | 47% | - | - | 2% | 5% |
| OH Predictive Insights | Apr 7–8 | 600 (LV) | ± 4.0% | 43% | 52% | - | - | – | – |
| NBC News/Wall Street Journal/Marist College | Mar 10–15 | 2,523 (RV) | ± 2.7% | 46% | 47% | - | - | 1% | 5% |
| Monmouth University | Mar 11–14 | 847 (RV) | ± 3.4% | 43% | 46% | - | - | 2% | 6% |
| Univision | Mar 6–11 | 1,036 (RV) | ± 3.0% | 42% | 50% | - | - | – | 8% |
| OH Predictive Insights | Mar 3–4 | 600 (LV) | ± 4.0% | 43% | 49% | - | - | – | 8% |
| Public Policy Polling | Mar 2–3 | 666 (V) | – | 46% | 47% | - | - | – | 6% |
| Climate Nexus | Feb 11–15 | 539 (RV) | ± 4.3% | 46% | 42% | - | - | – | 13% |
| Fabrizio, Lee & Associates/Team McSally/Politico[upper-alpha 16] | Jan 22–24 | 1,000 (LV) | ± 3.1% | 50% | 45% | - | - | – | 6% |
| Public Policy Polling | Jan 2–4 | 760 (V) | – | 46% | 46% | - | - | – | 8% |
2019 polls
| Poll source | Date(s) administered |
Sample size[lower-alpha 2] |
Margin of error |
Donald Trump Republican |
Joe Biden Democratic |
Other | Undecided |
|---|---|---|---|---|---|---|---|
| OH Predictive Insights | Dec 3–4 | 628 (LV) | ± 3.91% | 46% | 44% | 0%[lower-alpha 115] | 10% |
| Emerson College | Oct 25–28 | 901 (RV) | ± 3.2% | 50% | 50% | – | – |
| Siena College/NYT Upshot | Oct 13–23 | 652 (LV) | ± 4.4% | 46% | 49% | – | – |
| Bendixen & Amandi International | Sep 9–12 | 520 (RV) | ± 4.3% | 43% | 42% | 12% | 3% |
| OH Predictive Insights | Aug 13–14 | 600 (LV) | ± 4.0% | 43% | 45% | – | 12% |
| Fabrizio Ward LLC | Jul 29–31 | 600 (LV) | ± 4.0% | 50% | 45% | – | 4% |
| OH Predictive Insights | May 1–2 | 600 (LV) | ± 4.0% | 44% | 49% | – | 7% |
| OH Predictive Insights | Feb 12–13 | 600 (LV) | ± 4.0% | 46% | 46% | – | 7% |
Arkansas
Graphical summary
Aggregate polls
| Source of poll aggregation |
Dates administered |
Dates updated |
Joe Biden Democratic |
Donald Trump Republican |
Other/ Undecided [lower-alpha 1] |
Margin |
|---|---|---|---|---|---|---|
| 270 to Win | September 20 – October 21, 2020 | October 28, 2020 | 35.0% | 60.3% | 4.7% | Trump +25.3 |
| FiveThirtyEight | until October 27, 2020 | October 28, 2020 | 35.5% | 59.7% | 4.8% | Trump +24.2 |
| Average | 35.3% | 60.0% | 4.7% | Trump +24.7 | ||
Polls
| Poll source | Date(s) administered |
Sample size[lower-alpha 2] |
Margin of error |
Donald Trump Republican |
Joe Biden Democratic |
Jo Jorgensen Libertarian |
Howie Hawkins Green |
Other | Undecided |
|---|---|---|---|---|---|---|---|---|---|
| SurveyMonkey/Axios | Oct 20 – Nov 2, 2020 | 1,309 (LV) | ± 4% | 61%[lower-alpha 116] | 38% | - | - | – | – |
| SurveyMonkey/Axios | Oct 1–28, 2020 | 2,239 (LV) | – | 60% | 38% | - | - | – | – |
| University of Arkansas | Oct 9–21, 2020 | 591 (LV) | ± 3.9% | 65% | 32% | - | - | 3% | – |
| Hendrix College/Talk Business & Politics | Oct 11–13, 2020 | 647 (LV) | ± 4.9% | 58% | 34% | 2% | 1% | 2%[lower-alpha 117] | 4% |
| SurveyMonkey/Axios | Sep 1–30, 2020 | 771 (LV) | – | 62% | 38% | - | - | – | 1% |
| SurveyMonkey/Axios | Aug 1–31, 2020 | 689 (LV) | – | 67% | 32% | - | - | – | 1% |
| SurveyMonkey/Axios | Jul 1–31, 2020 | 747 (LV) | – | 66% | 32% | - | - | – | 2% |
| SurveyMonkey/Axios | Jun 8–30, 2020 | 354 (LV) | – | 59% | 38% | - | - | – | 2% |
| Hendrix College/Talk Business & Politics | Jun 9–10, 2020 | 869 (LV) | ± 3.3% | 47% | 45% | - | - | 5%[lower-alpha 118] | 3% |
California
- Graphical summary
Aggregate polls
| Source of poll aggregation |
Dates administered |
Dates updated |
Joe Biden Democratic |
Donald Trump Republican |
Other/ Undecided [lower-alpha 1] |
Margin |
|---|---|---|---|---|---|---|
| 270 to Win | September 26 – October 21, 2020 | October 27, 2020 | 61.0% | 32.3% | 6.7% | Biden +28.7 |
| Real Clear Politics | September 26 – October 21, 2020 | October 27, 2020 | 60.7% | 31.0% | 8.3% | Biden +29.7 |
| FiveThirtyEight | until October 25, 2020 | October 27, 2020 | 61.1% | 31.9% | 6.9% | Biden +29.3 |
| Average | 61.0% | 31.7% | 7.3% | Biden +29.3 | ||
Polls
| Poll source | Date(s) administered |
Sample size[lower-alpha 119] |
Margin of error |
Donald Trump Republican |
Joe Biden Democratic |
Jo Jorgensen Libertarian |
Howie Hawkins Green |
Other | Undecided |
|---|---|---|---|---|---|---|---|---|---|
| SurveyMonkey/Axios | Oct 20 – Nov 2, 2020 | 12,370 (LV) | ± 1.5% | 36%[lower-alpha 120] | 62% | – | – | – | – |
| David Binder Research | Oct 28 – Nov 1, 2020 | 800 (LV) | – | 31% | 62% | – | – | 3% | 4% |
| USC Schwarzenegger Institute | Oct 27–31, 2020 | 1,155 (RV) | ± 3% | 28% | 65% | – | – | 4%[lower-alpha 121] | 2% |
| SurveyMonkey/Tableau | Sep 30 – Oct 28, 2020 | 22,450 (LV) | – | 37%[lower-alpha 122] | 61% | – | – | – | – |
| Swayable | Oct 23–26, 2020 | 635 (LV) | ± 5.2% | 35% | 62% | 2% | 1% | – | – |
| UC Berkeley/LA Times | Oct 16–21, 2020 | 5,352 (LV) | ± 2% | 29% | 65% | 1% | 0% | 0%[lower-alpha 123][lower-alpha 124] | 3% |
| Public Policy Institute of California | Oct 9–18, 2020 | 1,185 (LV) | ± 4.3% | 32% | 58% | 3% | 2% | 1%[lower-alpha 125] | 4% |
| SurveyMonkey/Tableau | Sep 1–30, 2020 | 20,346 (LV) | – | 35% | 63% | – | – | – | 2% |
| SurveyUSA | Sep 26–28, 2020 | 588 (LV) | ± 5.4% | 34% | 59% | – | – | 3%[lower-alpha 126] | 6% |
| Redfield & Wilton Strategies | Sep 19–21, 2020 | 1,775 (LV) | – | 28% | 62% | 1% | 1% | 1%[lower-alpha 127] | 8% |
| UC Berkeley/LA Times | Sep 9–15, 2020 | 5,942 (LV) | ± 2% | 28% | 67% | 1% | 0% | 0%[lower-alpha 128][lower-alpha 129] | 3% |
| Public Policy Institute of California | Sep 4–13, 2020 | 1,168 (LV) | ± 4.3% | 31% | 60% | 3% | 2% | 1%[lower-alpha 130] | 2% |
| Spry Strategies/Women's Liberation Front | Aug 29 – Sep 1, 2020 | 600 (LV) | ± 4% | 39% | 56% | – | – | – | 5% |
| SurveyMonkey/Tableau | Aug 1–31, 2020 | 17,537 (LV) | – | 35% | 63% | – | – | – | 2% |
| David Binder Research | Aug 22–24, 2020 | 800 (LV) | – | 31% | 61% | – | – | 3%[lower-alpha 131] | 5% |
| Redfield and Wilton Strategies | Aug 9, 2020 | 1,904 (LV) | ± 2.3% | 25% | 61% | 1% | 1% | 2%[lower-alpha 132] | 9% |
| SurveyMonkey/Tableau | Jul 1–31, 2020 | 19,027 (LV) | – | 35% | 63% | – | – | – | 2% |
| University of California Berkeley | Jul 21–27, 2020 | 6,756 (LV) | ± 2.0% | 28% | 67% | – | – | – | 5% |
| SurveyMonkey/Tableau | Jun 8–30, 2020 | 8,412 (LV) | – | 36% | 62% | – | – | – | 2% |
| Public Policy Institute of California | May 19–26, 2020 | 1,048 (LV) | ± 4.6% | 33% | 57% | – | – | 6%[lower-alpha 133] | 3% |
| SurveyUSA | May 18–19, 2020 | 537 (LV) | ± 5.4% | 30% | 58% | – | – | 5% | 7% |
| Emerson College | May 8–10, 2020 | 800 (RV) | ± 3.4% | 35%[lower-alpha 134] | 65% | – | – | – | – |
| Public Policy Polling | Mar 28–29, 2020 | 962 (RV) | – | 29% | 67% | – | – | – | 3% |
| AtlasIntel | Feb 24 – Mar 2, 2020 | 1,100 (RV) | ± 3.0% | 26% | 62% | – | – | 12% | – |
| YouGov | Feb 26–28, 2020 | 1,507 (RV) | – | 31% | 59% | – | – | 4% | 4% |
| CNN/SSRS | Feb 22–26, 2020 | 951 (RV) | ± 3.3% | 35% | 60% | – | – | 3%[lower-alpha 135] | 3% |
| University of California Berkeley | Feb 20–25, 2020 | 5,526 (RV) | – | 31% | 58% | – | – | – | 11% |
| SurveyUSA | Feb 13–16, 2020 | 1,196 (RV) | ± 3.1% | 37% | 57% | – | – | – | 6% |
| YouGov/USC Price-Schwarzenegger Institute | Feb 1–15, 2020 | 1,200 (RV) | ± 3.1% | 30% | 60% | – | – | – | 4% |
| SurveyUSA | Jan 14–16, 2020 | 1,967 (RV) | ± 2.8% | 35% | 59% | – | – | – | 6% |
| CNN/SSRS | Dec 4–8, 2019 | 1,011 (RV) | ± 3.4% | 36% | 56% | – | – | 3%[lower-alpha 136] | 5% |
| SurveyUSA | Nov 20–22, 2019 | 2,039 (RV) | ± 2.4% | 32% | 59% | – | – | – | 9% |
| SurveyUSA | Oct 15–16, 2019 | 1,242 (RV) | ± 3.8% | 32% | 59% | – | – | – | 9% |
| Emerson College | Sep 13–16, 2019 | 830 (RV) | ± 3.3% | 36% | 64% | – | – | – | – |
| SurveyUSA | Sep 13–15, 2019 | 1,785 (RV) | ± 3.2% | 31% | 57% | – | – | – | 11% |
| SurveyUSA | Aug 1–5, 2019 | 2,184 (RV) | ± 2.7% | 27% | 61% | – | – | – | 12% |
| SurveyUSA | Mar 22–25, 2018 | 882 (RV) | ± 3.8% | 33% | 56% | – | – | – | 11% |
Colorado
Graphical summary
Aggregate polls
| Source of poll aggregation |
Dates administered |
Dates updated |
Joe Biden Democratic |
Donald Trump Republican |
Other/ Undecided [lower-alpha 1] |
Margin |
|---|---|---|---|---|---|---|
| 270 to Win | October 5–20, 2020 | October 26, 2020 | 52.2% | 40.2% | 7.6% | Biden +12.0 |
| FiveThirtyEight | until November 1, 2020 | November 1, 2020 | 53.3% | 41.4% | 5.3% | Biden +11.9 |
| Average | 52.8% | 40.8% | 6.4% | Biden +12.0 | ||
Polls
| Poll source | Date(s) administered |
Sample size[lower-alpha 2] |
Margin of error |
Donald Trump Republican |
Joe Biden Democratic |
Jo Jorgensen Libertarian |
Howie Hawkins Green |
Other | Undecided |
|---|---|---|---|---|---|---|---|---|---|
| SurveyMonkey/Axios | Oct 20 – Nov 2, 2020 | 2,991 (LV) | ± 2.5% | 44%[lower-alpha 137] | 55% | - | - | – | – |
| Keating Research/Onsight Public Affairs/Colorado Sun | Oct 29 – Nov 1, 2020 | 502 (LV)[lower-alpha 138] | ± 4.4% | 41% | 53% | - | - | – | – |
| Data for Progress | Oct 27 – Nov 1, 2020 | 709 (LV) | ± 3.7% | 42% | 54% | 3% | 1% | 0%[lower-alpha 139] | – |
| Swayable | Oct 23 – Nov 1, 2020 | 455 (LV) | ± 6% | 41% | 55% | 3% | 1% | – | – |
| Morning Consult | Oct 22–31, 2020 | 727 (LV) | ± 4% | 41% | 54% | - | - | – | – |
| SurveyMonkey/Axios | Oct 1–28, 2020 | 5,925 (LV) | – | 40% | 59% | - | - | – | – |
| Morning Consult | Oct 11–20, 2020 | 788 (LV) | ± 3.5% | 39% | 55% | - | - | – | – |
| RBI Strategies | Oct 12–16, 2020 | 502 (LV) | ± 4.4% | 38% | 55% | 3% | 1% | 1%[lower-alpha 140] | 1% |
| RMG Research/PoliticalIQ | Oct 9–15, 2020 | 800 (LV) | ± 3.5% | 43% | 51% | - | - | 1%[lower-alpha 141] | 3% |
| Civiqs/Daily Kos | Oct 11–14, 2020 | 1,013 (LV) | ± 3.6% | 42% | 53% | - | - | 3%[lower-alpha 142] | 1% |
| Keating Research/OnSight Public Affairs/Melanson | Oct 8–13, 2020 | 519 (LV) | ± 4.3% | 39% | 54% | - | - | 3%[lower-alpha 143] | 4% |
| Morning Consult | Oct 2–11, 2020 | 837 (LV) | ± 3.4% | 40% | 54% | - | - | – | – |
| YouGov/University of Colorado | Oct 5–9, 2020 | 800 (LV) | ± 4.64% | 38% | 47% | - | - | 3% | 11% |
| SurveyUSA/9News/Colorado Politics | Oct 1–6, 2020 | 1,021 (LV) | ± 3.9% | 40% | 50% | - | - | 5%[lower-alpha 144] | 4% |
| SurveyMonkey/Axios | Sep 1–30, 2020 | 2,717 (LV) | – | 41% | 57% | - | - | – | 2% |
| Morning Consult | Aug 29 – Sep 7, 2020 | 657 (LV) | ± (2%–4%) | 43%[lower-alpha 145] | 49% | - | - | – | – |
| Fabrizio Ward/Hart Research Associates/AARP | Aug 30 – Sep 5, 2020 | 800 (LV) | ± 3.5% | 40% | 50% | - | - | 2%[lower-alpha 146] | 8% |
| Global Strategy Group/Progress Colorado[upper-alpha 17] | Aug 28 – Sep 1, 2020 | 800 (LV) | ± 3.5% | 39% | 50% | 4% | 1% | 1%[lower-alpha 147] | 4% |
| SurveyMonkey/Axios | Aug 1–31, 2020 | 2,385 (LV) | – | 41% | 57% | - | - | – | 2% |
| Morning Consult | Aug 21–30, 2020 | 638 (LV) | ± 4% | 41%[lower-alpha 148] | 51% | - | - | – | – |
| Morning Consult | Aug 16–25, 2020 | ~600 (LV) | ± 4.0% | 42% | 51% | - | - | – | – |
| Morning Consult | Aug 7–16, 2020 | 601 (LV) | ± 4% | 41%[lower-alpha 149] | 51% | - | - | – | – |
| Morning Consult | Aug 6–15, 2020 | ~600 (LV) | ± 4.0% | 41% | 51% | - | - | – | – |
| Morning Consult | Jul 7 – Aug 5, 2020 | ~600 (LV) | ± 4.0% | 40% | 52% | - | - | – | – |
| SurveyMonkey/Axios | Jul 1–31, 2020 | 2,337 (LV) | – | 40% | 58% | - | - | – | 2% |
| Morning Consult | Jul 17–26, 2020 | 616 (LV) | ± 4.0% | 39%[lower-alpha 150] | 52% | - | - | – | – |
| Morning Consult | Jul 13–22, 2020 | ~600 (LV) | ± 4.0% | 41% | 51% | - | - | – | – |
| Public Policy Polling/AFSCME[upper-alpha 6] | Jul 23–24, 2020 | 891 (V) | – | 41% | 54% | - | - | – | 5% |
| Public Policy Polling/End Citizens United | Jun 29–30, 2020 | 840 (V) | ± 3.4% | 39% | 56% | - | - | – | 5% |
| SurveyMonkey/Axios | Jun 8–30, 2020 | 1,088 (LV) | – | 42% | 57% | - | - | – | 2% |
| Morning Consult | May 17–26, 2020 | 572 (LV) | – | 42% | 50% | - | - | – | – |
| Global Strategy Group (D) | May 7–11, 2020 | 700 (RV) | ± 3.5% | 40% | 53% | - | - | – | 7% |
| Keating Research/OnSight Public Affairs/Melanson/Colorado Politics | May 1–3, 2020 | 600 (LV) | ± 4% | 36% | 55% | - | - | 3%[lower-alpha 151] | 6% |
| Montana State University Bozeman | Apr 10–19, 2020 | 379 (LV) | – | 35% | 53% | - | - | 3% | 8% |
| Climate Nexus | Feb 11–15, 2020 | 485 (RV) | ± 4.5% | 43% | 46% | - | - | – | 11% |
| Emerson College | Aug 16–19, 2019 | 1,000 (RV) | ± 3.0% | 45% | 55% | - | - | – | – |
| Fabrizio Ward/AARP | Jul 29–31, 2019 | 600 (LV) | ± 4.0% | 42% | 51% | - | - | 1%[lower-alpha 152] | 5% |
Connecticut
Graphical summary
Aggregate polls
| Source of poll aggregation |
Dates administered |
Dates updated |
Joe Biden Democratic |
Donald Trump Republican |
Other/ Undecided [lower-alpha 1] |
Margin |
|---|---|---|---|---|---|---|
| FiveThirtyEight | until October 24, 2020 | October 25, 2020 | 59.5% | 33.7% | 6.8% | Biden +25.8 |
Polls
| Poll source | Date(s) administered |
Sample size[lower-alpha 2] |
Margin of error |
Donald Trump Republican |
Joe Biden Democratic |
Jo Jorgensen Libertarian |
Howie Hawkins Green |
Other | Undecided |
|---|---|---|---|---|---|---|---|---|---|
| SurveyMonkey/Axios | Oct 20 – Nov 2, 2020 | 2,031 (LV) | ± 3.5% | 38%[lower-alpha 153] | 60% | - | - | – | – |
| Swayable | Oct 23 – Nov 1, 2020 | 367 (LV) | ± 6.2% | 33% | 64% | 2% | 1% | – | – |
| SurveyMonkey/Axios | Oct 1–28, 2020 | 3,782 (LV) | – | 35% | 63% | - | - | – | – |
| Sacred Heart University | Oct 8–21, 2020 | 1,000 (A) | ± 3.02% | 26% | 51% | - | - | 2% | 20% |
| SurveyMonkey/Axios | Sep 1–30, 2020 | 1,415 (LV) | – | 37% | 61% | - | - | – | 2% |
| SurveyMonkey/Axios | Aug 1–31, 2020 | 1,009 (LV) | – | 35% | 64% | - | - | – | 1% |
| SurveyMonkey/Axios | Jul 1–31, 2020 | 1,360 (LV) | – | 39% | 59% | - | - | – | 2% |
| SurveyMonkey/Axios | Jun 8–30, 2020 | 574 (LV) | – | 32% | 65% | - | - | – | 3% |
| SurveyUSA | May 19–24, 2020 | 808 (RV) | ± 4.5% | 33% | 52% | - | - | 7%[lower-alpha 154] | 8% |
| Quinnipiac University | Apr 30 – May 4, 2020 | 945 (RV) | ± 3.2% | 33% | 56% | - | - | 3%[lower-alpha 155] | 7% |
| Sacred Heart University/Hartford Courant | Mar 24 – Apr 3, 2020 | 1,000 (A) | ± 3.0% | 34% | 47% | - | - | – | – |
| Sacred Heart University/Hartford Courant | Feb 24 – Mar 12, 2020 | 1,000 (A) | ± 3.0% | 36% | 52% | - | - | – | – |
| Sacred Heart University/Hartford Courant | Dec 16, 2019 – Jan 2, 2020 | 1,000 (A) | ± 3.0% | 32% | 52% | - | - | – | 16% |
| Sacred Heart University/Hartford Courant | Sep 17 – Oct 2, 2019 | 1,000 (A) | ± 3.2% | 33% | 52% | - | - | – | 15% |
Delaware

Aggregate polls
| Source of poll aggregation |
Dates administered |
Dates updated |
Joe Biden Democratic |
Donald Trump Republican |
Other/ Undecided [lower-alpha 1] |
Margin |
|---|---|---|---|---|---|---|
| 270 to Win | September 1–30, 2020 | October 28, 2020 | 57.5% | 35.0% | 7.5% | Biden +22.5 |
| FiveThirtyEight | until October 27, 2020 | October 28, 2020 | 57.7% | 35.0% | 7.3% | Biden +22.7 |
| Average | 57.6% | 35.0% | 7.4% | Biden +22.6 | ||
| Poll source | Date(s) administered |
Sample size[lower-alpha 2] |
Margin of error |
Donald Trump Republican |
Joe Biden Democratic |
Jo Jorgensen Libertarian |
Howie Hawkins Green |
Undecided |
|---|---|---|---|---|---|---|---|---|
| SurveyMonkey/Axios | Oct 20 – Nov 2, 2020 | 656 (LV) | ± 6% | 38%[lower-alpha 156] | 60% | - | - | – |
| SurveyMonkey/Axios | Oct 1–28, 2020 | 1,323 (LV) | – | 37% | 62% | - | - | – |
| SurveyMonkey/Axios | Sep 1–30, 2020 | 395 (LV) | – | 37% | 61% | - | - | 2% |
| University of Delaware | Sep 21–27, 2020 | 847 (LV) | – | 33% | 54% | 2% | 1% | 10%[lower-alpha 157] |
| SurveyMonkey/Axios | Aug 1–31, 2020 | 348 (LV) | – | 32% | 67% | - | - | 1% |
| PPP | Aug 21–22, 2020 | 710 (V) | ± 3.7% | 37% | 58% | - | - | 5% |
| SurveyMonkey/Axios | Jul 1–31, 2020 | 453 (LV) | – | 31% | 67% | - | - | 2% |
| SurveyMonkey/Axios | Jun 8–30, 2020 | 232 (LV) | – | 34% | 64% | - | - | 2% |
| Gonzales Research | Jan 16–21, 2020 | 410 (LV) | ± 5.0% | 40% | 56% | - | - | 4% |
District of Columbia
Graphical summary
Aggregate polls
| Source of poll aggregation |
Dates administered |
Dates updated |
Joe Biden Democratic |
Donald Trump Republican |
Other/ Undecided [lower-alpha 1] |
Margin |
|---|---|---|---|---|---|---|
| FiveThirtyEight | until October 27, 2020 | October 28, 2020 | 87.6% | 8.4% | 4.0% | Biden +79.2 |
Polls
| Poll source | Date(s) administered |
Sample size[lower-alpha 2] |
Margin of error |
Donald Trump Republican |
Joe Biden Democratic |
Jo Jorgensen Libertarian |
Howie Hawkins Green |
Other | Undecided |
|---|---|---|---|---|---|---|---|---|---|
| SurveyMonkey/Axios | Oct 20 – Nov 2, 2020 | 495 (LV) | ± 6% | 5%[lower-alpha 158] | 94% | - | - | – | – |
| SurveyMonkey/Axios | Oct 1–28, 2020 | 969 (LV) | – | 9% | 89% | - | - | – | – |
| SurveyMonkey/Axios | Sep 1–30, 2020 | 343 (LV) | – | 12% | 86% | - | - | – | 2% |
| SurveyMonkey/Axios | Aug 1–31, 2020 | 252 (LV) | – | 16% | 83% | - | - | – | 2% |
| SurveyMonkey/Axios | Jul 1–31, 2020 | 290 (LV) | – | 8% | 91% | - | - | – | 1% |
| SurveyMonkey/Axios | Jun 8–30, 2020 | 151 (LV) | – | 11% | 87% | - | - | – | 3% |
Florida
Graphical summary
Aggregate polls
| Source of poll aggregation |
Dates administered |
Dates updated |
Joe Biden Democratic |
Donald Trump Republican |
Other/ Undecided[lower-alpha 1] |
Margin |
|---|---|---|---|---|---|---|
| 270 to Win | October 24 – November 1, 2020 | November 3, 2020 | 48.7% | 46.0% | 5.3% | Biden +2.7 |
| Real Clear Politics | October 28 – November 2, 2020 | November 3, 2020 | 47.9% | 47.0% | 5.1% | Biden +0.9 |
| FiveThirtyEight | until November 2, 2020 | November 3, 2020 | 49.1% | 46.6% | 4.3% | Biden +2.5 |
| Average | 48.6% | 46.5% | 4.9% | Biden +2.1 | ||
State polls
| Poll source | Date(s) administered |
Sample size[lower-alpha 2] |
Margin of error |
Donald Trump Republican |
Joe Biden Democratic |
Jo Jorgensen Libertarian |
Howie Hawkins Green |
Other | Undecided |
|---|---|---|---|---|---|---|---|---|---|
| Insider Advantage/Fox 35 | Nov 1–2, 2020[lower-alpha 41] | 400 (LV) | ± 4.4% | 48% | 47% | 2% | - | – | 3% |
| Trafalgar Group | Oct 31 – Nov 2, 2020 | 1,054 (LV) | ± 2.94% | 49% | 47% | 2% | - | 1%[lower-alpha 159] | 1% |
| SurveyMonkey/Axios | Oct 20 – Nov 2, 2020 | 8,792 (LV) | ± 1.5% | 49%[lower-alpha 160] | 49% | - | - | – | – |
| AYTM/Aspiration | Oct 30 – Nov 1, 2020 | 517 (LV) | – | 43% | 45% | - | - | – | – |
| Change Research/CNBC | Oct 29 – Nov 1, 2020 | 806 (LV) | ± 3.45% | 48% | 51% | 0% | 0% | – | 1% |
| Susquehanna Polling & Research Inc./Center for American Greatness[upper-alpha 8] | Oct 29 – Nov 1, 2020 | 400 (LV) | ± 4.9% | 47% | 46% | 2% | - | 2%[lower-alpha 161] | 3% |
| Quinnipiac University | Oct 28 – Nov 1, 2020 | 1,657 (LV) | ± 2.4% | 42% | 47% | - | - | 1%[lower-alpha 162] | 9% |
| Swayable | Oct 27 – Nov 1, 2020 | 1,261 (LV) | ± 3.7% | 46% | 53% | 1% | 1% | – | – |
| Data for Progress | Oct 27 – Nov 1, 2020 | 1,202 (LV) | ± 2.8% | 48% | 51% | 1% | 1% | 0%[lower-alpha 163] | – |
| Ipsos/Reuters | Oct 27 – Nov 1, 2020 | 670 (LV) | ± 4.3% | 46%[lower-alpha 14] | 50% | 1% | 0% | 1%[lower-alpha 164] | – |
| 46%[lower-alpha 165] | 50% | - | - | 2%[lower-alpha 166] | 2% | ||||
| 47%[lower-alpha 167] | 51% | - | - | 2%[lower-alpha 168] | – | ||||
| Frederick Polls/Compete Everywhere[upper-alpha 18] | Oct 30–31, 2020 | 768 (LV) | ± 3.5% | 49% | 51% | - | - | – | – |
| Pulse Opinion Research/Rasmussen Reports | Oct 29–31, 2020 | 800 (LV) | ± 3.5% | 47% | 48% | - | - | 3%[lower-alpha 169] | – |
| Siena College/NYT Upshot | Oct 27–31, 2020 | 1,451 (LV) | ± 3.2% | 44% | 47% | 2% | 1% | 0%[lower-alpha 170] | 6%[lower-alpha 171] |
| Morning Consult | Oct 22–31, 2020 | 4,451 (LV) | ± 2% | 45% | 52% | - | - | – | – |
| St. Pete Polls | Oct 29–30, 2020 | 2,758 (LV) | ± 1.9% | 48% | 49% | 1% | - | – | 2% |
| RMG Research/PoliticalIQ | Oct 28–30, 2020 | 1,200 (LV) | ± 2.8% | 47%[lower-alpha 14] | 51% | - | - | 2%[lower-alpha 172] | 0% |
| 45%[lower-alpha 173] | 52% | - | - | 2%[lower-alpha 174] | 0% | ||||
| 48%[lower-alpha 175] | 49% | - | - | 2%[lower-alpha 176] | 0% | ||||
| Targoz Market Research/PollSmart | Oct 25–30, 2020 | 1,027 (LV) | – | 47% | 51% | - | - | 2%[lower-alpha 177] | – |
| AtlasIntel | Oct 28–29, 2020 | 786 (LV) | ± 3% | 48.5% | 48.5% | - | - | – | 3% |
| Public Policy Polling/Climate Power 2020[upper-alpha 19] | Oct 28–29, 2020 | 941 (V) | – | 45% | 52% | - | - | – | 3% |
| Harvard-Harris/The Hill | Oct 26–29, 2020 | 1,148 (LV) | ± >=3% | 47% | 50% | - | - | – | 3% |
| ABC/Washington Post | Oct 24–29, 2020 | 824 (LV) | ± 4% | 50% | 48% | 1% | 0% | 0%[lower-alpha 178] | 0% |
| Redfield & Wilton Strategies | Oct 27–28, 2020 | 1,587 (LV) | – | 46% | 50% | 1% | 0% | 0% | 3% |
| Trafalgar Group | Oct 25–28, 2020 | 1,088 (LV) | ± 2.89% | 50% | 47% | 2% | - | 1%[lower-alpha 179] | 1% |
| Monmouth University | Oct 24–28, 2020 | 509 (RV) | ± 4.7% | 45% | 50% | 1% | 0% | 1%[lower-alpha 180] | 2% |
| 509 (LV) | 45%[lower-alpha 181] | 51% | - | - | – | – | |||
| 46%[lower-alpha 182] | 50% | - | - | – | – | ||||
| SurveyMonkey/Axios | Oct 1–28, 2020 | 14,571 (LV) | – | 50% | 48% | - | - | – | – |
| Marist College/NBC | Oct 25–27, 2020 | 743 (LV) | ± 4.4% | 47% | 51% | - | - | 1% | 1% |
| Quinnipiac University | Oct 23–27, 2020 | 1,324 (LV) | ± 2.7% | 42% | 45% | - | - | 1%[lower-alpha 183] | 11% |
| Ipsos/Reuters | Oct 21–27, 2020 | 704 (LV) | ± 4.2% | 47%[lower-alpha 14] | 48% | 1% | 1% | 2%[lower-alpha 184] | – |
| 47%[lower-alpha 185] | 49% | - | - | 3%[lower-alpha 186] | 2% | ||||
| Swayable | Oct 23–26, 2020 | 605 (LV) | ± 5.4% | 51% | 46% | 2% | 1% | – | – |
| YouGov/Institute of Politics at Florida State University | Oct 16–26, 2020 | 1,200 (LV) | ± 3.2% | 46% | 48% | - | - | – | 6% |
| Wick Surveys | Oct 24–25, 2020 | 1,000 (LV) | ± 3.1% | 50% | 47% | - | - | – | – |
| Florida Atlantic University | Oct 24–25, 2020 | 937 (LV) | ± 3.1% | 48% | 50% | - | - | 2%[lower-alpha 187] | – |
| Susquehanna Polling & Research Inc./Center for American Greatness[upper-alpha 8] | Oct 23–25, 2020 | 400 (LV) | ± 4.9% | 49% | 44% | 2% | - | 3%[lower-alpha 188] | 3% |
| Univision/University of Houston/Latino Decisions/North Star Opinion Research |
Oct 17–25, 2020 | 743 (RV) | ± 3.56% | 46% | 49% | - | - | 2%[lower-alpha 189] | 3% |
| Ryan Tyson (R) | Released Oct 24, 2020 | – (V)[lower-alpha 190] | – | 47% | 45% | - | - | 3%[lower-alpha 191] | 4% |
| Gravis Marketing | Oct 24, 2020 | 665 (LV) | ± 3.8% | 48% | 47% | - | - | – | 5% |
| YouGov/CBS | Oct 20–23, 2020 | 1,228 (LV) | ± 3.6% | 48% | 50% | - | - | 2%[lower-alpha 192] | 0% |
| St. Pete Polls/Florida Politics | Oct 21–22, 2020 | 2,527 (LV) | ± 2% | 47% | 49% | - | - | 2%[lower-alpha 193] | 2% |
| RMG Research/PoliticalIQ | Oct 20–22, 2020 | 800 (LV) | ± 3.5% | 48%[lower-alpha 14] | 50% | - | - | 1%[lower-alpha 194] | 1% |
| 46%[lower-alpha 195] | 52% | - | - | 1%[lower-alpha 196] | 1% | ||||
| 48%[lower-alpha 197] | 46% | - | - | 1%[lower-alpha 198] | 1% | ||||
| Pulse Opinion Research/Rasmussen Reports | Oct 20–21, 2020 | 800 (LV) | ± 3.5% | 50% | 46% | - | - | 3%[lower-alpha 199] | 3% |
| Ipsos/Reuters | Oct 14–21, 2020 | 662 (LV) | ± 4.3% | 46%[lower-alpha 14] | 51% | 1% | 0% | 2%[lower-alpha 200] | – |
| 46%[lower-alpha 201] | 50% | - | - | 1%[lower-alpha 202] | 3% | ||||
| Citizen Data | Oct 17–20, 2020 | 1,000 (LV) | ± 3.1% | 45% | 50% | 1% | 0% | 1% | 4% |
| Civiqs/Daily Kos | Oct 17–20, 2020 | 863 (LV) | ± 3.5% | 47% | 51% | - | - | 1%[lower-alpha 203] | 1% |
| CNN/SSRS | Oct 15–20, 2020 | 847 (LV) | ± 4% | 46% | 50% | 1% | 1% | 0%[lower-alpha 204] | 1% |
| Morning Consult | Oct 11–20, 2020 | 4,685 (LV) | ± 1.4% | 45% | 52% | - | - | – | – |
| Change Research/CNBC | Oct 16–19, 2020 | 547 (LV)[lower-alpha 41] | – | 45% | 50% | - | - | – | – |
| University of North Florida | Oct 12–16, 2020 | 863 (LV) | ± 3.3% | 47% | 48% | - | - | 1%[lower-alpha 205] | 3% |
| HarrisX/The Hill | Oct 12–15, 2020 | 965 (LV) | – | 48% | 48% | - | - | – | 4% |
| Ipsos/Reuters | Oct 7–14, 2020 | 653 (LV) | ± 4.4% | 47%[lower-alpha 14] | 50% | 0% | 0% | 2%[lower-alpha 206] | – |
| 47%[lower-alpha 207] | 49% | - | - | 1%[lower-alpha 208] | 3% | ||||
| Trafalgar Group | Oct 11–13, 2020 | 1,051 (LV) | ± 2.94% | 48% | 46% | 2% | 1% | 1%[lower-alpha 209] | 2% |
| Redfield & Wilton Strategies | Oct 10–13, 2020 | 1,519 (LV) | – | 44%[lower-alpha 41] | 50% | 1% | 0% | – | – |
| St. Pete Polls/Florida Politics | Oct 11–12, 2020 | 2,215 (LV) | ± 2.1% | 47% | 49% | - | - | 1%[lower-alpha 210] | 2% |
| Emerson College | Oct 10–12, 2020 | 690 (LV) | ± 3.7% | 48%[lower-alpha 211] | 51% | - | - | 1%[lower-alpha 212] | – |
| Mason-Dixon | Oct 8–12, 2020 | 625 (LV) | ± 4% | 45% | 48% | - | - | 1%[lower-alpha 213] | 6% |
| Clearview Research | Oct 7–12, 2020 | 550 (LV) | ± 4.18% | 40%[lower-alpha 14] | 47% | - | - | 4%[lower-alpha 214] | 9% |
| 39%[lower-alpha 215] | 48% | - | - | 4%[lower-alpha 216] | 9% | ||||
| 41%[lower-alpha 217] | 46% | - | - | 4%[lower-alpha 218] | 9% | ||||
| Morning Consult | Oct 2–11, 2020 | 4,785 (LV) | ± 1.4% | 46% | 51% | - | - | – | – |
| Redfield & Wilton Strategies | Oct 9–10, 2020 | 750 (LV) | – | 42%[lower-alpha 41] | 53% | 1% | 0% | – | – |
| Florida Atlantic University | Oct 9–10, 2020 | 644 (LV) | ± 3.8% | 47% | 51% | - | - | 2%[lower-alpha 219] | – |
| RMG Research/PoliticalIQ | Oct 4–8, 2020 | 800 (LV) | – | 46%[lower-alpha 14] | 48% | 1% | 1% | 1% | 4% |
| 44%[lower-alpha 220] | 50% | 1% | 1% | 1% | 4% | ||||
| 47%[lower-alpha 221] | 46% | 1% | 1% | 1% | 4% | ||||
| Insider Advantage/Hannity Exclusive (R) | Oct 6–7, 2020 | 400 (LV) | ± 4.9% | 49% | 46% | 1% | - | – | 10% |
| YouGov/CCES | Sep 29 – Oct 7, 2020 | 3,755 (LV) | – | 47% | 49% | - | - | – | – |
| Ipsos/Reuters | Sep 29 – Oct 7, 2020 | 678 (LV) | ± 4.3% | 45% | 49% | - | - | 1%[lower-alpha 222] | 5% |
| Redfield & Wilton Strategies | Oct 4–6, 2020 | 998 (LV) | ± 3.1% | 44% | 49% | 1% | 0% | 1%[lower-alpha 223] | 6% |
| Quinnipiac University | Oct 1–5, 2020 | 1,256 (LV) | ± 2.8% | 40% | 51% | - | - | 1%[lower-alpha 224] | 7% |
| Change Research/CNBC | Oct 2–4, 2020 | 560 (LV) | – | 46% | 50% | - | - | – | – |
| Suffolk University/USA Today | Oct 1–4, 2020 | 500 (LV) | ± 4.4% | 45%[lower-alpha 14] | 45% | 2% | 0%[lower-alpha 225] | 2%[lower-alpha 226] | 6% |
| 46%[lower-alpha 227] | 45% | - | - | 2%[lower-alpha 228] | 7% | ||||
| University of North Florida | Oct 1–4, 2020 | 3,134 (LV) | ± 1.8% | 45% | 51% | - | - | 1%[lower-alpha 229] | 3%[lower-alpha 230] |
| St. Leo University | Sep 27 – Oct 2, 2020 | 489 (LV) | – | 44% | 50% | - | - | – | 5% |
| Siena College/NYT Upshot | Sep 30 – Oct 1, 2020 | 710 (LV) | ± 4.2% | 42% | 47% | 2% | 1% | 0%[lower-alpha 231] | 8%[lower-alpha 232] |
| SurveyMonkey/Axios | Sep 1–30, 2020 | 12,962 (LV) | – | 47% | 51% | - | - | – | 2% |
| Cherry Communications/Florida Chamber of Commerce | Sep 23–29, 2020 | 600 (LV) | ± 4% | 44%[lower-alpha 41] | 49% | - | - | – | – |
| Susquehanna Polling & Research Inc./Center for American Greatness[upper-alpha 8] | Sep 23–26, 2020 | 500 (LV) | ± 4.3% | 43% | 46% | 3% | - | – | 8%[lower-alpha 233] |
| Redfield & Wilton Strategies | Sep 23–25, 2020 | 1,073 (LV) | ± 2.99% | 43% | 48% | 1% | 1% | 1%[lower-alpha 234] | 7% |
| St. Pete Polls | Sep 21–22, 2020 | 2,906 (LV) | ± 1.8% | 47% | 50% | - | - | 2%[lower-alpha 235] | 2% |
| Data For Progress[upper-alpha 20] | Sep 15–22, 2020 | 620 (LV) | ± 3.9% | 43% | 46% | - | - | – | 11% |
| Change Research/CNBC | Sep 18–20, 2020 | 702 (LV) | – | 46% | 49% | - | - | – | – |
| ABC/Washington Post | Sep 15–20, 2020 | 613 (LV) | ± 4.5% | 51% | 47% | - | - | 1%[lower-alpha 236] | 1% |
| Hart Research Associates/Human Rights Campaign[upper-alpha 21] | Sep 17–19, 2020 | 400 (LV) | ± 4.9% | 45% | 51% | - | - | – | – |
| YouGov/CBS | Sep 15–18, 2020 | 1,205 (LV) | ± 3.7% | 46% | 48% | - | - | 1%[lower-alpha 237] | 5% |
| Ipsos/Reuters | Sep 11–17, 2020 | 586 (LV) | ± 4.6% | 47% | 47% | - | - | 2%[lower-alpha 238] | 4% |
| Redfield & Wilton Strategies | Sep 12–14, 2020 | 1,158 (LV) | ± 2.88% | 44% | 47% | 1% | 1% | 1%[lower-alpha 239] | 6% |
| Monmouth University | Sep 10–13, 2020 | 428 (RV) | ± 4.7% | 45% | 50% | 2% | 0% | 1%[lower-alpha 240] | 3% |
| 428 (LV) | 45%[lower-alpha 241] | 50% | - | - | 1%[lower-alpha 242] | 3% | |||
| 46%[lower-alpha 243] | 49% | - | - | 1%[lower-alpha 244] | 3% | ||||
| Kaiser Family Foundation/Cook Political Report | Aug 29 – Sep 13, 2020 | 1,009 (RV) | ± 4.0% | 42% | 43% | - | - | 4%[lower-alpha 245] | 11% |
| Florida Atlantic University | Sep 11–12, 2020 | 631 (LV) | ± 3.8% | 50% | 50% | - | - | 0%[lower-alpha 246] | – |
| St. Pete Polls/Florida Politics/AARP | Sep 7–8, 2020 | 2,689 (LV) | ± 1.9% | 47% | 50% | - | - | 2%[lower-alpha 247] | 2% |
| Benenson Strategy Group/GS Strategy Group/AARP | Aug 30 – Sep 8, 2020 | 1,600 (LV) | ± 2.5% | 46% | 48% | - | - | 2%[lower-alpha 248] | 4% |
| Morning Consult | Aug 29 – Sep 7, 2020 | 3,914 (LV) | ± (2%-4%) | 43%[lower-alpha 249] | 50% | - | - | – | – |
| Change Research/CNBC | Sep 4–6, 2020 | 1,144 (LV) | – | 46% | 49% | - | - | 4%[lower-alpha 250] | – |
| Marist College/NBC | Aug 31 – Sep 5, 2020 | 760 (LV) | ± 4.5% | 48% | 48% | - | - | 1% | 2% |
| Trafalgar Group | Sep 1–3, 2020 | 1,022 (LV) | ± 3.0% | 49% | 46% | 2% | - | 1%[lower-alpha 251] | 2% |
| Redfield & Wilton Strategies | Aug 30 – Sep 3, 2020 | 1,093 (LV) | ± 2.96% | 43% | 48% | 1% | 1% | 1%[lower-alpha 252] | 6% |
| GQR Research (D) | Aug 26 – Sep 3, 2020 | 800 (LV) | ± 3.5% | 46% | 51% | - | - | – | – |
| Quinnipiac | Aug 28 – Sep 1, 2020 | 1,235 (LV) | ± 2.8% | 45% | 48% | - | - | 1%[lower-alpha 253] | 5% |
| SurveyMonkey/Axios | Aug 1–31, 2020 | 12,286 (LV) | – | 50% | 48% | - | - | – | 2% |
| Morning Consult | Aug 21–30, 2020 | 3,790 (LV) | ± (2%–4%) | 47% | 49% | - | - | – | – |
| Opinium/The Guardian | Aug 21–26, 2020 | 684 (LV) | – | 43% | 50% | - | - | 1% | 6% |
| Change Research/CNBC | Aug 21–23, 2020 | 1,262 (LV) | – | 46% | 49% | - | - | – | – |
| PPP | Aug 21–22, 2020 | 671 (V) | ± 3.8% | 44% | 48% | - | - | – | 7% |
| Redfield and Wilton Strategies | Aug 16, 2020 | 1,280 (LV) | – | 41% | 49% | 1% | - | 1%[lower-alpha 254] | 7% |
| Morning Consult | Aug 7–16, 2020 | 3,484 (LV) | ± (2%–4%) | 45% | 50% | - | - | – | – |
| Tyson Group/Consumer Energy Alliance[upper-alpha 22] | Aug 11–15, 2020 | 750 (LV) | ± 4% | 44% | 46% | 2% | - | 1%[lower-alpha 255] | 6% |
| Change Research/CNBC | Aug 7–9, 2020 | 469 (LV) | – | 44% | 50% | - | - | – | – |
| OnMessage Inc./Heritage Action[upper-alpha 23] | Aug 2–4, 2020 | 400 (LV) | – | 49% | 49% | - | - | – | 2% |
| SurveyMonkey/Axios | Jul 1–31, 2020 | 13,945 (LV) | – | 48% | 49% | - | - | – | 2% |
| Change Research/CNBC | Jul 24–26, 2020 | 685 (LV) | – | 45% | 48% | - | - | – | – |
| Morning Consult | Jul 17–26, 2020 | 3,760 (LV) | ± 1.6% | 46%[lower-alpha 256] | 49% | - | - | – | – |
| Morning Consult | Jul 16–25, 2020 | – (LV)[lower-alpha 257] | – | 45% | 49% | - | - | – | – |
| CNN/SSRS | Jul 18–24, 2020 | 880 (RV) | ± 3.8% | 46% | 51% | - | - | 2%[lower-alpha 258] | 2% |
| Zogby Analytics | Jul 21–23, 2020 | 811 (RV) | ± 3.4% | 43% | 43% | 3% | 2% | – | 9% |
| Mason-Dixon | Jul 20–23, 2020 | 625 (LV) | ± 4.0% | 46% | 50% | - | - | – | 4% |
| Redfield & Wilton Strategies | Jul 19–21, 2020 | 1,121 (LV) | – | 41% | 48% | 1% | 1% | 1%[lower-alpha 259] | 8% |
| Quinnipiac University | Jul 16–20, 2020 | 924 (RV) | ± 4.3% | 38% | 51% | - | - | 6%[lower-alpha 260] | 5% |
| Morning Consult | Jul 6–15, 2020 | – (LV)[lower-alpha 261] | – | 45% | 50% | - | - | – | – |
| Florida Politics/AARP Florida/St. Pete Polls | Jul 13–14, 2020 | 3,018 (RV) | ± 1.8% | 44% | 50% | - | - | 2%[lower-alpha 262] | 3% |
| Gravis Marketing | Jul 13, 2020 | 513 (LV) | ± 4.3% | 43% | 53% | - | - | – | 4% |
| Change Research/CNBC | Jul 10–12, 2020 | 1,128 (LV) | – | 43% | 50% | - | - | – | – |
| YouGov/CBS | Jul 7–10, 2020 | 1,206 (LV) | ± 3.6% | 42% | 48% | - | - | 2%[lower-alpha 263] | 8% |
| Morning Consult | Jun 26 – Jul 5, 2020 | – (LV)[lower-alpha 264] | – | 46% | 49% | - | - | – | – |
| Trafalgar Group | Jun 29 – Jul 2, 2020 | 1,072 (LV) | ± 2.91% | 46% | 46% | - | - | 5%[lower-alpha 265] | 3% |
| SurveyMonkey/Axios | Jun 8–30, 2020 | 5,663 (LV) | – | 51% | 47% | - | - | – | 2% |
| Change Research/CNBC | Jun 26–28, 2020 | 951 (LV)[lower-alpha 41] | – | 45% | 50% | - | - | – | – |
| Morning Consult | Jun 16–25, 2020 | – (LV)[lower-alpha 266] | – | 45% | 49% | - | - | – | – |
| Fox News | Jun 20–23, 2020 | 1,010 (RV) | ± 3% | 40% | 49% | - | - | 6%[lower-alpha 267] | 6% |
| Siena College/NYT Upshot | Jun 8–18, 2020 | 651 (RV) | ± 4.6% | 41% | 47% | - | - | 4%[lower-alpha 268] | 7% |
| Redfield & Wilton Strategies | Jun 14–15, 2020 | 1,079 (LV) | ± 2.98% | 41% | 45% | 1% | 1% | 1%[lower-alpha 269] | 11% |
| Morning Consult | Jun 6–15, 2020 | – (LV)[lower-alpha 270] | – | 45% | 50% | - | - | – | – |
| Change Research/CNBC | Jun 12–14, 2020 | 713 (LV)[lower-alpha 41] | – | 43% | 50% | - | - | 3%[lower-alpha 271] | – |
| Gravis Marketing/OANN | Released Jun 11, 2020 | – (V)[lower-alpha 272] | – | 50% | 50% | - | - | – | – |
| TIPP/American Greatness PAC[upper-alpha 8] | Jun 9–11, 2020 | 875 (LV) | – | 40% | 51% | - | - | 4%[lower-alpha 273] | 5% |
| Morning Consult | May 27 – Jun 5, 2020 | – (LV)[lower-alpha 274] | – | 48% | 47% | - | - | – | – |
| Change Research/CNBC | May 29–31, 2020 | 1,186 (LV)[lower-alpha 41] | – | 45% | 48% | - | - | 2% | 4% |
| Cygnal (R) | May 18–30, 2020 | 881 (LV) | ± 3.3% | 43.8% | 47% | - | - | 3.3%[lower-alpha 275] | 5.9% |
| St. Pete Polls | May 26–27, 2020 | 4,763 (RV) | ± 1.4% | 46.7% | 47.5% | - | - | 2.7%[lower-alpha 276] | 3.1% |
| Morning Consult | May 17–26, 2020 | 3,593 (LV) | – | 48%[lower-alpha 277] | 47% | - | - | – | – |
| Morning Consult | May 16–25, 2020 | – (LV)[lower-alpha 278] | – | 48% | 47% | - | - | – | – |
| Point Blank Political | May 14–17, 2020 | 2,149 (LV) | ± 3.5% | 44% | 45% | 1%[lower-alpha 279] | <1%[lower-alpha 280] | 2% | 8% |
| Point Blank Political | May 14–17, 2020 | 2,149 (LV) | ± 3.5% | 48% | 52% | - | - | – | – |
| Morning Consult | May 6–15, 2020 | – (LV)[lower-alpha 281] | – | 50% | 45% | - | - | – | – |
| Redfield & Wilton Strategies | May 10–14, 2020 | 1,014 (LV) | ± 3.1% | 43% | 45% | - | - | 3%[lower-alpha 282] | 10% |
| Florida Atlantic University | May 8–12, 2020 | 928 (RV) | ± 3.1% | 47% | 53% | - | - | – | – |
| Fox News | Apr 18–21, 2020 | 1,004 (RV) | ± 3.0% | 43% | 46% | - | - | 3% | 7% |
| Quinnipiac University | Apr 16–20, 2020 | 1,385 (RV) | ± 2.6% | 42% | 46% | - | - | 3% | 7% |
| St. Pete Polls | Apr 16–17, 2020 | 5,659 (RV) | ± 1.3% | 48% | 48% | - | - | – | 4% |
| University of North Florida | Mar 31 – Apr 4, 2020 | 3,244 (RV) | ± 1.7% | 40% | 46% | - | - | – | 8% |
| AtlasIntel | Mar 14–16, 2020 | 1,100 (RV) | ± 3.0% | 45% | 45% | - | - | 10% | – |
| Univision | Mar 6–12, 2020 | 1,071 (RV) | ± 3.0% | 48% | 45% | - | - | – | 7% |
| Florida Atlantic University | Mar 5–7, 2020 | 1,216 (RV) | ± 2.7% | 51% | 49% | - | - | – | – |
| University of North Florida | Feb, 2020 | 696 (LV) | – | 45% | 45% | - | - | – | 10%[lower-alpha 283] |
| Saint Leo University | Feb 17–22, 2020 | 900 (LV) | ± 3.5% | 40% | 51% | - | - | – | 8% |
| University of North Florida | Feb 10–18, 2020 | 668 (RV) | – | 48% | 49% | - | - | – | 3% |
| Florida Atlantic University | Jan 9–12, 2020 | 1,285 (RV) | ± 2.6% | 49% | 51% | - | - | – | – |
| Cherry Communications/Florida Chamber of Commerce[upper-alpha 24] | Jan 3–12, 2020 | 608 (LV) | ± 4% | 49% | 45% | - | - | – | – |
| Mason-Dixon | Dec 11–16, 2019 | 625 (RV) | ± 4.0% | 45% | 47% | - | - | – | 8% |
| Siena College/NYT Upshot | Oct 13–26, 2019 | 650 (LV) | ± 4.4% | 44% | 46% | - | - | – | – |
| University of North Florida | Oct 14–20, 2019 | 643 (RV) | ± 3.8% | 43% | 48% | - | - | 6%[lower-alpha 284] | 3% |
| Florida Atlantic University | Sep 12–15, 2019 | 934 (RV) | ± 3.1% | 50.5% | 49.5% | - | - | – | – |
| Quinnipiac University | Jun 12–17, 2019 | 1,279 (RV) | ± 3.3% | 41% | 50% | - | - | 1% | 6% |
| St. Pete Polls | Jun 15–16, 2019 | 3,095 (LV) | ± 1.8% | 47% | 47% | - | - | – | 6% |
| Florida Atlantic University | May 16–19, 2019 | 1,007 (RV) | ± 3.0% | 50% | 50% | - | - | – | – |
| WPA Intelligence | Apr 27–30, 2019 | 200 (LV) | ± 6.9% | 48% | 44% | - | - | – | 7% |
Georgia
- Graphical summary
- Aggregate polls
| Source of poll aggregation |
Dates administered |
Dates updated |
Joe Biden Democratic |
Donald Trump Republican |
Other/ Undecided [lower-alpha 1] |
Margin |
|---|---|---|---|---|---|---|
| 270 to Win | Oct 22 – Nov 1, 2020 | November 2, 2020 | 47.6% | 47.4% | 5.0% | Biden +0.2 |
| Real Clear Politics | Oct 23 – Nov 1, 2020 | November 2, 2020 | 47.2% | 48.2% | 4.6% | Trump +1.0 |
| FiveThirtyEight | until November 1, 2020 | November 2, 2020 | 48.5% | 47.4% | 4.1% | Biden +1.1 |
| Average | 47.8% | 47.7% | 4.6% | Biden +0.1 | ||
Polls
| Poll source | Date(s) administered |
Sample size[lower-alpha 2] |
Margin of error |
Donald Trump Republican |
Joe Biden Democratic |
Jo Jorgensen Libertarian |
Other | Undecided |
|---|---|---|---|---|---|---|---|---|
| Trafalgar Group | Oct 31 – Nov 2, 2020 | 1,041 (LV) | ± 2.96% | 50% | 45% | 3% | 1%[lower-alpha 285] | 1% |
| SurveyMonkey/Axios | Oct 20 – Nov 2, 2020 | 3,962 (LV) | ± 2.5% | 48%[lower-alpha 286] | 50% | – | – | – |
| Landmark Communications/WSBTV | Nov 1, 2020 | 500 (LV) | ± 4.4% | 50% | 46% | 3% | – | 1% |
| Insider Advantage/Center for American Greatness[upper-alpha 8] | Nov 1, 2020 | 500 (LV) | ± 4.4% | 48% | 46% | 4% | – | 2% |
| AYTM/Aspiration | Oct 30 – Nov 1, 2020 | 380 (LV) | – | 48% | 52% | – | – | – |
| Swayable | Oct 27 – Nov 1, 2020 | 438 (LV) | ± 6.2% | 44% | 54% | 2% | – | – |
| Data for Progress | Oct 27 – Nov 1, 2020 | 1,036 (LV) | ± 3% | 48% | 50% | 1% | 0%[lower-alpha 287] | – |
| AtlasIntel | Oct 30–31, 2020 | 679 (LV) | ± 4% | 48% | 46% | – | 6% | – |
| Emerson College | Oct 29–31, 2020 | 749 (LV) | ± 3.5% | 49%[lower-alpha 288] | 48% | – | 2%[lower-alpha 289] | – |
| Morning Consult | Oct 22–31, 2020 | 1,743 (LV) | ± 2.0% | 46% | 49% | – | – | – |
| Landmark Communications/WSBTV | Oct 28, 2020 | 750 (LV) | ± 3.6% | 48% | 47% | 3% | – | 3% |
| Public Policy Polling | Oct 27–28, 2020 | 661 (V) | – | 46% | 48% | – | 4%[lower-alpha 290] | 2% |
| SurveyMonkey/Axios | Oct 1–28, 2020 | 7,019 (LV) | – | 48% | 50% | – | – | – |
| Monmouth University | Oct 23–27, 2020 | 504 (RV) | ± 4.4% | 45% | 50% | 2% | 1%[lower-alpha 291] | 2% |
| 504 (LV) | 46%[lower-alpha 292] | 50% | – | – | – | |||
| 48%[lower-alpha 293] | 50% | – | – | – | ||||
| Swayable | Oct 23–26, 2020 | 373 (LV) | ± 6.9% | 48% | 51% | 1% | – | – |
| Civiqs/Daily Kos | Oct 23–26, 2020 | 1,041 (LV) | ± 3.3% | 46% | 51% | – | 2%[lower-alpha 294] | 0% |
| Wick Surveys | Oct 24–25, 2020 | 1,000 (LV) | ± 3.1% | 49% | 47% | – | – | – |
| YouGov/CBS | Oct 20–23, 2020 | 1,090 (LV) | ± 3.4% | 49% | 49% | – | 2%[lower-alpha 295] | 0% |
| University of Georgia/AJC | Oct 14–23, 2020 | 1,145 (LV) | ± 4% | 46% | 47% | 3% | – | 4% |
| Landmark Communications/WSBTV | Oct 21, 2020 | 500 (LV) | ± 4.4% | 49% | 45% | – | – | 4% |
| Citizen Data | Oct 17–20, 2020 | 1,000 (LV) | ± 3% | 44% | 48% | 1% | 2%[lower-alpha 296] | 5% |
| Morning Consult | Oct 11–20, 2020 | 1,672 (LV) | ± 2.4% | 48% | 48% | – | – | – |
| Emerson College | Oct 17–19, 2020 | 506 (LV) | ± 4.3% | 48%[lower-alpha 297] | 47% | – | 5%[lower-alpha 298] | – |
| Siena College/NYT Upshot | Oct 13–19, 2020 | 759 (LV) | ± 4.1% | 45% | 45% | 2% | 2%[lower-alpha 299] | 7%[lower-alpha 300] |
| Opinion Insight/American Action Forum[upper-alpha 10] | Oct 12–15, 2020 | 801 (LV) | ± 3.46% | 46%[lower-alpha 301] | 49% | – | 3%[lower-alpha 302] | 4%[lower-alpha 303] |
| Garin-Hart-Yang/Jon Ossoff[upper-alpha 25] | Oct 11–14, 2020 | 600 (LV) | – | 44% | 51% | – | – | – |
| Quinnipiac University | Oct 8–12, 2020 | 1,040 (LV) | ± 3.0% | 44% | 51% | – | 1%[lower-alpha 304] | 4% |
| SurveyUSA | Oct 8–12, 2020 | 677 (LV) | ± 5.7% | 46% | 48% | – | 2%[lower-alpha 305] | 4% |
| Data for Progress | Oct 8–11, 2020 | 782 (LV) | ± 3.5% | 46% | 46% | 2% | 1%[lower-alpha 306] | 5% |
| Morning Consult | Oct 2–11, 2020 | 1,837 (LV) | ± 2.3% | 49% | 47% | – | – | – |
| Public Policy Polling | Oct 8–9, 2020 | 528 (V) | ± 4.3% | 46% | 47% | – | 3%[lower-alpha 307] | 3% |
| Landmark Communications | Oct 7, 2020 | 600 (LV) | ± 4.0% | 48.6% | 46.8% | 0.7% | – | 3.9% |
| YouGov/CCES | Sep 29 – Oct 7, 2020 | 1,456 (LV) | – | 47% | 48% | – | – | – |
| University of Georgia/AJC | Sep 27 – Oct 6, 2020 | 1,106 (LV) | ± 2.9% | 47% | 46% | 3% | – | 3% |
| Landmark Communications/WSB | Sep 30, 2020 | 500 (LV) | ± 4% | 45% | 47% | 3% | – | – |
| SurveyMonkey/Tableau | Sep 1–30, 2020 | 3,468 (LV) | – | 48% | 49% | – | – | 2% |
| Civiqs/Daily Kos | Sep 26–29, 2020 | 969 (LV) | ± 3.5% | 47% | 50% | – | 2%[lower-alpha 308] | 1% |
| Hart Research Associates/Human Rights Campaign[upper-alpha 26] | Sep 24–27, 2020 | 400 (LV) | ± 4.9% | 47% | 50% | – | – | – |
| Quinnipiac University | Sep 23–27, 2020 | 1,125 (LV) | ± 2.9% | 47% | 50% | – | 1%[lower-alpha 309] | 2% |
| Redfield & Wilton Strategies | Sep 23–26, 2020 | 789 (LV) | ± 3.49% | 44% | 45% | 2% | 1%[lower-alpha 310] | 8% |
| YouGov/CBS | Sep 22–25, 2020 | 1,164 (LV) | ± 3.4% | 47% | 46% | – | 2%[lower-alpha 311] | 5% |
| Monmouth University | Sep 17–21, 2020 | 402 (RV) | ± 4.9% | 47% | 46% | 2% | 0%[lower-alpha 312] | 4% |
| 402 (LV) | 48%[lower-alpha 313] | 46% | 2% | – | 4% | |||
| 50%[lower-alpha 314] | 45% | 1% | – | 3% | ||||
| Siena College/NYT Upshot | Sep 16–21, 2020 | 523 (LV) | ± 4.9% | 45% | 45% | 2% | 0%[lower-alpha 315] | 8%[lower-alpha 316] |
| University of Georgia/AJC | Sep 11–20, 2020 | 1,150 (LV) | ± 4% | 47% | 47% | 1% | – | 4% |
| Data for Progress (D) | Sep 14–19, 2020 | 800 (LV) | ± 3.5% | 45%[lower-alpha 317] | 45% | 1% | 0%[lower-alpha 318] | 8% |
| 46%[lower-alpha 319] | 46% | – | – | 8% | ||||
| GBAO Strategies/Warnock for Georgia[upper-alpha 27] | Sep 14–16, 2020 | 600 (LV) | ± 4% | 46% | 49% | – | – | – |
| Redfield & Wilton Strategies | Sep 12–16, 2020 | 800 (LV) | ± 3.46% | 46% | 45% | 2% | 1%[lower-alpha 320] | 6% |
| Morning Consult | Aug 29 – Sep 7, 2020 | 1,486 (LV) | ± (2%–4%) | 48%[lower-alpha 321] | 46% | – | – | – |
| Fabrizio Ward/Hart Research Associates/AARP | Aug 30 – Sep 5, 2020 | 800 (LV) | ± 3.5% | 46% | 47% | – | 1%[lower-alpha 322] | 6% |
| Opinion Insight/American Action Forum[upper-alpha 10] | Aug 30 – Sep 2, 2020 | 800 (LV) | ± 3.46% | 46%[lower-alpha 323] | 47% | 2% | 1%[lower-alpha 324] | 4% |
| Landmark Communications/WSB | Aug 29–31, 2020 | 500 (LV) | ± 4.4% | 48% | 41% | 2% | – | 9% |
| SurveyMonkey/Tableau | Aug 1–31, 2020 | 2,772 (LV) | – | 49% | 49% | – | – | 2% |
| Morning Consult | Aug 21–30, 2020 | 1,392 (LV) | ± (2%–4%) | 46% | 49% | – | – | – |
| HarrisX/Matt Lieberman[upper-alpha 28] | Aug 20–30, 2020 | 1,616 (RV) | ± 2.4% | 46% | 52% | – | 2%[lower-alpha 325] | – |
| PPP/Fair Fight Action[upper-alpha 29] | Aug 24–25, 2020 | 782 (V) | ± 3.5% | 46% | 47% | – | – | 6% |
| Morning Consult | Aug 7–16, 2020 | 1,265 (LV) | ± (2%–4%) | 47% | 46% | – | – | – |
| Landmark Communications | Aug 14–15, 2020 | 500 (LV) | ± 4.4% | 48% | 45% | 4% | – | 3% |
| SurveyUSA | Aug 6–8, 2020 | 623 (LV) | ± 5.3% | 44% | 46% | – | 4%[lower-alpha 326] | 6% |
| YouGov/CBS | Jul 28–31, 2020 | 1,109 (LV) | ± 3.4% | 45% | 46% | – | 3%[lower-alpha 327] | 5% |
| HIT Strategies/DFER[upper-alpha 30] | Jul 23–31, 2020 | 400 (RV) | ± 4.9% | 40% | 44% | – | 6%[lower-alpha 328] | 10%[lower-alpha 329] |
| SurveyMonkey/Tableau | Jul 1–31, 2020 | 3,745 (LV) | – | 53% | 45% | – | – | 2% |
| Monmouth University | Jul 23–27, 2020 | 402 (RV) | ± 2% | 47% | 47% | 3% | – | 3% |
| 402 (LV) | 48%[lower-alpha 330] | 47% | 2% | – | 3% | |||
| 49%[lower-alpha 331] | 46% | 2% | – | 4% | ||||
| Morning Consult | Jul 17–26, 2020 | 1,337 (LV) | ± 2.7% | 46% | 47% | – | – | – |
| Public Policy Polling/AFSCME[upper-alpha 6] | Jul 23–24, 2020 | 722 (V) | – | 45% | 46% | – | – | 9% |
| Trafalgar Group | Jul 15–18, 2020 | 1,023 (LV) | ± 3.0% | 50% | 43% | 2% | 2%[lower-alpha 332] | 2% |
| Spry Strategies/American Principles Project[upper-alpha 31] | Jul 11–16, 2020 | 700 (LV) | ± 3.7% | 49% | 46% | – | – | 5% |
| Garin-Hart-Yang/Jon Ossoff[upper-alpha 32] | Jul 9–15, 2020 | 800 (LV) | ± 3.5% | 43% | 47% | – | – | 10% |
| Gravis Marketing/OANN | Jul 2, 2020 | 513 (LV) | ± 4.3% | 48% | 45% | - | – | 8% |
| SurveyMonkey/Tableau | Jun 8–30, 2020 | 2,059 (LV) | – | 49% | 49% | – | – | 2% |
| Public Policy Polling/End Citizens United[upper-alpha 33] | Jun 25–26, 2020 | 734 (RV) | ± 3.6% | 45% | 49% | - | – | 6% |
| Fox News | Jun 20–23, 2020 | 1,013 (RV) | ± 3.0% | 45% | 47% | - | 4%[lower-alpha 333] | 5% |
| Public Policy Polling | Jun 12–13, 2020 | 661 (V) | ± 3.4% | 46% | 48% | - | – | 6% |
| TargetSmart | May 21–27, 2020 | 321 (RV) | ± 5.5% | 44% | 40% | - | 10%[lower-alpha 334] | 6% |
| Morning Consult | May 17–26, 2020 | 1,396 (LV) | – | 49% | 47% | – | – | – |
| Civiqs/Daily Kos | May 16–18, 2020 | 1,339 (RV) | ± 3.1% | 47% | 48% | - | 3%[lower-alpha 335] | 2% |
| The Progress Campaign (D) | May 6–15, 2020 | 2,893 (LV) | ± 2% | 47% | 47% | - | – | 6%[lower-alpha 336] |
| BK Strategies/Republican State Leadership Committee[upper-alpha 34] | May 11–13, 2020 | 700 (LV) | ± 3.7% | 48% | 46% | - | – | – |
| Public Opinion Strategies (R) | May 4–7, 2020 | 500 (LV) | ± 4.38% | 46% | 47% | - | – | 7%[lower-alpha 337] |
| Cygnal/David Ralston[upper-alpha 35] | Apr 25–27, 2020 | 591 (LV) | ± 4.0% | 45% | 44% | - | 7% | 5% |
| Battleground Connect/Doug Collins for Senate[upper-alpha 36] | Mar 31 – Apr 1, 2020 | 1,035 (LV) | ± 3.0% | 48% | 46% | - | – | 6% |
| The Progress Campaign (D) | Mar 12–21, 2020 | 3,042 (RV) | ± 4.5% | 49% | 47% | - | 4% | – |
| University of Georgia | Feb 24 – Mar 2, 2020 | 1,117 (LV) | ± 2.9% | 51% | 43% | - | 4% | 2% |
| Mason-Dixon | Dec 19–23, 2019 | 625 (RV) | ± 4.0% | 51% | 44% | - | – | 5% |
| SurveyUSA | Nov 15–18, 2019 | 1,303 (LV) | ± 3.2% | 43% | 47% | - | – | 10% |
| Climate Nexus | Nov 4–10, 2019 | 688 (LV) | – | 47% | 48% | - | – | 5% |
| University of Georgia | Oct 30 – Nov 8, 2019 | 1,028 (RV) | ± 3% | 43% | 51% | - | 3% | 4%[lower-alpha 338] |
| Zogby Analytics | Oct 28–30, 2019 | 550 (LV) | ± 4.2% | 44% | 46% | - | – | 11% |
Hawaii
Graphical summary
Aggregate polls
| Source of poll aggregation |
Dates administered |
Dates updated |
Joe Biden Democratic |
Donald Trump Republican |
Other/ Undecided [lower-alpha 1] |
Margin |
|---|---|---|---|---|---|---|
| FiveThirtyEight | until October 31, 2020 | November 2, 2020 | 64.1% | 30.6% | 5.3% | Biden +33.5 |
Polls
| Poll source | Date(s) administered |
Sample size[lower-alpha 2] |
Margin of error |
Donald Trump Republican |
Joe Biden Democratic |
Jo Jorgensen Libertarian |
Howie Hawkins Green |
Other | Undecided |
|---|---|---|---|---|---|---|---|---|---|
| SurveyMonkey/Axios | Oct 20 – Nov 2, 2020 | 688 (LV) | ± 5% | 31%[lower-alpha 339] | 67% | - | - | – | – |
| SurveyMonkey/Axios | Oct 1–28, 2020 | 1,263 (LV) | – | 34% | 63% | - | - | – | – |
| Mason-Dixon | Oct 12–14, 2020 | 625 (LV) | ± 4% | 29% | 58% | - | - | 5% | 8% |
| MRG Research/Civil Beat/HNN | Oct 2–7, 2020 | 988 (RV) | ± 3.1% | 28% | 61% | - | - | 4%[lower-alpha 340] | 7% |
| SurveyMonkey/Axios | Sep 1–30, 2020 | 474 (LV) | – | 33% | 66% | - | - | – | 1% |
| SurveyMonkey/Axios | Aug 1–31, 2020 | 362 (LV) | – | 37% | 61% | - | - | – | 2% |
| SurveyMonkey/Axios | Jul 1–31, 2020 | 356 (LV) | – | 37% | 62% | - | - | – | 2% |
| MRG Research | Jul 27–30, 2020 | 975 (RV) | ± 3.1% | 29% | 56% | - | - | 6%[lower-alpha 341] | 10% |
| SurveyMonkey/Axios | Jun 8–30, 2020 | 207 (LV) | – | 30% | 67% | - | - | – | 3% |
Idaho
Graphical summary
Aggregate polls
| Source of poll aggregation |
Dates administered |
Dates updated |
Joe Biden Democratic |
Donald Trump Republican |
Other/ Undecided [lower-alpha 1] |
Margin |
|---|---|---|---|---|---|---|
| FiveThirtyEight | until October 25, 2020 | October 27, 2020 | 37.8% | 57.4% | 4.8% | Trump +19.6 |
Polls
| Poll source | Date(s) administered |
Sample size[lower-alpha 2] |
Margin of error |
Donald Trump Republican |
Joe Biden Democratic |
Jo Jorgensen Libertarian |
Other | Undecided |
|---|---|---|---|---|---|---|---|---|
| SurveyMonkey/Axios | Oct 20 – Nov 2, 2020 | 909 (LV) | ± 4.5% | 58%[lower-alpha 342] | 40% | - | – | – |
| SurveyMonkey/Axios | Oct 1–28, 2020 | 1,799 (LV) | – | 58% | 40% | - | – | – |
| SurveyMonkey/Axios | Sep 1–30, 2020 | 761 (LV) | – | 64% | 35% | - | – | 1% |
| Spry Strategies/Women's Liberation Front | Aug 29 – Sep 1, 2020 | 600 (LV) | ± 4% | 60% | 34% | - | – | 6% |
| SurveyMonkey/Axios | Aug 1–31, 2020 | 737 (LV) | – | 58% | 40% | - | – | 2% |
| SurveyMonkey/Axios | Jul 1–31, 2020 | 671 (LV) | – | 63% | 35% | - | – | 2% |
| SurveyMonkey/Axios | Jun 8–30, 2020 | 266 (LV) | – | 58% | 41% | - | – | 1% |
Illinois
Graphical summary
Aggregate polls
| Source of poll aggregation |
Dates administered |
Dates updated |
Joe Biden Democratic |
Donald Trump Republican |
Other/ Undecided [lower-alpha 1] |
Margin |
|---|---|---|---|---|---|---|
| 270 to Win | September 23 – October 17, 2020 | October 27, 2020 | 56.5% | 38.5% | 5.0% | Biden +18.0 |
| FiveThirtyEight | until October 25, 2020 | October 27, 2020 | 55.2% | 39.4% | 5.4% | Biden +15.8 |
| Average | 55.9% | 39.0% | 5.1% | Biden +16.9 | ||
Polls
| Poll source | Date(s) administered |
Sample size[lower-alpha 2] |
Margin of error |
Donald Trump Republican |
Joe Biden Democratic |
Jo Jorgensen Libertarian |
Howie Hawkins Green |
Other | Undecided |
|---|---|---|---|---|---|---|---|---|---|
| SurveyMonkey/Axios | Oct 20 – Nov 2, 2020 | 5,643 (LV) | ± 2% | 40%[lower-alpha 343] | 58% | - | - | – | – |
| Research Co. | Oct 31 – Nov 1, 2020 | 450 (LV) | ± 4.6% | 38% | 55% | - | - | 1%[lower-alpha 344] | 6% |
| Victory Research | Oct 28 – Nov 1, 2020 | 1,208 (LV) | ± 2.82% | 38% | 54% | - | - | 4% | 4% |
| Swayable | Oct 27 – Nov 1, 2020 | 485 (LV) | ± 6% | 44% | 55% | 1% | 0% | – | – |
| SurveyMonkey/Axios | Oct 1–28, 2020 | 8,056 (LV) | – | 41% | 57% | - | - | – | – |
| Swayable | Oct 23–26, 2020 | 424 (LV) | ± 6.2% | 43% | 54% | 2% | 1% | – | – |
| SurveyMonkey/Axios | Sep 1–30, 2020 | 8,392 (LV) | – | 36% | 61% | - | - | – | 3% |
| Victory Research | Sep 23–26, 2020 | 1,208 (LV) | ± 2.82% | 40% | 53% | - | - | 4% | 3% |
| SurveyMonkey/Axios | Aug 1–31, 2020 | 6,773 (LV) | – | 38% | 60% | - | - | – | 2% |
| SurveyMonkey/Axios | Jul 1–31, 2020 | 7,565 (LV) | – | 38% | 59% | - | - | – | 2% |
| SurveyMonkey/Axios | Jun 8–30, 2020 | 3,000 (LV) | – | 39% | 59% | - | - | – | 2% |
Indiana
Graphical summary
Aggregate polls
| Source of poll aggregation |
Dates administered |
Dates updated |
Joe Biden Democratic |
Donald Trump Republican |
Other/ Undecided [lower-alpha 1] |
Margin |
|---|---|---|---|---|---|---|
| FiveThirtyEight | until October 31, 2020 | November 1, 2020 | 41.8% | 51.2% | 7.0% | Trump +9.4 |
Polls
| Poll source | Date(s) administered |
Sample size[lower-alpha 2] |
Margin of error |
Donald Trump Republican |
Joe Biden Democratic |
Jo Jorgensen Libertarian |
Other | Undecided |
|---|---|---|---|---|---|---|---|---|
| SurveyMonkey/Axios | Oct 20 – Nov 2, 2020 | 2,729 (LV) | ± 2.5% | 54%[lower-alpha 345] | 44% | – | – | – |
| Swayable | Oct 27 – Nov 1, 2020 | 264 (LV) | ± 7.8% | 55% | 43% | 2% | – | – |
| Morning Consult | Oct 22–31, 2020 | 1,147 (LV) | ± 3% | 53% | 42% | – | – | – |
| SurveyMonkey/Axios | Oct 1–28, 2020 | 4,734 (LV) | – | 55% | 43% | – | – | – |
| Swayable | Oct 23–26, 2020 | 301 (LV) | ± 7.4% | 53% | 42% | 5% | – | – |
| Ragnar Research (R) | Oct 18–21, 2020 | 529 (LV) | ± 4% | 48% | 40% | 5% | – | 7% |
| SurveyUSA/Election Twitter | Oct 10–13, 2020 | 527 (LV) | ± 5.2% | 49% | 42% | – | 3% | 6% |
| SurveyMonkey/Axios | Sep 1–30, 2020 | 2,367 (LV) | – | 53% | 45% | – | – | – |
| Change Research/IndyPolitics | Sep 3–7, 2020 | 1,033 (LV) | ± 3.1% | 53% | 39% | 5% | – | 3% |
| SurveyMonkey/Axios | Aug 1–31, 2020 | 1,672 (LV) | – | 55% | 43% | – | – | – |
| Morning Consult | Jul 24 – Aug 2, 2020[lower-alpha 346] | 900 (LV) | ± 3.5% | 55% | 38% | – | – | – |
| SurveyMonkey/Axios | Jul 1–31, 2020 | 2,175 (LV) | – | 56% | 43% | – | – | – |
| SurveyMonkey/Axios | Jun 8–30, 2020 | 929 (LV) | – | 57% | 40% | – | – | – |
| Victoria Research/Tallian for Attorney General[upper-alpha 37] | May 21–23, 2020 | 894 (LV) | ± 3.3% | 49% | 39% | – | – | – |
| Indy Politics/Change Research | Apr 10–13, 2020 | 1,021 (LV) | ± 3.1% | 52% | 39% | – | 5% | 3% |
Iowa
Graphical summary
Aggregate polls
| Source of poll aggregation |
Dates administered |
Dates updated |
Joe Biden Democratic |
Donald Trump Republican |
Other/ Undecided [lower-alpha 1] |
Margin |
|---|---|---|---|---|---|---|
| 270 to Win | October 26 – Nov 2, 2020 | November 2, 2020 | 46.2% | 47.8% | 6.0% | Trump +1.6 |
| Real Clear Politics | October 21–30, 2020 | November 2, 2020 | 45.8% | 47.2% | 7.0% | Trump +1.4 |
| FiveThirtyEight | until November 1, 2020 | November 2, 2020 | 46.1% | 47.5% | 6.4% | Trump +1.4 |
| Average | 46.0% | 47.5% | 6.5% | Trump +1.5 | ||
Polls
| Poll source | Date(s) administered |
Sample size[lower-alpha 2] |
Margin of error |
Donald Trump Republican |
Joe Biden Democratic |
Jo Jorgensen Libertarian |
Howie Hawkins Green |
Other | Undecided |
|---|---|---|---|---|---|---|---|---|---|
| Public Policy Polling | Nov 1–2, 2020 | 871 (V) | – | 48% | 49% | - | - | 2%[lower-alpha 347] | 1% |
| SurveyMonkey/Axios | Oct 20 – Nov 2, 2020 | 1,489 (LV) | ± 3.5% | 51%[lower-alpha 348] | 48% | - | - | – | – |
| Change Research | Oct 29 – Nov 1, 2020 | 1,084 (LV) | ± 3.2% | 47% | 47% | 3% | 0% | 2%[lower-alpha 349] | 1% |
| Civiqs/Daily Kos | Oct 29 – Nov 1, 2020 | 853 (LV) | ± 3.7% | 48% | 49% | - | - | 3%[lower-alpha 350] | 0% |
| Data for Progress | Oct 27 – Nov 1, 2020 | 951 (LV) | ± 3.2% | 49% | 47% | 3% | 1% | 1%[lower-alpha 351] | – |
| Emerson College | Oct 29–31, 2020 | 604 (LV) | ± 3.9% | 49%[lower-alpha 352] | 47% | - | - | 4% | 0% |
| InsiderAdvantage/Center for American Greatness[upper-alpha 8] | Oct 30, 2020 | 400 (LV) | ± 4.9% | 48% | 46% | 1% | - | – | 6% |
| Selzer & Co./Des Moines Register | Oct 26–29, 2020 | 814 (LV) | ± 3.4% | 48% | 41% | - | - | 8%[lower-alpha 353] | 2%[lower-alpha 354] |
| SurveyMonkey/Axios | Oct 1–28, 2020 | 3,005 (LV) | ± 2.5% | 50% | 49% | - | - | - | 2% |
| Quinnipiac University | Oct 23–27, 2020 | 1,225 (LV) | ± 2.8% | 47% | 46% | - | - | 1%[lower-alpha 355] | 6% |
| RABA Research/WHO13 News | Oct 21–24, 2020 | 693 (LV) | ± 4% | 46% | 50% | - | - | 2%[lower-alpha 356] | 1% |
| Emerson College | Oct 19–21, 2020 | 435 (LV) | ± 4.7% | 48%[lower-alpha 357] | 48% | - | - | 4%[lower-alpha 358] | 0% |
| RMG Research/PoliticalIQ | Oct 15–21, 2020 | 800 (LV) | ± 3.5% | 47%[lower-alpha 14] | 47% | - | - | 2%[lower-alpha 359] | 4% |
| 45%[lower-alpha 360] | 49% | - | - | 2%[lower-alpha 361] | 4% | ||||
| 49%[lower-alpha 362] | 48% | - | - | 2%[lower-alpha 363] | 4% | ||||
| Siena College/NYT Upshot | Oct 18–20, 2020 | 753 (LV) | ± 3.9% | 43% | 46% | 2% | 1% | 1%[lower-alpha 364] | 7%[lower-alpha 365] |
| Insider Advantage/Center for American Greatness[upper-alpha 8] | Oct 18–19, 2020 | 400 (LV) | ± 4.9% | 45% | 45% | 2% | - | – | 8% |
| Monmouth University | Oct 15–19, 2020 | 501 (RV) | ± 4.4% | 48% | 47% | 1% | 0%[lower-alpha 366] | 2%[lower-alpha 367] | 2% |
| 501 (LV)[lower-alpha 368] | 47% | 50% | - | - | – | – | |||
| 501 (LV)[lower-alpha 369] | 46% | 51% | - | - | – | – | |||
| David Binder Research/Focus on Rural America | Oct 10–13, 2020 | 200 (LV) | – | 50% | 44% | - | - | – | – |
| Data for Progress (D) | Oct 8–11, 2020 | 822 (LV) | ± 3.4% | 48% | 47% | 2% | 0% | – | 3% |
| YouGov/CBS | Oct 6–9, 2020 | 1,035 (LV) | ± 3.5% | 49% | 49% | - | - | 2%[lower-alpha 370] | 0% |
| Opinion Insight/American Action Forum[upper-alpha 10] | Oct 5–8, 2020 | 800 (LV) | ± 3.46% | 46%[lower-alpha 371] | 47% | - | - | 3%[lower-alpha 372] | 4%[lower-alpha 373] |
| Civiqs/Daily Kos | Oct 3–6, 2020 | 756 (LV) | ± 3.9% | 47% | 48% | - | - | 4%[lower-alpha 374] | 1% |
| Quinnipiac University | Oct 1–5, 2020 | 1,205 (LV) | ± 2.8% | 45% | 50% | - | - | 2%[lower-alpha 375] | 3% |
| SurveyMonkey/Axios | Sep 1–30, 2020 | 1,276 (LV) | – | 52% | 46% | - | - | – | 2% |
| Data for Progress (D) | Sep 23–28, 2020 | 743 (LV) | ± 3.6% | 47%[lower-alpha 14] | 44% | 1% | 1% | – | 6% |
| 50%[lower-alpha 376] | 45% | - | - | – | 5% | ||||
| Hart Research Associates/Human Rights Campaign[upper-alpha 38] | Sep 24–27, 2020 | 400 (LV) | ± 4.9% | 49% | 47% | - | - | – | – |
| RABA Research/WHO13 News | Sep 23–26, 2020 | 780 (LV) | ± 4% | 46% | 48% | - | - | 2%[lower-alpha 377] | 4% |
| Monmouth University | Sep 18–22, 2020 | 402 (RV) | ± 4.9% | 50% | 44% | 2% | 0% | 1%[lower-alpha 378] | 2% |
| 402 (LV) | 49%[lower-alpha 368] | 46% | 2% | – | 2%[lower-alpha 379] | 2% | |||
| 49%[lower-alpha 369] | 46% | 2% | – | 2%[lower-alpha 380] | 2% | ||||
| Siena College/NYT Upshot | Sep 16–22, 2020 | 501 (LV) | ± 4.99% | 42% | 45% | 2% | 0% | 1%[lower-alpha 381] | 10%[lower-alpha 382] |
| Selzer & Co./Des Moines Register | Sep 14–17, 2020 | 658 (LV) | ± 3.8% | 47% | 47% | - | - | 4%[lower-alpha 383] | 3% |
| Fabrizio Ward/Hart Research Associates/AARP | Aug 30 – Sep 5, 2020 | 800 (LV) | ± 3.5% | 47% | 45% | - | - | 1%[lower-alpha 384] | 6% |
| Opinion Insight/American Action Forum[upper-alpha 10] | Aug 30 – Sep 2, 2020 | 800 (LV) | ± 3.46% | 51%[lower-alpha 385] | 43% | 3% | 1% | – | 2% |
| SurveyMonkey/Axios | Aug 1–31, 2020 | 983 (LV) | – | 53% | 46% | - | - | – | 2% |
| Monmouth University | Jul 30 – Aug 3, 2020 | 401 (RV) | ± 4.9% | 48% | 45% | 3% | - | <1%[lower-alpha 386] | 3% |
| 401 (LV) | 48%[lower-alpha 387] | 46% | 2% | <1%[lower-alpha 388] | 3% | ||||
| 47%[lower-alpha 389] | 47% | 2% | 0%[lower-alpha 390] | 3% | |||||
| Data for Progress | Jul 24 – Aug 2, 2020 | 1,101 (LV) | – | 44%[lower-alpha 14] | 42% | 3% | 1% | – | 10% |
| 46%[lower-alpha 391] | 45% | - | - | – | 9% | ||||
| David Binder Research/Focus on Rural America | Jul 30–31, 2020 | 200 (LV) | – | 43% | 49% | - | - | – | – |
| SurveyMonkey/Axios | Jul 1–31, 2020 | 1,095 (LV) | – | 54% | 45% | - | - | – | 1% |
| RMG Research | Jul 27–30, 2020 | 500 (RV) | ± 4.5% | 41% | 40% | - | - | 7% | 13% |
| Public Policy Polling/AFSCME[upper-alpha 6] | Jul 23–24, 2020 | 1,118 (V) | – | 48% | 47% | - | - | – | 6% |
| Spry Strategies/American Principles Project[upper-alpha 39] | Jul 11–16, 2020 | 701 (LV) | ± 3.7% | 46% | 48% | - | - | – | 7% |
| SurveyMonkey/Axios | Jun 8–30, 2020 | 455 (LV) | – | 50% | 48% | - | - | – | 2% |
| Selzer/Des Moines Register | Jun 7–10, 2020 | 674 (LV) | ± 3.8% | 44% | 43% | - | - | 10%[lower-alpha 392] | 3% |
| Civiqs/Daily Kos | Jun 6–8, 2020 | 865 (RV) | ± 3.8% | 46% | 46% | - | - | 7%[lower-alpha 393] | 1% |
| Public Policy Polling/Emily's List[upper-alpha 40] | Jun 3–4, 2020 | 963 (V) | – | 48% | 47% | - | - | – | 5% |
| Public Policy Polling | Apr 30 – May 1, 2020 | 1,222 (V) | ± 2.8% | 48% | 46% | - | - | – | 6% |
| GBAO Strategies/PLUS Paid Family Leave | Apr 13–16, 2020 | 500 (LV) | – | 48% | 45% | - | - | 1% | 6% |
| Selzer/Des Moines Register | Mar 2–5, 2020 | 667 (LV) | ± 3.8% | 51% | 41% | - | - | – | – |
| The New York Times/Siena College | Jan 20–23, 2020 | 1,689 (RV) | ± 2.8% | 46% | 44% | - | - | 5%[lower-alpha 394] | 6% |
| Public Policy Polling | Dec 29–31, 2019 | 964 (V) | – | 49% | 46% | - | - | – | 5% |
| Emerson College | Dec 7–10, 2019 | 1,043 (RV) | ± 3% | 49% | 45% | - | - | – | 6% |
| NYT Upshot/Siena College | Oct 25–30, 2019 | 1,435 (RV) | ± 3.1% | 45% | 44% | - | - | 3% | 5% |
| Emerson College | Oct 13–16, 2019 | 888 (RV) | ± 3.2% | 51% | 49% | - | - | – | – |
| WPA Intelligence (R) | Apr 27–30, 2019 | 200 (LV) | ± 6.9% | 49% | 44% | - | - | – | 5% |
| Emerson College | Mar 21–24, 2019 | 707 (RV) | ± 3.6% | 47% | 53% | - | - | – | – |
| Emerson College | Jan 30 – Feb 2, 2019 | 831 (RV) | ± 3.4% | 49% | 51% | - | - | – | – |
Kansas
Graphical summary
Aggregate polls
| Source of poll aggregation |
Dates administered |
Dates updated |
Joe Biden Democratic |
Donald Trump Republican |
Other/ Undecided [lower-alpha 1] |
Margin |
|---|---|---|---|---|---|---|
| 270 to Win | September 26 – October 20, 2020 | October 22, 2020 | 43.0% | 51.7% | 5.3% | Trump +8.7 |
| FiveThirtyEight | until October 31, 2020 | November 1, 2020 | 41.7% | 51.8% | 6.5% | Trump +10.1 |
| Average | 42.4% | 51.8% | 5.8% | Trump +9.4 | ||
Polls
| Poll source | Date(s) administered |
Sample size[lower-alpha 2] |
Margin of error |
Donald Trump Republican |
Joe Biden Democratic |
Jo Jorgensen Libertarian |
Other | Undecided |
|---|---|---|---|---|---|---|---|---|
| SurveyMonkey/Axios | Oct 20 – Nov 2, 2020 | 2,321 (LV) | ± 3% | 55%[lower-alpha 395] | 44% | – | – | – |
| Data For Progress | Oct 27 – Nov 1, 2020 | 1,121 (LV) | ± 2.9% | 55% | 41% | 3% | 2%[lower-alpha 396] | – |
| SurveyMonkey/Axios | Oct 1–28, 2020 | 3,442 (LV) | ± 2.5% | 51% | 47% | – | – | – |
| PPP/Protect Our Care[upper-alpha 41] | Oct 19–20, 2020 | 897 (V) | ± 3.3% | 54% | 42% | – | – | 4% |
| Siena College/NYT Upshot | Oct 18–20, 2020 | 755 (LV) | ± 4% | 48% | 41% | 4% | 2%[lower-alpha 397] | 6%[lower-alpha 398] |
| co/efficient/Keep Kansas Great PAC[upper-alpha 42] | Oct 18–20, 2020 | 2,453 (LV) | ± 3.7% | 56% | 39% | 2% | – | 3% |
| Fort Hays State University | Sep 21 – Oct 1, 2020 | 306 (RV) | ± 4.8% | 52% | 38% | – | 11%[lower-alpha 399] | – |
| SurveyMonkey/Axios | Sep 1–30, 2020 | 1,135 (LV) | – | 52% | 47% | – | – | 1% |
| Civiqs/Daily Kos | Sep 26–29, 2020 | 677 (LV) | ± 4.5% | 52% | 42% | – | 4%[lower-alpha 400] | 1% |
| Data For Progress (D) | Sep 14–19, 2020 | 883 (LV) | ± 3.3% | 48%[lower-alpha 401] | 42% | 3% | 1%[lower-alpha 402] | 7% |
| 49%[lower-alpha 403] | 45% | – | – | 6% | ||||
| co/efficient/Keep Kansas Great PAC[upper-alpha 42] | Sep 15–16, 2020 | 794 (LV) | ± 3.5% | 53% | 41% | – | – | – |
| SurveyMonkey/Axios | Aug 1–31, 2020 | 922 (LV) | – | 54% | 45% | – | – | 1% |
| SurveyUSA | Aug 5–9, 2020 | 1,202 (LV) | ± 3.3% | 48% | 41% | – | 5%[lower-alpha 404] | 6% |
| Public Policy Polling[upper-alpha 43] | Aug 5–6, 2020 | 864 (V) | ± 3.3% | 50% | 43% | – | – | 7% |
| SurveyMonkey/Axios | Jul 1–31, 2020 | 1,295 (LV) | – | 51% | 47% | – | – | 2% |
| SurveyMonkey/Axios | Jun 8–30, 2020 | 466 (LV) | – | 53% | 45% | – | – | 2% |
| Civiqs/Daily Kos | May 30 – Jun 1, 2020 | 699 (RV) | ± 4.2% | 52% | 40% | – | 6%[lower-alpha 405] | 2% |
| The Progress Campaign (D) | Apr 15–22, 2020 | 1,632 (LV) | ± 4.7% | 51% | 41% | – | – | 8% |
| Public Policy Polling | Mar 10–11, 2020 | 1,567 (V) | – | 52% | 40% | – | – | 8% |
| DFM Research | Jan 30 – Feb 6, 2020 | 600 (A) | ±4% | 51% | 43% | – | 3%[lower-alpha 406] | 3% |
Kentucky
Graphical summary
Aggregate polls
| Source of poll aggregation |
Dates administered |
Dates updated |
Joe Biden Democratic |
Donald Trump Republican |
Other/ Undecided [lower-alpha 1] |
Margin |
|---|---|---|---|---|---|---|
| 270 to Win | September 20 – October 25, 2020 | October 27, 2020 | 40.0% | 57.0% | 3.0% | Trump +17.0 |
| FiveThirtyEight | until October 25, 2020 | October 27, 2020 | 39.1% | 56.7% | 4.2% | Trump +17.6 |
| Average | 39.6% | 56.9% | 3.5% | Trump +17.3 | ||
Polls
| Poll source | Date(s) administered |
Sample size[lower-alpha 2] |
Margin of error |
Donald Trump Republican |
Joe Biden Democratic |
Jo Jorgensen Libertarian |
Other | Undecided |
|---|---|---|---|---|---|---|---|---|
| SurveyMonkey/Axios | Oct 20 – Nov 2, 2020 | 2,009 (LV) | ± 3% | 59%[lower-alpha 407] | 40% | - | – | – |
| Swayable | Oct 23 – Nov 1, 2020 | 383 (LV) | ± 7.4% | 55% | 42% | 4% | – | – |
| Bluegrass Community & Technical College | Oct 12–28, 2020 | 250 (RV) | – | 52% | 39% | – | – | 9% |
| SurveyMonkey/Axios | Oct 1–28, 2020 | 3,621 (LV) | – | 56% | 42% | – | – | – |
| Mason-Dixon | Oct 12–15, 2020 | 625 (LV) | ± 4% | 56% | 39% | - | 1% | 4% |
| SurveyMonkey/Axios | Sep 1–30, 2020 | 1,479 (LV) | – | 59% | 39% | - | – | 1% |
| Data for Progress (D) | Sep 14–19, 2020 | 807 (LV) | ± 3.5% | 55%[lower-alpha 408] | 35% | 1% | 1%[lower-alpha 409] | 8% |
| 56%[lower-alpha 410] | 38% | - | – | 6% | ||||
| Quinnipiac University | Sep 10–14, 2020 | 1,164 (LV) | ± 2.9% | 58% | 38% | - | 1%[lower-alpha 411] | 4% |
| SurveyMonkey/Axios | Aug 1–31, 2020 | 1,231 (LV) | – | 60% | 38% | - | – | 2% |
| Quinnipiac University | Jul 30 – Aug 3, 2020 | 909 (RV) | ± 3.3% | 50% | 41% | - | 4%[lower-alpha 412] | 5% |
| Morning Consult | Jul 24 – Aug 2, 2020 | 793 (LV) | ± 3.0% | 59% | 35% | - | 2%[lower-alpha 413] | 4% |
| SurveyMonkey/Axios | Jul 1–31, 2020 | 1,709 (LV) | – | 62% | 37% | - | – | 1% |
| Bluegrass Data/Ditch Mitch Fund[upper-alpha 44] | Jul 25–29, 2020 | 3,020 (RV) | ± 2.0% | 52% | 45% | - | – | – |
| Spry Strategies/American Principles Project[upper-alpha 45] | Jul 11–16, 2020 | 600 (LV) | ± 3.7% | 60% | 34% | - | – | 6% |
| Garin-Hart-Yang/Amy McGrath[upper-alpha 46] | Jul 7–12, 2020 | 800 (LV) | ± 3.5% | 53% | 41% | - | – | – |
| SurveyMonkey/Axios | Jun 8–30, 2020 | 596 (LV) | – | 60% | 38% | - | – | 2% |
| Garin-Hart-Yang/Amy McGrath[upper-alpha 46] | Jun 2020 | – (V)[lower-alpha 414] | – | 54% | 39% | - | – | – |
| Civiqs/Data for Progress | Jun 13–15, 2020 | 898 (RV) | ± 3.8% | 57% | 37% | - | 5%[lower-alpha 415] | 1% |
| Garin-Hart-Yang/Amy McGrath[upper-alpha 46] | May 2020 | – (V)[lower-alpha 416] | – | 57% | 36% | - | – | – |
| RMG Research/U.S. Term Limits[upper-alpha 47] | May 21–24, 2020 | 500 (RV) | ± 4.5% | 53% | 36% | - | 6%[lower-alpha 417] | 5% |
| Public Policy Polling | May 14–15, 2020 | 1,104 (V) | – | 55% | 39% | - | 5%[lower-alpha 418] | 2% |
| Bluegrass Data/Ditch Mitch Fund[upper-alpha 48] | Apr 7–12, 2020[lower-alpha 419] | 4,000 (RV) | – | 55% | 34% | - | – | – |
| Fabrizio Ward/AARP | Jul 29–31, 2019 | 600 (LV) | ± 4.0% | 53% | 41% | - | – | 4% |
| Gravis Marketing | Jun 11–12, 2019 | 741 (LV) | ± 3.6% | 57% | 37% | - | – | 6% |
Louisiana
- Graphical summary
Aggregate polls
| Source of poll aggregation |
Dates administered |
Dates updated |
Joe Biden Democratic |
Donald Trump Republican |
Other/ Undecided [lower-alpha 1] |
Margin |
|---|---|---|---|---|---|---|
| 270 to Win | September 1 – October 22, 2020 | October 27, 2020 | 36.7% | 57.7% | 5.6% | Trump +21.0 |
| FiveThirtyEight | until October 25, 2020 | October 27, 2020 | 37.5% | 56.1% | 6.4% | Trump +18.7 |
| Average | 37.1% | 56.9% | 6.0% | Trump +19.8 | ||
Polls
| Poll source | Date(s) administered |
Sample size[lower-alpha 2] |
Margin of error |
Donald Trump Republican |
Joe Biden Democratic |
Jo Jorgensen Libertarian |
Howie Hawkins Green |
Other | Undecided |
|---|---|---|---|---|---|---|---|---|---|
| SurveyMonkey/Axios | Oct 20 – Nov 2, 2020 | 1,556 (LV) | ± 3.5% | 62%[lower-alpha 420] | 36% | – | – | – | – |
| Swayable | Oct 23 – Nov 1, 2020 | 378 (LV) | ± 6.7% | 57% | 39% | 4% | – | – | – |
| SurveyMonkey/Axios | Oct 1–28, 2020 | 2,633 (LV) | – | 60% | 38% | – | – | – | – |
| University of New Orleans | Oct 22, 2020 | 755 (LV) | ± 3.6% | 59% | 36% | – | – | 4% | 1% |
| Trafalgar Group | Oct 4–6, 2020 | 1,048 (LV) | ± 2.95% | 54% | 36% | 3% | – | 1%[lower-alpha 421] | 6% |
| SurveyMonkey/Axios | Sep 1–30, 2020 | 2,475 (LV) | – | 60% | 38% | – | – | – | 2% |
| Tyson Group/Consumer Energy Alliance[upper-alpha 2] | Sep 2–5, 2020 | 600 (LV) | ± 4% | 48% | 42% | 2% | – | No voters[lower-alpha 422] | 7% |
| SurveyMonkey/Axios | Aug 1–31, 2020 | 2,587 (LV) | – | 59% | 38% | – | – | – | 2% |
| Trafalgar Group | Aug 13–17, 2020 | 1,002 (LV) | ± 2.99% | 54% | 38% | 3% | – | 1%[lower-alpha 423] | 4% |
| ALG Research/Perkins for LA[upper-alpha 49] | Aug 6–12, 2020 | 800 (LV) | ± 3.5% | 50% | 43% | – | – | – | 7% |
| SurveyMonkey/Axios | Jul 1–31, 2020 | 2,998 (LV) | – | 60% | 39% | – | – | – | 2% |
| SurveyMonkey/Axios | Jun 8–30, 2020 | 1,134 (LV) | – | 60% | 37% | – | – | – | 3% |
Maine
Graphical summary (statewide)
Aggregate polls
| Source of poll aggregation |
Dates administered |
Dates updated |
Joe Biden Democratic |
Donald Trump Republican |
Other/ Undecided [lower-alpha 1] |
Margin |
|---|---|---|---|---|---|---|
| 270 to Win | September 25 – October 31, 2020 | November 2, 2020 | 51.8% | 40.2% | 8.0% | Biden +11.6 |
| FiveThirtyEight | until October 31, 2020 | November 2, 2020 | 53.9% | 40.4% | 5.7% | Biden +13.5 |
| Average | 52.8% | 40.3% | 6.9% | Biden +12.5 | ||
Statewide polls
| Poll source | Date(s) administered |
Sample size[lower-alpha 2] |
Margin of error |
Donald Trump Republican |
Joe Biden Democratic |
Jo Jorgensen Libertarian |
Howie Hawkins Green |
Other | Undecided |
|---|---|---|---|---|---|---|---|---|---|
| Change Research | Oct 29 – Nov 2, 2020 | 1,024 (LV) | ± 3.5% | 40% | 52% | 4% | 2% | 1%[lower-alpha 424] | 1% |
| SurveyMonkey/Axios | Oct 20 – Nov 2, 2020 | 1,274 (LV) | ± 4% | 42%[lower-alpha 425] | 56% | – | – | – | – |
| Emerson College | Oct 29–31, 2020 | 611 (LV) | ± 3.9% | 43%[lower-alpha 426] | 54% | – | – | 2%[lower-alpha 427] | – |
| SurveyMonkey/Axios | Oct 1–28, 2020 | 1,995 (LV) | – | 43% | 56% | – | – | – | – |
| SurveyUSA/FairVote | Oct 23–27, 2020 | 1,007 (LV) | ± 3.7% | 40%[lower-alpha 14] | 53% | 2% | 2% | 1%[lower-alpha 428] | 2% |
| 42%[lower-alpha 429] | 55% | – | – | 1%[lower-alpha 430] | 2% | ||||
| Colby College | Oct 21–25, 2020 | 879 (LV) | ± 3.3% | 38% | 51% | – | – | 4%[lower-alpha 431] | 8% |
| Pan Atlantic Research | Oct 2–6, 2020 | 600 (LV) | ± 4.5% | 40% | 50% | – | – | 6%[lower-alpha 432] | 4% |
| Critical Insights/Digital Research/Bangor Daily News | Sep 25 – Oct 4, 2020 | 466 (LV) | ± 4.4% | 40%[lower-alpha 14] | 51% | 3% | 1% | 2%[lower-alpha 433] | 3% |
| 40%[lower-alpha 434] | 52% | – | – | 5%[lower-alpha 435] | 3% | ||||
| SurveyMonkey/Axios | Sep 1–30, 2020 | 729 (LV) | – | 38% | 60% | – | – | – | 2% |
| Data for Progress (D) | Sep 23–28, 2020 | 718 (LV) | ± 3.7% | 39%[lower-alpha 14] | 53% | 2% | 1% | – | 5% |
| 41%[lower-alpha 436] | 55% | – | – | – | 4% | ||||
| Colby College | Sep 17–23, 2020 | 847 (LV) | ± 3.4% | 39% | 50% | – | – | 4%[lower-alpha 437] | 6% |
| Suffolk University/Boston Globe | Sep 17–20, 2020 | 500 (LV) | ± 4.4% | 39%[lower-alpha 14] | 51% | 1% | 0% | 1%[lower-alpha 438] | 7% |
| 39%[lower-alpha 439] | 51% | – | – | 2%[lower-alpha 440] | 8% | ||||
| Siena College/NYT Upshot | Sep 11–16, 2020 | 663 (LV) | ± 5.1% | 38%[lower-alpha 441] | 55% | 0% | 0% | 1%[lower-alpha 442] | 6%[lower-alpha 443] |
| Quinnipiac University | Sep 10–14, 2020 | 1,183 (LV) | ± 2.9% | 38% | 59% | – | – | 0%[lower-alpha 444] | 3% |
| Fabrizio Ward/Hart Research Associates/AARP | Aug 30 – Sep 5, 2020 | 800 (LV) | ± 3.5% | 40% | 54% | – | – | 1%[lower-alpha 445] | 5% |
| SurveyMonkey/Axios | Aug 1–31, 2020 | 502 (LV) | – | 37% | 61% | – | – | – | 1% |
| Critical Insights/Digital Research/Bangor Daily News | Jul 28 – Aug 9, 2020 | 453 (LV) | – | 38% | 45% | – | – | 11%[lower-alpha 446] | 6% |
| Quinnipiac University | Jul 30 – Aug 3, 2020 | 805 (RV) | ± 3.7% | 37% | 52% | – | – | 6%[lower-alpha 447] | 4% |
| RMG Research | Jul 27 – Aug 2, 2020 | 500 (RV) | ± 4.5% | 39% | 50% | – | – | 7%[lower-alpha 448] | 4% |
| Data for Progress | Jul 24 – Aug 2, 2020 | 866 (LV) | – | 42%[lower-alpha 14] | 49% | 1% | 1% | – | 7% |
| 43%[lower-alpha 449] | 53% | – | – | – | 4% | ||||
| SurveyMonkey/Axios | Jul 1–31, 2020 | 733 (LV) | – | 41% | 57% | – | – | – | 1% |
| Public Policy Polling/AFSCME[upper-alpha 6] | Jul 23–24, 2020 | 962 (V) | – | 42% | 53% | – | – | – | 5% |
| Colby College/SocialSphere | Jul 18–24, 2020 | 888 (RV) | ± 3.9% | 38% | 50% | – | – | 5%[lower-alpha 450] | 7% |
| Public Policy Polling | Jul 2–3, 2020 | 1,022 (V) | ± 3.1% | 42% | 53% | – | – | – | 5% |
| SurveyMonkey/Axios | Jun 8–30, 2020 | 202 (LV) | – | 46% | 51% | – | – | – | 3% |
| Public Policy Polling | Mar 2–3, 2020 | 872 (V) | ± 3.3% | 42% | 52% | – | – | – | 6% |
| Public Policy Polling | Oct 11–13, 2019 | 939 (LV) | ± 3.2% | 42% | 54% | – | – | – | 4% |
| Fabrizio Ward/AARP | Jul 29–31, 2019 | 600 (LV) | ± 4.0% | 44% | 50% | – | – | – | 5% |
| Gravis Marketing | Jun 24, 2019 | 767 (RV) | ± 3.5% | 46% | 54% | – | – | – | – |
Maryland
Graphical summary
Aggregate polls
| Source of poll aggregation |
Dates administered |
Dates updated |
Joe Biden Democratic |
Donald Trump Republican |
Other/ Undecided [lower-alpha 1] |
Margin |
|---|---|---|---|---|---|---|
| 270 to Win | September 29 – October 24, 2020 | October 28, 2020 | 60.0% | 31.7% | 8.3% | Biden +28.3 |
| Real Clear Politics | September 4 – October 24, 2020 | October 28, 2020 | 60.3% | 31.0% | 8.7% | Biden +29.3 |
| FiveThirtyEight | until October 27, 2020 | October 28, 2020 | 61.5% | 32.0% | 6.5% | Biden +29.5 |
| Average | 60.6% | 31.6% | 7.8% | Biden +29.0 | ||
Polls
| Poll source | Date(s) administered |
Sample size[lower-alpha 2] |
Margin of error |
Donald Trump Republican |
Joe Biden Democratic |
Jo Jorgensen Libertarian |
Howie Hawkins Green |
Other | Undecided |
|---|---|---|---|---|---|---|---|---|---|
| SurveyMonkey/Axios | Oct 20 – Nov 2, 2020 | 3,216 (LV) | ± 2.5% | 31%[lower-alpha 451] | 66% | – | – | – | – |
| Swayable | Oct 23 – Nov 1, 2020 | 503 (LV) | ± 5.7% | 31% | 67% | 2% | 0% | – | – |
| SurveyMonkey/Axios | Oct 1–28, 2020 | 5,820 (LV) | – | 32% | 66% | – | – | – | – |
| Gonzalez Maryland Poll | Oct 19–24, 2020 | 820 (RV) | ± 3.5% | 33% | 58% | – | – | 3%[lower-alpha 452] | 6% |
| Goucher College | Sep 30 – Oct 4, 2020 | 776 (LV) | ± 3.5% | 30% | 61% | 2% | 2% | 3%[lower-alpha 453] | 2% |
| Change Research/Our Voice Maryland | Sep 29 – Oct 1, 2020 | 650 (V) | ± 4.55% | 32% | 61% | – | – | – | – |
| SurveyMonkey/Axios | Sep 1–30, 2020 | 2,364 (LV) | – | 31% | 67% | – | – | – | 2% |
| OpinionWorks | Sep 4–11, 2020 | 753 (LV) | – | 30% | 62% | – | – | 3%[lower-alpha 454] | 5% |
| SurveyMonkey/Axios | Aug 1–31, 2020 | 1,813 (LV) | – | 31% | 66% | – | – | – | 3% |
| SurveyMonkey/Axios | Jul 1–31, 2020 | 1,911 (LV) | – | 32% | 66% | – | – | – | 2% |
| SurveyMonkey/Axios | Jun 8–30, 2020 | 1,175 (LV) | – | 34% | 64% | – | – | – | 2% |
| Gonzalez Maryland Poll | May 19–23, 2020 | 810 (LV) | ± 3.5% | 31% | 59% | – | – | – | 6% |
| Goucher College | Feb 13–19, 2020 | 718 (LV) | ± 3.6% | 35% | 60% | – | – | 1%[lower-alpha 455] | 4%[lower-alpha 456] |
Massachusetts
Graphical summary
Aggregate polls
| Source of poll aggregation |
Dates administered |
Dates updated |
Joe Biden Democratic |
Donald Trump Republican |
Other/ Undecided [lower-alpha 1] |
Margin |
|---|---|---|---|---|---|---|
| 270 to Win | September 20 – October 21, 2020 | October 28, 2020 | 66.5% | 29.0% | 4.5% | Biden +37.5 |
| RealClearPolitics | July 31 – August 27, 2020 | September 15, 2020 | 64.0% | 28.3% | 7.7% | Biden +35.7 |
| FiveThirtyEight | until October 27, 2020 | October 28, 2020 | 65.7% | 29.1% | 5.2% | Biden +36.6 |
| Average | 65.4% | 28.8% | 5.8% | Biden +36.6 | ||
- Polls
| Poll source | Date(s) administered |
Sample size[lower-alpha 2] |
Margin of error |
Donald Trump Republican |
Joe Biden Democratic |
Jo Jorgensen Libertarian |
Howie Hawkins Green |
Other | Undecided |
|---|---|---|---|---|---|---|---|---|---|
| MassInc | Oct 23–30, 2020 | 929 (LV) | – | 28% | 62% | - | - | 8%[lower-alpha 457] | 2% |
| SurveyMonkey/Axios | Oct 1–28, 2020 | 5,848 (LV) | – | 28% | 70% | - | - | – | – |
| YouGov/UMass Amherst | Oct 14–21, 2020 | 713 (LV) | – | 29% | 64% | - | - | 3%[lower-alpha 458] | 3% |
| SurveyMonkey/Axios | Sep 1–30, 2020 | 2,655 (LV) | – | 32% | 66% | - | - | – | 2% |
| SurveyMonkey/Axios | Aug 1–31, 2020 | 2,286 (LV) | – | 29% | 69% | - | - | – | 2% |
| Emerson College/WHDH | Aug 25–27, 2020 | 763 (LV) | ± 3.5% | 31% | 69% | - | - | – | – |
| MassINC/WBUR | Aug 6–9, 2020 | 501 (LV) | ± 4.4% | 27% | 63% | - | - | 5%[lower-alpha 459] | 4% |
| UMass/YouGov | Jul 31 – Aug 7, 2020 | 500 (RV) | ± 5.9% | 28% | 61% | - | - | – | – |
| SurveyMonkey/Axios | Jul 1–31, 2020 | 2,509 (LV) | – | 26% | 72% | - | - | – | 2% |
| MassINC | Jul 17–20, 2020 | 797 (RV) | – | 23% | 55% | - | - | 10%[lower-alpha 460] | 12% |
| SurveyMonkey/Axios | Jun 8–30, 2020 | 1,091 (LV) | – | 27% | 71% | - | - | – | 2% |
| Emerson College/7 News | May 4–5, 2020 | 740 (RV) | ± 3.5% | 33%[lower-alpha 461] | 67% | - | - | – | – |
| University of Massachusetts Lowell/YouGov | Apr 27 – May 1, 2020 | 1,000 (RV) | ± 3.6% | 30% | 58% | - | - | 7%[lower-alpha 462] | 4% |
| Emerson College | Apr 4–7, 2019 | 761 (RV) | ± 3.5% | 31% | 69% | - | - | – | – |
Michigan
Graphical summary
Aggregate polls
| Source of poll aggregation |
Dates administered |
Dates updated |
Joe Biden Democratic |
Donald Trump Republican |
Other/ Undecided [lower-alpha 1] |
Margin |
|---|---|---|---|---|---|---|
| 270 to Win | October 22 – November 2, 2020 | November 3, 2020 | 49.9% | 44.4% | 5.7% | Biden +5.5 |
| Real Clear Politics | October 29 – November 1, 2020 | November 3, 2020 | 50.0% | 45.8% | 4.2% | Biden +4.2 |
| FiveThirtyEight | until November 1, 2020 | November 3, 2020 | 51.2% | 43.2% | 5.6% | Biden +7.9 |
| Average | 50.4% | 44.5% | 5.1% | Biden +5.9 | ||
2020 polls
| Poll source | Date(s) administered |
Sample size[lower-alpha 2] |
Margin of error |
Donald Trump Republican |
Joe Biden Democratic |
Jo Jorgensen Libertarian |
Howie Hawkins Green |
Other | Undecided |
|---|---|---|---|---|---|---|---|---|---|
| SurveyMonkey/Axios | Oct 20 – Nov 2 | 4,549 (LV) | ± 2% | 46%[lower-alpha 463] | 52% | - | - | – | – |
| Research Co. | Oct 31 – Nov 1 | 450 (LV) | ± 4.6% | 43% | 50% | - | - | 2%[lower-alpha 464] | 5% |
| Change Research/CNBC | Oct 29 – Nov 1 | 383 (LV) | ± 5.01% | 44% | 51% | 3% | 1% | – | 1% |
| Swayable | Oct 27 – Nov 1 | 413 (LV) | ± 6.5% | 45% | 54% | 1% | 0% | – | – |
| Ipsos/Reuters | Oct 27 – Nov 1 | 654 (LV) | ± 4.4% | 43%[lower-alpha 14] | 53% | 1% | 0% | 2%[lower-alpha 465] | – |
| 42%[lower-alpha 466] | 52% | - | - | 3%[lower-alpha 467] | 3% | ||||
| 45%[lower-alpha 468] | 53% | - | - | 2%[lower-alpha 469] | – | ||||
| Trafalgar Group | Oct 30–31 | 1,033 (LV) | ± 2.97% | 48% | 46% | 2% | - | 1% | 3% |
| AtlasIntel | Oct 30–31 | 686 (LV) | ± 4% | 46% | 48% | - | - | 6% | – |
| Insider Advantage/Center for American Greatness[upper-alpha 8] | Oct 30–31 | 500 (LV) | ± 4.4% | 47% | 49% | 2% | - | – | 3% |
| Morning Consult | Oct 22–31 | 1,736 (LV) | ± 2.0% | 44.5% | 52% | - | - | – | – |
| Emerson College | Oct 29–30 | 700 (LV) | ± 3.4% | 45%[lower-alpha 470] | 52% | - | - | 3%[lower-alpha 471] | – |
| Public Policy Polling/Progress Michigan[upper-alpha 50] | Oct 29–30 | 745 (V) | ± 3.6% | 44% | 54% | 1% | 0% | – | 1% |
| Targoz Market Research/PollSmart | Oct 25–30 | 993 (LV) | – | 39% | 53% | - | - | 8%[lower-alpha 472] | – |
| CNN/SSRS | Oct 23–30 | 907 (LV) | ± 3.8% | 41% | 53% | 2% | 1% | 1%[lower-alpha 473] | 2% |
| Mitchell Research (R)/MIRS | Oct 29 | 817 (LV) | ± 3.43% | 45% | 52% | 1% | 1% | 0%[lower-alpha 474] | 0% |
| RMG Research/PoliticalIQ | Oct 27–29 | 800 (LV) | ± 3.5% | 44%[lower-alpha 14] | 51% | - | - | 3% | 2% |
| 42%[lower-alpha 475] | 53% | - | - | 3% | 2% | ||||
| 45%[lower-alpha 476] | 50% | - | - | 3% | 2% | ||||
| Redfield & Wilton Strategies | Oct 26–29 | 1,212 (LV) | – | 41% | 54% | 1% | 0% | 1% | 4% |
| EPIC-MRA | Oct 25–28 | 600 (LV) | ± 4% | 41% | 48% | - | - | 5%[lower-alpha 477] | 6%[lower-alpha 478] |
| Trafalgar Group | Oct 25–28 | 1,058 (LV) | ± 2.93% | 49% | 47% | 2% | - | 1%[lower-alpha 479] | 1% |
| Kiaer Research | Oct 21–28 | 669 (LV) | ± 5.6% | 41% | 54% | - | - | 2%[lower-alpha 480] | 4% |
| SurveyMonkey/Axios | Oct 1–28, 2020 | 7,541 (LV) | – | 45% | 53% | - | - | – | – |
| Mitchell Research (R)/MIRS | Oct 25–27 | 759 (LV) | ± 3.56% | 42% | 52% | 3% | 0% | 0%[lower-alpha 481] | 2% |
| Swayable | Oct 23–26, 2020 | 394 (LV) | ± 6.7% | 40% | 59% | 2% | 0% | – | – |
| Siena College/NYT Upshot | Oct 23–26 | 856 (LV) | ± 3.8% | 41% | 49% | 2% | 1% | 0%[lower-alpha 482] | 6%[lower-alpha 483] |
| Ipsos/Reuters | Oct 20–26 | 652 (LV) | ± 4.4% | 43%[lower-alpha 14] | 53% | 1% | 0% | 2%[lower-alpha 484] | – |
| 43%[lower-alpha 485] | 52% | - | - | 3%[lower-alpha 486] | 3% | ||||
| Wick Surveys | Oct 24–25 | 1,000 (LV) | ± 3.1% | 48% | 48% | - | - | – | – |
| Glengariff Group/Detroit News | Oct 23–25 | 600 (LV) | ± 4% | 42% | 49% | - | - | 2%[lower-alpha 487] | 4% |
| ABC/Washington Post | Oct 20–25 | 789 (LV) | ± 4% | 44% | 51% | 3% | 0% | 0%[lower-alpha 488] | 1% |
| Gravis Marketing | Oct 24 | 679 (LV) | ± 3.8% | 42% | 55% | - | - | – | 3% |
| Public Policy Polling/American Bridge PAC[upper-alpha 51] | Oct 21–22 | 804 (V) | – | 43% | 50% | - | - | – | 6% |
| YouGov/University of Wisconsin-Madison | Oct 13–21 | 681 (LV) | ± 4.2% | 42% | 52% | - | - | 5%[lower-alpha 489] | – |
| Citizen Data | Oct 17–20 | 1,000 (LV) | ± 3.1% | 41% | 50% | 1% | 0% | 1% | 7% |
| Fox News | Oct 17–20 | 1,032 (LV) | ± 3.0% | 40% | 52% | 3% | 0% | 2%[lower-alpha 490] | 3% |
| Ipsos/Reuters | Oct 14–20 | 686 (LV) | ± 4.3% | 44%[lower-alpha 14] | 52% | 2% | 0% | 2%[lower-alpha 491] | – |
| 44%[lower-alpha 492] | 51% | - | - | 3%[lower-alpha 493] | 2% | ||||
| Morning Consult | Oct 11–20 | 1,717 (LV) | ± 2.4% | 44% | 52% | - | - | – | – |
| Change Research/CNBC | Oct 16–19 | 718 (LV)[lower-alpha 41] | – | 44% | 51% | - | - | – | – |
| EPIC-MRA | Oct 15–19 | 600 (LV) | ± 4% | 39% | 48% | - | - | 5%[lower-alpha 494] | 8%[lower-alpha 495] |
| Mitchell Research (R)/MIRS | Oct 18 | 900 (LV) | ± 3.27% | 41% | 51% | 3% | 1% | 1%[lower-alpha 496] | 3% |
| Trafalgar Group/Restoration PAC[upper-alpha 52] | Oct 15–18 | 1,034 (LV) | ± 2.97% | 47% | 45% | 3% | 2% | 2%[lower-alpha 497] | 2% |
| Data For Progress | Oct 15–18 | 830 (LV) | ± 3.4% | 45% | 50% | 2% | 0% | – | 3% |
| Zia Poll/Painter Communications/MIRS News | Oct 11–18 | 2,851 (LV) | ± 2.5% | 49% | 45% | - | - | 2% | 3% |
| HarrisX/The Hill | Oct 12–15 | 1,289 (LV) | – | 43% | 54% | - | - | – | – |
| Trafalgar Group | Oct 11–14 | 1,025 (LV) | ± 2.97% | 47% | 46% | 3% | 2% | 2%[lower-alpha 498] | 2% |
| Redfield & Wilton Strategies | Oct 10–13 | 972 (LV) | – | 42%[lower-alpha 41] | 51% | 1% | 0% | – | – |
| RMG Research/PoliticalIQ | Oct 8–13 | 800 (LV) | – | 42%[lower-alpha 14] | 48% | 2% | 1% | 1% | 5% |
| 39%[lower-alpha 499] | 51% | 2% | 1% | 1% | 5% | ||||
| 44%[lower-alpha 500] | 46% | 2% | 1% | 1% | 5% | ||||
| Ipsos/Reuters | Oct 7–13 | 620 (LV) | ± 4.5% | 44%[lower-alpha 14] | 51% | 2% | 1% | 2%[lower-alpha 501] | – |
| 43%[lower-alpha 502] | 51% | - | - | 3%[lower-alpha 503] | 2% | ||||
| EPIC-MRA/Detroit Free Press | Oct 8–12 | 600 (LV) | ± 4% | 39% | 48% | - | - | 4%[lower-alpha 504] | 9%[lower-alpha 505] |
| Civiqs/Rust Belt Rising[upper-alpha 53] | Oct 8–11 | 543 (LV) | ± 4.6% | 43% | 52% | - | - | 4%[lower-alpha 506] | 2% |
| Siena College/NYT Upshot | Oct 6–11 | 614 (LV) | ± 4.6% | 40% | 48% | 1% | 1% | 1%[lower-alpha 507] | 8%[lower-alpha 508] |
| Morning Consult | Oct 2–11 | 1,710 (LV) | ± 2.4% | 44% | 51% | - | - | – | – |
| Redfield & Wilton Strategies | Oct 9–10 | 827 (LV) | – | 41%[lower-alpha 41] | 51% | 2% | 1% | – | – |
| YouGov/CBS | Oct 6–9 | 1,190 (LV) | ± 3.3% | 46% | 52% | - | - | 2%[lower-alpha 509] | 0% |
| Baldwin Wallace University | Sep 30 – Oct 8 | 1,134 (LV) | ± 3.2% | 43% | 50% | 1% | 1% | 0%[lower-alpha 510] | 4% |
| Emerson College | Oct 6–7 | 716 (LV) | ± 3.6% | 43%[lower-alpha 511] | 54% | - | - | 2%[lower-alpha 512] | – |
| Redfield & Wilton Strategies | Oct 4–6 | 700 (LV) | ± 3.7% | 42% | 50% | 1% | 0% | 1%[lower-alpha 513] | 6% |
| Opinion Insight/American Action Forum[upper-alpha 10] | Oct 3–6 | 800 (LV) | ± 3.46% | 44%[lower-alpha 514] | 52% | - | - | 2% | 3% |
| Ipsos/Reuters | Sep 29 – Oct 6 | 709 (LV) | ± 4.2% | 43% | 51% | - | - | 2%[lower-alpha 515] | 3% |
| Change Research/CNBC | Oct 2–4 | 676 (LV) | – | 43% | 51% | - | - | – | – |
| Glengariff Group/Detroit News | Sep 30 – Oct 3 | 600 (LV) | ± 4% | 39% | 48% | - | - | 5%[lower-alpha 516] | 7% |
| Public Policy Polling/Progress Michigan[upper-alpha 50] | Sep 30 – Oct 1 | 746 (V) | – | 44% | 50% | 2% | 1% | – | 3% |
| SurveyMonkey/Axios | Sep 1–30 | 3,297 (LV) | – | 44% | 53% | - | - | – | 3% |
| Trafalgar Group/Restoration PAC[upper-alpha 52] | Sep 26–28 | 1,042 (LV) | ± 2.95% | 47% | 49% | 2% | 0% | 1%[lower-alpha 517] | 2% |
| Redfield & Wilton Strategies | Sep 23–26 | 785 (LV) | ± 3.5% | 42% | 51% | 1% | 0% | 0%[lower-alpha 518] | 6% |
| Marist College/NBC | Sep 19–23 | 799 (LV) | ± 4.3% | 44% | 52% | - | - | 1% | 3% |
| ALG Research/Committee to Protect Medicare[upper-alpha 54] | Sep 17–23 | 800 (LV) | ± 3.5% | 44% | 52% | - | - | – | – |
| Trafalgar Group | Sep 20–22 | 1,015 (LV) | ± 2.99% | 46.7% | 46.0% | 2.1% | 0.8% | 1.2%[lower-alpha 519] | 3.2% |
| Baldwin Wallace University | Sep 9–22 | 1,001 (LV) | ± 3.6% | 42% | 50% | 1% | 0% | 1%[lower-alpha 520] | 6% |
| YouGov/UW-Madison Elections Research Center/Wisconsin State Journal |
Sep 10–21 | 641 (LV) | – | 45% | 51% | - | - | – | – |
| Change Research/CNBC | Sep 18–20 | 568 (LV) | – | 43% | 51% | - | - | – | – |
| Hart Research Associates/Human Rights Campaign[upper-alpha 55] | Sep 17–19 | 400 (LV) | ± 4.9% | 45% | 50% | - | - | – | – |
| Data for Progress (D) | Sep 14–19 | 455 (LV) | ± 4.6% | 42%[lower-alpha 14] | 48% | 1% | 0% | – | 9% |
| 44%[lower-alpha 521] | 50% | - | - | – | 6% | ||||
| MRG | Sep 14–19 | 600 (LV) | ± 4% | 41% | 46% | - | - | 8%[lower-alpha 522] | 5% |
| Ipsos/Reuters | Sep 11–16 | 637 (LV) | ± 4.4% | 44% | 49% | - | - | 2%[lower-alpha 523] | 4% |
| Civiqs/Rust Belt Rising[upper-alpha 53] | Sep 11–15 | 517 (RV) | – | 42% | 53% | - | - | 3%[lower-alpha 524] | 1% |
| Redfield & Wilton Strategies | Sep 12–14 | 930 (LV) | ± 3.21% | 39% | 49% | 2% | 1% | 0%[lower-alpha 525] | 9% |
| EPIC-MRA | Sep 10–15 | 600 (LV) | ± 4% | 40% | 48% | - | - | 5%[lower-alpha 526] | 7%[lower-alpha 527] |
| Benenson Strategy Group/GS Strategy Group/AARP | Aug 28 – Sep 8 | 1,600 (LV) | ± 2.5% | 43% | 50% | - | - | 1%[lower-alpha 528] | 5% |
| Morning Consult | Aug 29 – Sep 7 | 1,455 (LV) | ± (2%–4%) | 42%[lower-alpha 529] | 52% | - | - | – | – |
| Change Research/CNBC | Sep 4–6 | 876 (LV) | – | 43% | 49% | - | - | 7%[lower-alpha 530] | – |
| Pulse Opinion Research/Rasmussen Reports | Sep 2–3 | 1,000 (LV) | ± 3% | 44%[lower-alpha 531] | 53% | - | - | 3%[lower-alpha 532] | – |
| Glengariff Group | Sep 1–3 | 600 (LV) | ± 4% | 42% | 47% | - | - | 4%[lower-alpha 533] | 7% |
| Redfield & Wilton Strategies | Aug 30 – Sep 3 | 967 (LV) | ± 3.15% | 40% | 51% | 1% | 0% | 1%[lower-alpha 534] | 7% |
| Opinion Insight/American Action Forum[upper-alpha 10] | Aug 30 – Sep 2 | 802 (LV) | ± 3.46% | 44%[lower-alpha 535] | 51% | 2% | 1% | 0%[lower-alpha 536] | 3% |
| SurveyMonkey/Axios | Aug 1–31 | 2,962 (LV) | – | 48% | 49% | - | - | – | 3% |
| Morning Consult | Aug 21–30 | 1,424 (LV) | ± (2%–4%) | 42% | 52% | - | - | – | – |
| Public Policy Polling/Progress Michigan[upper-alpha 50] | Aug 28–29 | 897 (V) | – | 44% | 48% | 3% | 1% | – | 3% |
| Change Research/CNBC | Aug 21–23 | 809 (LV) | – | 44% | 50% | - | - | – | – |
| Trafalgar Group | Aug 14–23 | 1,048 (LV) | ± 2.98% | 47% | 45% | 3% | - | 1%[lower-alpha 537] | 4% |
| Redfield and Wilton Strategies | Aug 16–19 | 812 (LV) | – | 38% | 50% | 1% | 1% | 1%[lower-alpha 538] | 9% |
| Civiqs/Rust Belt Rising[upper-alpha 53] | Aug 13–17 | 631 (RV) | – | 46% | 49% | - | - | 3%[lower-alpha 539] | 1% |
| Morning Consult | Aug 7–16 | 1,212 (LV) | ± (2%–4%) | 44% | 50% | - | - | – | – |
| Hodas & Associates/Restoration PAC[upper-alpha 52] | Aug 11–15 | 600 (LV) | – | 41% | 52% | - | - | – | 7% |
| Change Research/CNBC | Aug 7–9 | 413 (LV) | – | 43% | 48% | - | - | – | – |
| YouGov/University of Wisconsin-Madison | Jul 27 – Aug 6 | 761 (RV) | ± 5.1% | 43% | 47% | - | - | 5%[lower-alpha 540] | 6% |
| GQR Research/Unite the Country PAC[upper-alpha 56] | Jul 30 – Aug 4 | 1,245 (LV) | – | 43% | 52% | - | - | – | – |
| David Binder Research | Jul 30–31 | 200 (LV) | – | 41% | 51% | - | - | – | – |
| SurveyMonkey/Axios | Jul 1–31 | 3,083 (LV) | – | 48% | 49% | - | - | – | 2% |
| EPIC-MRA | Jul 25–30 | 600 (LV) | ± 4.0% | 40% | 51% | 3% | - | - | 6% |
| Public Policy Polling/Progress Michigan[upper-alpha 50] | Jul 28–29 | 876 (V) | – | 43% | 49% | - | - | 6%[lower-alpha 541] | 3% |
| Change Research/CNBC | Jul 24–26 | 413 (LV) | – | 42% | 46% | - | - | – | – |
| Morning Consult | Jul 17–26 | 1,320 (LV) | ± 2.7% | 42% | 52% | - | - | – | – |
| YouGov/CBS | Jul 21–24 | 1,156 (LV) | ± 3.4% | 42% | 48% | - | - | 2%[lower-alpha 542] | 7% |
| Redfield & Wilton Strategies | Jul 19–24 | 811 (LV) | – | 37% | 49% | 1% | 1% | 2%[lower-alpha 543] | 10% |
| CNN/SSRS | Jul 18–24 | 927 (RV) | ± 3.8% | 40% | 52% | - | - | 5%[lower-alpha 544] | 2% |
| Gravis Marketing | Jul 22 | 754 (RV) | ± 3.6% | 42% | 51% | - | - | – | 7% |
| Fox News | Jul 18–20 | 756 (RV) | ± 3.5% | 40% | 49% | - | - | 4%[lower-alpha 545] | 7% |
| Hodas & Associates/Restoration PAC[upper-alpha 52] | Jul 13–16 | 600 (LV) | ± 4.0% | 41% | 53% | - | - | – | 7% |
| Spry Strategies/American Principles Project[upper-alpha 57] | Jul 11–16 | 600 (LV) | ± 3.7% | 50% | 45% | - | - | – | 5% |
| Change Research/CNBC | Jul 10–12 | 824 (LV) | – | 42% | 48% | - | - | – | – |
| Public Policy Polling/Giffords (D)[upper-alpha 58] | Jul 9–10 | 1,041 (V) | ± 3.2% | 44% | 51% | - | - | – | 5% |
| SurveyMonkey/Axios | Jun 8–30 | 1,238 (LV) | – | 46% | 51% | - | - | – | 3% |
| Change Research/CNBC | Jun 26–28 | 699 (LV)[lower-alpha 41] | – | 43% | 48% | - | - | – | – |
| Public Policy Polling/Progress Michigan (D)[upper-alpha 50] | Jun 26–27 | 1,237 (V) | – | 44% | 50% | - | - | 5%[lower-alpha 546] | 1% |
| Hodas & Associates/Restoration PAC (R) | Jun 17–20 | 600 (LV) | ± 4.0% | 38% | 56% | - | - | 2%[lower-alpha 547] | 7% |
| Trafalgar Group | Jun 16–18 | 1,101 (LV) | ± 2.95% | 45% | 46% | - | - | 5%[lower-alpha 548] | 4% |
| NYT Upshot/Siena College | Jun 8–17 | 610 (RV) | ± 4.3% | 36% | 47% | - | - | 8%[lower-alpha 549] | 9% |
| Redfield & Wilton Strategies | Jun 14–16 | 826 (LV) | ± 3.41% | 36% | 47% | 2% | 1% | 2%[lower-alpha 550] | 12% |
| TargetPoint | Jun 11–16 | 1,000 (A) | – | 33% | 49% | - | - | 4%[lower-alpha 551] | 14% |
| Change Research/CNBC | Jun 12–14 | 353 (LV)[lower-alpha 41] | – | 45% | 47% | - | - | 3%[lower-alpha 552] | – |
| TIPP/American Greatness PAC[upper-alpha 8] | Jun 9–12 | 859 (LV) | – | 38% | 51% | - | - | 4%[lower-alpha 553] | 7% |
| Kiaer Research | May 31 – Jun 7 | 543 (LV) | ± 6.4% | 35% | 50% | - | - | 6%[lower-alpha 554] | 8% |
| EPIC-MRA | May 31 – Jun 4 | 600 (LV) | ± 4% | 39% | 55% | - | - | – | – |
| EPIC-MRA | May 30 – Jun 3 | 600 (LV) | ± 4% | 41% | 53% | - | - | – | 6%[lower-alpha 555] |
| Change Research/CNBC | May 29–31 | 620 (LV)[lower-alpha 41] | – | 46% | 48% | - | - | 3% | 3% |
| Public Policy Polling/Progress Michigan[upper-alpha 50] | May 29–30 | 1,582 (V) | ± 2.5% | 44% | 50% | - | - | 4%[lower-alpha 556] | 2% |
| Morning Consult | May 17–26 | 1,325 (LV) | – | 42% | 50% | - | - | – | – |
| Public Policy Polling/Protect Our Care[upper-alpha 59] | May 18–19 | 1,234 (V) | ± 2.8% | 45% | 51% | - | - | – | 5% |
| Change Research/Crooked Media | May 11–17 | 3,070 (LV) | – | 46% | 49% | - | - | – | – |
| Redfield & Wilton Strategies | May 10–14 | 970 (LV) | ± 3.2% | 39% | 47% | - | - | 3%[lower-alpha 557] | 11% |
| Hodas & Associates/Restoration PAC (R) | May 1–5 | 600 (LV) | ± 3% | 42% | 50% | - | - | – | 8% |
| Public Policy Polling[upper-alpha 60] | Apr 28–29 | 1,270 (V) | – | 42% | 50% | - | - | – | 8% |
| Public Policy Polling[upper-alpha 61] | Apr 20–21 | 1,277 (RV) | – | 44% | 51% | - | - | – | 5% |
| Fox News | Apr 18–21 | 801 (RV) | ± 3.5% | 41% | 49% | - | - | 3% | 6% |
| Ipsos/Reuters | Apr 15–20 | 612 (RV) | ± 5.0% | 38% | 46% | - | - | – | – |
| Hodas & Associates/Restoration PAC (R) | Apr 9–11 | 600 (RV) | ± 3.0% | 43% | 49% | - | - | – | – |
| Hart Research/CAP Action[upper-alpha 62] | Apr 6–8 | 303 (RV) | – | 41% | 50% | - | - | 4% | 5% |
| Public Policy Polling | Mar 31 – Apr 1 | 1,019 (RV) | ± 3.1% | 45% | 48% | - | - | – | 7% |
| SPRY Strategies | Mar 30 – Apr 1 | 602 (LV) | ± 4.0% | 46% | 46% | - | - | – | 8% |
| Baldwin Wallace University Great Lakes | Mar 17–25 | 997 (RV) | ± 3.7% | 42% | 47% | - | - | – | 11% |
| Change Research | Mar 21–23 | 510 (LV) | – | 47% | 48% | - | - | 5% | |
| Marketing Resource Group | Mar 16–20 | 600 (LV) | ± 4.0% | 41% | 44% | - | - | 9%[lower-alpha 558] | 6% |
| Hodas & Associates/Restoration PAC (R) | Mar 12–16 | 600 (RV) | – | 44% | 50% | - | - | – | – |
| AtlasIntel | Mar 7–9 | 1,100 (RV) | ± 3.0% | 46% | 44% | - | - | 10% | – |
| YouGov/Yahoo News | Mar 6–8 | 566 (RV) | – | 41% | 45% | - | - | 6%[lower-alpha 559] | 7% |
| Monmouth University | Mar 5–8 | 977 (RV) | ± 3.1% | 41% | 48% | - | - | 2% | 9% |
| Firehouse Strategies/Øptimus | Mar 5–7 | 550 (RV) | ± 5.3% | 46% | 44% | - | - | – | – |
| YouGov | Feb 11–20 | 1,249 (RV) | ± 4.0% | 43% | 47% | - | - | – | – |
| Quinnipiac University | Feb 12–18 | 845 (RV) | ± 3.4% | 43% | 47% | - | - | 6%[lower-alpha 560] | 3% |
| Expedition Strategies/Progressive Policies Institute | Feb 6–18 | 500 (RV) | – | 43% | 43% | - | - | – | 14% |
| EPIC-MRA/Detroit Free Press | Jan 9–12 | 600 (LV) | ± 4% | 44% | 50% | - | - | – | 6% |
| Glengariff Group Inc. | Jan 3–7 | 600 (LV) | ± 4% | 43% | 50% | - | - | – | 5% |
2017–2019 polls
| Poll source | Date(s) administered |
Sample size[lower-alpha 2] |
Margin of error |
Donald Trump Republican |
Joe Biden Democratic |
Other | Undecided |
|---|---|---|---|---|---|---|---|
| Firehouse Strategies/Øptimus | Dec 3–5, 2019 | 551 (LV) | ± 4.3% | 46% | 41% | 8% [lower-alpha 561] | 5% [lower-alpha 562] |
| Emerson College | Oct 31 – Nov 3, 2019 | 1,051 (RV) | ± 3.0% | 44% | 56% | – | – |
| NYT Upshot/Siena College | Oct 13–25, 2019 | 501 (LV) | ± 5.1% | 44% | 45% | – | – |
| Target Insyght | Sep 24–26, 2019 | 800 (LV) | – | 35% | 54% | – | – |
| Firehouse Strategies/Øptimus | Sep 7–9, 2019 | 529 (LV) | ± 4.0% | 41% | 42% | 17% | – |
| EPIC-MRA | Aug 17–21, 2019 | 600 (LV) | ± 4.0% | 41% | 51% | – | 8% |
| Climate Nexus | Jul 14–17, 2019 | 820 (RV) | ± 4.0% | 36% | 49% | 5%[lower-alpha 563] | 10% |
| Firehouse Strategies/Øptimus | Jun 11–13, 2019 | 587 (LV) | ± 4.2% | 43% | 46% | 11% | – |
| EPIC-MRA | Jun 8–12, 2019 | 600 (LV) | ± 4.0% | 41% | 52% | – | 7% |
| Glengariff Group | May 28–30, 2019 | 600 (LV) | ± 4.0% | 41% | 53% | – | 4% |
| WPA Intelligence | Apr 27–30, 2019 | 200 (LV) | ± 6.9% | 42% | 45% | – | 12% |
| Firehouse Strategies/Øptimus | Mar 19–21, 2019 | 530 (LV) | ± 4.5% | 46% | 45% | 4% | – |
| Emerson College | Mar 7–10, 2019 | 743 (RV) | ± 3.5% | 46% | 54% | – | – |
| Glengariff Group | Jan 24–26, 2019 | 600 (LV) | ± 4.0% | 40% | 53% | – | 5% |
| EPIC-MRA | Apr 28–30, 2018 | 600 (LV) | ± 4.0% | 39% | 52% | – | 9% |
| Zogby Analytics | Sep 2017 | 800 (V) | – | 35% | 52% | – | 13% |
Minnesota
- Graphical summary
Aggregate polls
| Source of poll aggregation |
Dates administered |
Dates updated |
Joe Biden Democratic |
Donald Trump Republican |
Other/ Undecided [lower-alpha 1] |
Margin |
|---|---|---|---|---|---|---|
| 270 to Win | October 11–30, 2020 | November 1, 2020 | 50.6% | 42.2% | 7.2% | Biden +8.4 |
| Real Clear Politics | October 15–27, 2020 | November 1, 2020 | 48.0% | 43.7% | 8.3% | Biden +4.3 |
| FiveThirtyEight | until October 31, 2020 | November 1, 2020 | 51.7% | 42.6% | 5.7% | Biden +9.1 |
| Average | 50.1% | 42.8% | 7.1% | Biden +7.3 | ||
- Polls
| Poll source | Date(s) administered |
Sample size[lower-alpha 2] |
Margin of error |
Donald Trump Republican |
Joe Biden Democratic |
Jo Jorgensen Libertarian |
Howie Hawkins Green |
Other | Undecided |
|---|---|---|---|---|---|---|---|---|---|
| SurveyMonkey/Axios | Oct 20 – Nov 2, 2020 | 3,031 (LV) | ± 2.5% | 41%[lower-alpha 564] | 56% | - | - | – | – |
| Research Co. | Oct 31 – Nov 1, 2020 | 450 (LV) | ± 4.6% | 45% | 54% | - | - | 1%[lower-alpha 565] | 4% |
| Data for Progress | Oct 27 – Nov 1, 2020 | 1,259 (LV) | ± 2.8% | 43% | 51% | 4% | 2% | 1%[lower-alpha 566] | – |
| Swayable | Oct 23 – Nov 1, 2020 | 466 (LV) | ± 5.9% | 43% | 53% | 4% | 0% | – | – |
| Morning Consult | Oct 22–31, 2020 | 883 (LV) | ± 3.0% | 42% | 52% | - | - | – | – |
| Public Policy Polling | Oct 29–30, 2020 | 770 (V) | – | 43% | 54% | - | - | 2%[lower-alpha 567] | 1% |
| Targoz Market Research/PollSmart | Oct 25–30, 2020 | 1,138 (LV) | – | 44% | 53% | - | - | 3%[lower-alpha 568] | – |
| St. Cloud State University | Oct 10–29, 2020 | 372 (A) | ± 6.7% | 39% | 54% | - | - | – | – |
| SurveyMonkey/Axios | Oct 1–28, 2020 | 5,498 (LV) | – | 42% | 55% | - | - | – | – |
| SurveyUSA/KSTP/ABC6 News | Oct 23–27, 2020 | 649 (LV) | ± 4.3% | 42% | 47% | - | - | 5%[lower-alpha 569] | 6% |
| Gravis Marketing | Oct 24–26, 2020 | 657 (LV) | ± 3.8% | 39% | 53% | - | - | – | 8% |
| Trafalgar Group | Oct 24–25, 2020 | 1,065 (LV) | ± 2.92% | 45% | 48% | 2% | - | 4%[lower-alpha 570] | 1% |
| Civiqs/Daily Kos | Oct 17–20, 2020 | 840 (LV) | ± 3.6% | 43% | 53% | - | - | 3%[lower-alpha 571] | 1% |
| SurveyUSA/KSTP | Oct 16–20, 2020 | 625 (LV) | ± 5% | 42% | 48% | - | - | – | – |
| Morning Consult | Oct 11–20, 2020 | 864 (LV) | ± 3.3% | 42% | 51% | - | - | – | – |
| Change Research/MinnPost | Oct 12–15, 2020[lower-alpha 572] | 1,021 (LV) | ± 3.1% | 44% | 49% | 2% | 0% | 2%[lower-alpha 573] | 2% |
| David Binder Research/Focus on Rural America | Oct 10–13, 2020 | 200 (LV) | – | 41% | 52% | - | - | – | – |
| Morning Consult | Oct 2–11, 2020 | 898 (LV) | ± 3.3% | 44% | 50% | - | - | – | – |
| SurveyUSA/ABC6 News | Oct 1–6, 2020 | 929 (LV) | ± 3.9% | 40% | 47% | - | - | 3%[lower-alpha 574] | 10% |
| SurveyMonkey/Axios | Sep 1–30, 2020 | 2,808 (LV) | – | 43% | 55% | - | - | – | 2% |
| Suffolk University | Sep 20–24, 2020 | 500 (LV) | ± 4.4% | 40% | 47% | 2% | 0% | 4%[lower-alpha 575] | 6% |
| Mason-Dixon/StarTribune /MPR News/KARE 11 |
Sep 21–23, 2020 | 800 (LV) | ± 3.5% | 42% | 48% | - | - | 2% | 8% |
| Redfield & Wilton Strategies | Sep 12–17, 2020 | 718 (LV) | ± 3.66% | 42% | 51% | 0% | 0% | 1%[lower-alpha 576] | 5% |
| ABC/Washington Post | Sep 8–13, 2020 | 615 (LV) | ± 4.5% | 41% | 57% | - | - | 1%[lower-alpha 577] | 1% |
| Morning Consult | Sep 4–13, 2020 | 643 (LV) | ± 4% | 44%[lower-alpha 578] | 48% | - | - | 2%[lower-alpha 579] | 6% |
| YouGov/CBS | Sep 9–11, 2020 | 1,087 (LV) | ± 3.9% | 41% | 50% | - | - | 2%[lower-alpha 580] | 6% |
| Siena College/NYT Upshot | Sep 8–10, 2020 | 814 (LV) | ± 3.9% | 41% | 50% | 2% | 1% | 0%[lower-alpha 581] | 5%[lower-alpha 582] |
| SurveyUSA | Sep 4–7, 2020 | 553 (LV) | ± 5.2% | 40% | 49% | - | - | 4%[lower-alpha 583] | 7% |
| Morning Consult | Aug 29 – Sep 7, 2020 | 649 (LV) | ± (2%–4%) | 44%[lower-alpha 584] | 49% | - | - | – | – |
| PPP | Sep 3–4, 2020 | 877 (V) | ± 3.3% | 44% | 52% | - | - | 3%[lower-alpha 585] | 1% |
| Harper Polling/Jason Lewis[upper-alpha 63] | Aug 30 – Sep 1, 2020 | 501 (LV) | ± 4.38% | 45% | 48% | – | – | – | 4% |
| SurveyMonkey/Axios | Aug 1–31, 2020 | 1,939 (LV) | – | 43% | 56% | - | - | – | 1% |
| Morning Consult | Aug 21–30, 2020 | 647 (LV) | ± (2%–4%) | 43% | 50% | - | - | – | – |
| Trafalgar Group | Aug 15–18, 2020 | 1,141 (LV) | ± 3.0% | 47% | 47% | 4% | - | 1%[lower-alpha 586] | 2% |
| Morning Consult | Aug 7–16, 2020 | 615 (LV) | ± (2%–4%) | 42% | 50% | - | - | – | – |
| Emerson College | Aug 8–10, 2020 | 733 (LV) | ± 3.6% | 49%[lower-alpha 587] | 51% | - | - | – | – |
| David Binder Research | Jul 30–31, 2020 | 200 (LV) | – | 36% | 54% | - | - | – | – |
| SurveyMonkey/Axios | Jul 1–31, 2020 | 2,288 (LV) | – | 47% | 51% | - | - | – | 2% |
| Morning Consult | Jul 17–26, 2020 | 662 (LV) | ± 3.8% | 44% | 47% | - | - | – | – |
| Trafalgar Group | Jul 23–25, 2020 | 1,129 (LV) | ± 2.8% | 44% | 49% | 2% | - | 3%[lower-alpha 588] | 2% |
| Public Policy Polling/Giffords[upper-alpha 64] | Jul 22–23, 2020 | 1,218 (V) | ± 3.2% | 42% | 52% | - | - | – | 6% |
| FOX News | Jul 18–20, 2020 | 776 (RV) | ± 3.5% | 38% | 51% | - | - | 6%[lower-alpha 589] | 6% |
| SurveyMonkey/Axios | Jun 8–30, 2020 | 860 (LV) | – | 42% | 57% | - | - | – | 1% |
| Gravis Marketing | Jun 19, 2020 | 600 (RV) | ± 4.0% | 42%[lower-alpha 590] | 58%[lower-alpha 591] | - | - | – | – |
| Morning Consult | May 27– Jun 5, 2020 | 600 (LV) | ± 4% | 45% | 48% | - | - | – | – |
| Harper Polling/Jason Lewis[upper-alpha 63] | May 26–28, 2020 | 510 (LV) | – | 42% | 50% | – | – | – | 8% |
| Morning Consult | May 17–26, 2020 | 647 (LV) | – | 42% | 49% | - | - | – | – |
| Mason-Dixon/StarTribune /MPR News/KARE 11 |
May 18–20, 2020 | 800 (RV) | ± 3.5% | 44% | 49% | - | - | – | 7% |
| Morning Consult | May 7–16, 2020 | 600 (LV) | ± 4% | 38% | 55% | - | - | – | – |
| Mason-Dixon/StarTribune | Oct 14–16, 2019 | 800 (RV) | ± 3.5% | 38% | 50% | - | - | – | 12% |
Mississippi
Graphical summary
Aggregate polls
| Source of poll aggregation |
Dates administered |
Dates updated |
Joe Biden Democratic |
Donald Trump Republican |
Other/ Undecided [lower-alpha 1] |
Margin |
|---|---|---|---|---|---|---|
| 270 to Win | September 20 – October 26, 2020 | October 27, 2020 | 40.0% | 57.0% | 3.0% | Trump +17.0 |
| FiveThirtyEight | until October 26, 2020 | October 27, 2020 | 39.7% | 55.0% | 5.3% | Trump +15.3 |
| Average | 39.9% | 56.0% | 4.1% | Trump +16.1 | ||
Polls
| Poll source | Date(s) administered |
Sample size[lower-alpha 2] |
Margin of error |
Donald Trump Republican |
Joe Biden Democratic |
Jo Jorgensen Libertarian |
Howie Hawkins Green |
Other | Undecided |
|---|---|---|---|---|---|---|---|---|---|
| SurveyMonkey/Axios | Oct 20 – Nov 2, 2020 | 1,461 (LV) | ± 4% | 61%[lower-alpha 592] | 37% | - | - | – | – |
| Data For Progress | Oct 27 – Nov 1, 2020 | 562 (LV) | ± 4.1% | 55% | 41% | 2% | 1% | 1%[lower-alpha 593] | – |
| Civiqs/Daily Kos | Oct 23–26, 2020 | 507 (LV) | ± 5.3% | 55% | 41% | - | - | 3%[lower-alpha 594] | 1% |
| SurveyMonkey/Axios | Oct 1–28, 2020 | 2,116 (LV) | – | 62% | 37% | - | - | – | – |
| SurveyMonkey/Axios | Sep 1–30, 2020 | 782 (LV) | – | 55% | 44% | - | - | – | 1% |
| SurveyMonkey/Axios | Aug 1–31, 2020 | 607 (LV) | – | 61% | 36% | - | - | – | 3% |
| Tyson Group/Consumer Energy Alliance[upper-alpha 2] | Aug 28–30, 2020 | 600 (LV) | ± 4% | 50% | 40% | No voters | - | No voters[lower-alpha 595] | 6% |
| Garin-Hart-Yang Research Group/Mike Espy[upper-alpha 65] | Jul 30 – Aug 9, 2020 | 600 (LV) | ± 4.1% | 53%[lower-alpha 596] | 43% | - | - | – | – |
| SurveyMonkey/Axios | Jul 1–31, 2020 | 733 (LV) | – | 59% | 39% | - | - | – | 2% |
| SurveyMonkey/Axios | Jun 8–30, 2020 | 425 (LV) | – | 63% | 35% | - | - | – | 2% |
| Chism Strategies | Jun 2–4, 2020 | 568 (LV) | ± 4.1% | 50% | 41% | - | - | 6%[lower-alpha 597] | 3% |
| Chism Strategies/Millsaps College | Apr 8–9, 2020 | 508 (RV) | ± 4.4% | 49% | 38% | - | - | 7% | 7% |
| Mason-Dixon | Feb 26–28, 2020 | 625 (RV) | ± 4.0% | 56% | 41% | - | - | – | 3% |
Missouri
- Graphical summary
Aggregate polls
| Source of poll aggregation |
Dates administered |
Dates updated |
Joe Biden Democratic |
Donald Trump Republican |
Other/ Undecided [lower-alpha 1] |
Margin |
|---|---|---|---|---|---|---|
| 270 to Win | September 24 – October 29, 2020 | October 31, 2020 | 44.0% | 51.0% | 5.0% | Trump +7.0 |
| FiveThirtyEight | until October 31, 2020 | November 1, 2020 | 44.1% | 50.2% | 5.1% | Trump +6.7 |
| Average | 44.1% | 50.9% | 5.0% | Trump +6.8 | ||
Polls
| Poll source | Date(s) administered |
Sample size[lower-alpha 2] |
Margin of error |
Donald Trump Republican |
Joe Biden Democratic |
Jo Jorgensen Libertarian |
Howie Hawkins Green |
Other | Undecided |
|---|---|---|---|---|---|---|---|---|---|
| SurveyMonkey/Axios | Oct 20 – Nov 2, 2020 | 2,926 (LV) | ± 2.5% | 54%[lower-alpha 598] | 44% | - | - | – | – |
| Swayable | Oct 23 – Nov 1, 2020 | 487 (LV) | ± 6.6% | 55% | 43% | 2% | 0% | – | – |
| Morning Consult | Oct 22–31, 2020 | 1,109 (LV) | ± 3% | 52% | 43% | - | - | – | – |
| Remington Research Group/Missouri Scout | Oct 28–29, 2020 | 1,010 (LV) | ± 3% | 50% | 45% | 2% | 1% | – | 2% |
| SurveyMonkey/Axios | Oct 1–28, 2020 | 4,759 (LV) | – | 53% | 45% | - | - | – | – |
| Remington Research Group/Missouri Scout | Oct 14–15, 2020 | 1,010 (LV) | ± 3% | 51% | 45% | 1% | 1% | - | 2% |
| YouGov/SLU | Sep 24 – Oct 7, 2020 | 931 (LV) | ± 3.9% | 52% | 43% | - | - | 3% | 2% |
| Garin-Hart-Yang/Galloway for Missouri[upper-alpha 66] | Sep 28 – Oct 2, 2020 | 600 (LV) | ± 4.1% | 50% | 48% | - | - | – | – |
| Remington Research Group/Missouri Scout | Sep 30 – Oct 1, 2020 | 980 (LV) | ± 3% | 51% | 46% | - | - | – | 3% |
| SurveyMonkey/Axios | Sep 1–30, 2020 | 2,157 (LV) | – | 53% | 45% | - | - | – | 2% |
| Remington Research Group/Missouri Scout | Sep 16–17, 2020 | 1,046 (LV) | ± 3% | 53% | 45% | - | - | – | 2% |
| We Ask America | Sep 1–3, 2020 | 500 (LV) | ± 4.38% | 49% | 44% | - | - | 5%[lower-alpha 599] | 2% |
| SurveyMonkey/Axios | Aug 1–31, 2020 | 1,863 (LV) | – | 54% | 44% | - | - | – | 2% |
| Trafalgar Group (R) | Aug 26–28, 2020 | 1,015 (LV) | ± 2.99% | 52% | 41% | 3% | - | 1%[lower-alpha 600] | 3% |
| SurveyMonkey/Axios | Jul 1–31, 2020 | 2,261 (LV) | – | 54% | 44% | - | - | – | 2% |
| YouGov/Saint Louis University | Jun 23 – Jul 1, 2020 | 900 (LV) | ± 3.95% | 50% | 43% | - | - | 4% | 4% |
| SurveyMonkey/Axios | Jun 8–30, 2020 | 868 (LV) | – | 51% | 47% | - | - | – | 1% |
| Garin-Hart-Yang/Galloway for Governor/Missouri Scout[upper-alpha 66] | Jun 16–22, 2020 | 800 (LV) | ± 3.5% | 46% | 48% | - | - | – | – |
| Remington Research Group/Missouri Scout | Jun 10–11, 2020 | 1,152 (LV) | ± 2.9% | 51% | 43% | - | - | – | 6% |
| We Ask America | May 26–27, 2020 | 500 (LV) | ± 4.38% | 48% | 44% | - | - | 3%[lower-alpha 601] | 5% |
| Remington Research Group/Missouri Scout | Feb 26–27, 2020 | 1,050 (LV) | – | 53% | 42% | - | - | – | 5% |
| American Viewpoint/Uniting Missouri[upper-alpha 67] | Jan 20–22, 2020 | 1,200 (LV) | – | 50% | 43% | - | - | – | 7% |
| Remington Research Group | Sep 18–19, 2019 | 1,046 (LV) | ± 3.0% | 53% | 42% | - | - | – | 5% |
| Remington Research Group | Apr 10–11, 2019 | 955 (LV) | ± 3.3% | 51% | 43% | - | - | – | 6% |
Montana
Graphical summary
Aggregate polls
| Source of poll aggregation |
Dates administered |
Dates updated |
Joe Biden Democratic |
Donald Trump Republican |
Other/ Undecided [lower-alpha 1] |
Margin |
|---|---|---|---|---|---|---|
| 270 to Win | October 15–28, 2020 | October 30, 2020 | 44.8% | 50.2% | 5.0% | Trump +5.4 |
| FiveThirtyEight | until November 1, 2020 | November 1, 2020 | 45.3% | 50.2% | 4.5% | Trump +4.9 |
| Average | 45.1% | 50.2% | 4.7% | Trump +5.1 | ||
Polls
| Poll source | Date(s) administered |
Sample size[lower-alpha 2] |
Margin of error |
Donald Trump Republican |
Joe Biden Democratic |
Jo Jorgensen Libertarian |
Other | Undecided |
|---|---|---|---|---|---|---|---|---|
| Change Research | Oct 29 – Nov 2, 2020 | 920 (LV) | ± 3.5% | 49% | 48% | 1% | 1%[lower-alpha 602] | 1% |
| SurveyMonkey/Axios | Oct 20 – Nov 2, 2020 | 1,021 (LV) | ± 4% | 52%[lower-alpha 603] | 46% | - | – | – |
| SurveyMonkey/Axios | Oct 1–28, 2020 | 1,471 (LV) | ± 4.0% | 50% | 48% | - | – | – |
| Public Policy Polling/Protect Our Care[upper-alpha 68] | Oct 26–27, 2020 | 886 (LV) | ± 3.3% | 49% | 47% | - | – | 3% |
| Montana State University Billings | Oct 19–24, 2020 | 546 (LV) | ± 4.2% | 52% | 45% | 1% | – | 2% |
| Siena College/NYT Upshot | Oct 18–20, 2020 | 758 (LV) | ± 4.4% | 49% | 43% | 3% | 2%[lower-alpha 604] | 3%[lower-alpha 605] |
| Strategies 360/NBCMT | Oct 15–20, 2020 | 500 (LV) | ± 4.4% | 51% | 43% | 3% | – | 4% |
| RMG Research/PoliticalIQ | Oct 15–18, 2020 | 800 (LV) | ± 3.5% | 50%[lower-alpha 606] | 46% | 2% | 4%[lower-alpha 607] | 0% |
| 48%[lower-alpha 608] | 48% | 2% | 4%[lower-alpha 609] | 0% | ||||
| 52%[lower-alpha 610] | 44% | 2% | 4%[lower-alpha 611] | 0% | ||||
| Public Policy Polling | Oct 9–10, 2020 | 798 (V) | ± 3.5% | 52% | 46% | - | 2%[lower-alpha 612] | 0% |
| Emerson College | Oct 4–7, 2020 | 500 (LV) | ± 3.7% | 56% | 44% | - | – | – |
| Data For Progress (D) | Sep 30 – Oct 5, 2020 | 737 (LV) | ± 3.6% | 49% | 43% | 3% | 0%[lower-alpha 613] | 5% |
| Montana State University Bozeman | Sep 14 – Oct 2, 2020 | 1,607 (LV) | ± 3.9% | 51% | 44% | – | 4% | 2% |
| SurveyMonkey/Axios | Sep 1–30, 2020 | 480 (LV) | – | 57% | 41% | - | – | 2% |
| Siena College/NYT Upshot | Sep 14–16, 2020 | 625 (LV) | ± 4.8% | 49% | 42% | 2% | 2%[lower-alpha 614] | 5%[lower-alpha 615] |
| Fabrizio Ward/Hart Research Associates/AARP | Aug 30 – Sep 5, 2020 | 800 (LV) | ± 3.5% | 50% | 43% | - | 0%[lower-alpha 616] | 6% |
| SurveyMonkey/Axios | Aug 1–31, 2020 | 562 (LV) | – | 52% | 46% | - | – | 1% |
| Expedition Strategies/House Majority PAC[upper-alpha 69] | Aug 22–27, 2020 | 400 (LV) | ± 4.9% | 48% | 44% | - | – | 7%[lower-alpha 617] |
| Emerson College | Jul 31 – Aug 2, 2020 | 584 (LV) | ± 4.0% | 54%[lower-alpha 618] | 46% | - | – | – |
| SurveyMonkey/Axios | Jul 1–31, 2020 | 527 (LV) | – | 53% | 44% | - | – | 3% |
| Public Policy Polling/AFSCME[upper-alpha 6] | Jul 23–24, 2020 | 917 (V) | – | 50% | 45% | - | – | 5% |
| Spry Strategies/American Principles Project[upper-alpha 70] | Jul 11–16, 2020 | 700 (LV) | ± 3.7% | 52% | 42% | - | – | 6% |
| Civiqs/Daily Kos | Jul 11–13, 2020 | 873 (RV) | ± 4.2% | 49% | 45% | - | 5%[lower-alpha 619] | 1% |
| Public Policy Polling/Election Twitter | Jul 9–10, 2020 | 1,224 (V) | ± 2.8% | 51% | 42% | - | – | 7% |
| SurveyMonkey/Axios | Jun 8–30, 2020 | 166 (LV) | – | 57% | 41% | - | – | 2% |
| University of Montana | Jun 17–26, 2020 | 517 (RV) | ± 4.3% | 52% | 38% | - | – | 10% |
| Montana State University Bozeman | Apr 10–27, 2020 | 459 (LV) | ± 4.6% | 45% | 40% | - | 11% | 5% |
| The Progress Campaign (D) | Apr 14–21, 2020 | 1,712 (RV) | ± 4.6% | 51% | 42% | - | – | 7%[lower-alpha 620] |
| University of Montana | Feb 12–22, 2020 | 498 (LV) | ± 4.4% | 56% | 34% | - | – | 10% |
| University of Montana | Sep 26 – Oct 3, 2019 | 303 (RV) | ± 5.6% | 54% | 47% | - | – | – |
Nebraska
Aggregate polls
| Source of poll aggregation |
Dates administered |
Dates updated |
Joe Biden Democratic |
Donald Trump Republican |
Other/ Undecided [lower-alpha 1] |
Margin |
|---|---|---|---|---|---|---|
| FiveThirtyEight | until October 31, 2020 | November 1, 2020 | 42.7% | 52.5% | 4.8% | Trump +9.8 |
- Statewide
| Poll source | Date(s) administered |
Sample size[lower-alpha 2] |
Margin of error |
Donald Trump Republican |
Joe Biden Democratic |
Jo Jorgensen Libertarian |
Other | Undecided |
|---|---|---|---|---|---|---|---|---|
| SurveyMonkey/Axios | Oct 20 – Nov 2, 2020 | 1,742 (LV) | ± 3.5% | 56%[lower-alpha 621] | 43% | - | - | – |
| SurveyMonkey/Axios | Oct 1–28, 2020 | 2,423 (LV) | – | 53% | 46% | - | - | – |
| SurveyMonkey/Axios | Sep 1–30, 2020 | 799 (LV) | – | 57% | 41% | - | - | 2% |
| SurveyMonkey/Axios | Aug 1–31, 2020 | 560 (LV) | – | 53% | 47% | - | - | 1% |
| SurveyMonkey/Axios | Jul 1–31, 2020 | 910 (LV) | – | 54% | 44% | - | - | 2% |
| SurveyMonkey/Axios | Jun 8–30, 2020 | 267 (LV) | – | 56% | 42% | - | - | 2% |
- in Nebraska's 1st congressional district
| Poll source | Date(s) administered |
Sample size[lower-alpha 2] |
Margin of error |
Donald Trump Republican |
Joe Biden Democratic |
Jo Jorgensen Libertarian |
Other | Undecided |
|---|---|---|---|---|---|---|---|---|
| Strategies 360/Kate Bolz[upper-alpha 71] | Jul 16–22, 2020 | 400 (LV) | ± 4.9% | 48% | 46% | - | - | – |
- in Nebraska's 2nd congressional district
| Poll source | Date(s) administered |
Sample size[lower-alpha 2] |
Margin of error |
Donald Trump Republican |
Joe Biden Democratic |
Jo Jorgensen Libertarian |
Other | Undecided |
|---|---|---|---|---|---|---|---|---|
| University of Nevada | Oct 30 – Nov 2, 2020 | 191 (LV) | ± 7% | 44% | 50% | 5% | – | – |
| Change Research | Oct 29 – Nov 2, 2020 | 920 (LV) | ± 3.5% | 47% | 50% | 2% | 0%[lower-alpha 622] | 0% |
| Emerson College | Oct 29–30, 2020 | 806 (LV) | ± 3.5% | 48%[lower-alpha 623] | 50% | - | 2%[lower-alpha 624] | – |
| FM3 Research/Congressional Progressive Caucus PAC[upper-alpha 72] | Oct 1–4, 2020 | 450 (LV) | ± 4.6% | 42% | 53% | - | 5%[lower-alpha 625] | – |
| Siena College/NYT | Sep 25–27, 2020 | 420 (LV) | ± 5.3% | 41% | 48% | 4% | 1%[lower-alpha 626] | 6%[lower-alpha 627] |
| Global Strategy Group/House Majority PAC[upper-alpha 73] | Sep 14–16, 2020 | 400 (LV) | ± 4.9% | 44% | 50% | - | 1%[lower-alpha 628] | 3%[lower-alpha 629] |
| Global Strategy Group/House Majority PAC[upper-alpha 73] | Jul 27–29, 2020 | 400 (LV) | – | 45% | 51% | - | 2%[lower-alpha 630] | 3%[lower-alpha 631] |
| GQR/Kara Eastman[upper-alpha 74] | Jun 30 – Jul 5, 2020 | 502 (LV) | ± 4.37% | 44% | 51% | - | – | – |
| DCCC Targeting and Analytics Department/Ally Mutnick[upper-alpha 75] | May 7–10, 2020 | 448 (LV) | ± 4.6% | 41% | 52% | - | – | – |
Nevada
Graphical summary
Aggregate polls
| Source of poll aggregation |
Dates administered |
Dates updated |
Joe Biden Democratic |
Donald Trump Republican |
Other/ Undecided [lower-alpha 1] |
Margin |
|---|---|---|---|---|---|---|
| 270 to Win | October 16–31, 2020 | November 1, 2020 | 49.4% | 44.4% | 6.2% | Biden +5.0 |
| Real Clear Politics | October 6 – 31, 2020 | November 1, 2020 | 48.6% | 45.0% | 6.4% | Biden +3.6 |
| FiveThirtyEight | until October 31, 2020 | November 1, 2020 | 49.4% | 44.5% | 6.1% | Biden +4.9 |
| Average | 49.1% | 44.6% | 6.3% | Biden +4.5 | ||
Polls
| Poll source | Date(s) administered |
Sample size[lower-alpha 2] |
Margin of error |
Donald Trump Republican |
Joe Biden Democratic |
Jo Jorgensen Libertarian |
Other | Undecided |
|---|---|---|---|---|---|---|---|---|
| Trafalgar Group | Oct 31 – Nov 2, 2020 | 1,024 (LV) | ± 2.98% | 49% | 48% | 1% | 1%[lower-alpha 632] | 1% |
| SurveyMonkey/Axios | Oct 20 – Nov 2, 2020 | 2,366 (LV) | ± 3% | 49%[lower-alpha 633] | 49% | - | – | – |
| Data for Progress | Oct 27 – Nov 1, 2020 | 1,442 (LV) | ± 2.6% | 44% | 51% | 3% | 2%[lower-alpha 634] | – |
| Emerson College | Oct 29–31, 2020 | 720 (LV) | ± 3.6% | 47% | 49% | - | 4%[lower-alpha 635] | – |
| Trafalgar Group | Oct 28–29, 2020 | 1,024 (LV) | ± 2.98% | 47% | 49% | 2% | 1%[lower-alpha 636] | 1% |
| Gravis Marketing | Oct 27–28, 2020 | 688 (LV) | ± 3.7% | 44% | 50% | – | – | 6% |
| SurveyMonkey/Axios | Oct 1–28, 2020 | 3,333 (LV) | – | 49% | 50% | - | – | – |
| Siena College/NYT Upshot | Oct 23–26, 2020 | 809 (LV) | ± 3.8% | 43% | 49% | 3% | 2%[lower-alpha 637] | 4%[lower-alpha 638] |
| BUSR/University of Nevada | Oct 16–21, Oct 23, 2020 |
809 (LV) | ± 4% | 41% | 50% | – | – | – |
| Civiqs/Daily Kos | Oct 17–20, 2020 | 712 (LV) | ± 5.3% | 43% | 52% | - | 3%[lower-alpha 639] | 1% |
| WPA Intelligence/Las Vegas Review-Journal/AARP | Oct 7–11, 2020 | 512 (LV) | ± 4.4% | 42% | 44% | 3% | 5%[lower-alpha 640] | 6% |
| YouGov/CBS | Oct 6–9, 2020 | 1,036 (LV) | ± 4.1% | 46% | 52% | - | 2%[lower-alpha 641] | 0% |
| Siena College/NYT Upshot | Oct 2–6, 2020 | 660 (LV) | ± 4.3% | 42% | 48% | 3% | 1%[lower-alpha 642] | 6%[lower-alpha 643] |
| SurveyMonkey/Axios | Sep 1–30, 2020 | 1,239 (LV) | – | 47% | 51% | - | - | 2% |
| Pulse Opinion Research/Rasmussen Reports/American Greatness PAC[upper-alpha 8] | Sep 23–25, 2020 | 750 (LV) | – | 48% | 49% | - | 2%[lower-alpha 644] | 1% |
| Qualtrics/University of Nevada/BUSR | Sep 10–25, 2020 | 641 (LV) | ± 4% | 41% | 46% | - | 7%[lower-alpha 645] | 6% |
| Fox News | Sep 20–23, 2020 | 810 (LV) | ± 3% | 41% | 52% | 3% | 2%[lower-alpha 646] | 2% |
| 911 (RV) | ± 3% | 40% | 50% | 3% | 3%[lower-alpha 647] | 4% | ||
| ALG Research/The Nevada Independent (D)[upper-alpha 76] | Sep 15–21, 2020 | 800 (LV) | ± 3.5% | 43% | 47% | – | – | – |
| Siena College/NYT Upshot | Sep 8–10, 2020 | 462 (LV) | ± 5.3% | 42% | 46% | 3% | 1%[lower-alpha 648] | 7%[lower-alpha 649] |
| SurveyMonkey/Axios | Aug 1–31, 2020 | 998 (LV) | – | 49% | 50% | - | – | 1% |
| Qualtrics/University of Nevada/BUSR | Aug 20–30, 2020 | 682 (LV) | ± 4% | 39% | 44% | – | 5%[lower-alpha 650] | 12% |
| SurveyMonkey/Axios | Jul 1–31, 2020 | 1,021 (LV) | – | 52% | 47% | - | - | 2% |
| SurveyMonkey/Axios | Jun 8–30, 2020 | 609 (LV) | – | 49% | 50% | - | - | 1% |
| ALG Research/The Nevada Independent (D)[upper-alpha 77] | Apr 27–30, 2020 | 763 (LV) | ± 3.6% | 45% | 49% | – | – | – |
| AtlasIntel | Feb 19–21, 2020 | 1,100 (RV) | ± 3.0% | 41% | 44% | – | 15% | – |
| FOX News | Jan 5–8, 2020 | 1,505 (RV) | ± 2.5% | 39% | 47% | – | 9%[lower-alpha 651] | 4% |
| FOX News | Nov 10–13, 2019 | 1,506 (RV) | ± 2.5% | 40% | 47% | – | 9%[lower-alpha 652] | 4% |
| Emerson College | Oct 31 – Nov 2, 2019 | 1,089 (RV) | ± 2.9% | 51% | 49% | – | – | – |
| Gravis Marketing | Aug 14–16, 2019 | 926 (RV) | ± 3.2% | 43% | 49% | – | – | 8% |
| Emerson College | Mar 28–30, 2019 | 719 (RV) | ± 3.6% | 48% | 52% | – | – | – |
New Hampshire
Graphical summary
Aggregate polls
| Source of poll aggregation |
Dates administered |
Dates updated |
Joe Biden Democratic |
Donald Trump Republican |
Other/ Undecided [lower-alpha 1] |
Margin |
|---|---|---|---|---|---|---|
| 270 to Win | October 8–28, 2020 | October 29, 2020 | 53.4% | 42.4% | 4.2% | Biden +11.0 |
| FiveThirtyEight | until October 31, 2020 | November 1, 2020 | 53.8% | 42.9% | 3.3% | Biden +10.9 |
| Average | 53.6% | 42.7% | 3.7% | Biden +10.9 | ||
Polls
| Poll source | Date(s) administered |
Sample size[lower-alpha 2] |
Margin of error |
Donald Trump Republican |
Joe Biden Democratic |
Jo Jorgensen Libertarian |
Other | Undecided |
|---|---|---|---|---|---|---|---|---|
| SurveyMonkey/Axios | Oct 20 – Nov 2, 2020 | 1,013 (LV) | ± 4.5% | 45%[lower-alpha 653] | 54% | - | – | – |
| American Research Group | Oct 26–28, 2020 | 600 (LV) | ± 4% | 39% | 58% | 1% | – | 2% |
| University of New Hampshire | Oct 24–28, 2020 | 864 (LV) | ± 3.3% | 45% | 53% | 1% | 1% | 1% |
| SurveyMonkey/Axios | Oct 1–28, 2020 | 1,791 (LV) | – | 44% | 55% | - | – | – |
| Saint Anselm College | Oct 23–26, 2020 | 1,018 (LV) | ± 3.1% | 44% | 52% | 2% | – | 2% |
| YouGov/UMass Amherst | Oct 16–26, 2020 | 757 (LV) | ± 4.5% | 43% | 53% | 2% | 1%[lower-alpha 654] | 2% |
| University of New Hampshire | Oct 9–12, 2020 | 899 (LV) | ± 3.3% | 43% | 55% | 0% | 0%[lower-alpha 655] | 2% |
| Suffolk University/Boston Globe | Oct 8–12, 2020 | 500 (LV) | ± 4.4% | 41% | 51% | 2% | 3%[lower-alpha 656] | 5% |
| Saint Anselm College | Oct 1–4, 2020 | 1,147 (LV) | ± 2.9% | 41% | 53% | - | 4%[lower-alpha 657] | 2% |
| Emerson College | Sep 30 – Oct 1, 2020 | 700 (LV) | ± 3.6% | 45%[lower-alpha 658] | 53% | - | 2%[lower-alpha 659] | – |
| SurveyMonkey/Axios | Sep 1–30, 2020 | 637 (LV) | – | 43% | 55% | - | – | 2% |
| American Research Group | Sep 25–28, 2020 | 600 (LV) | ± 4% | 44% | 53% | 1% | – | 2% |
| University of New Hampshire | Sep 24–28, 2020 | 972 (LV) | ± 3.1% | 44% | 53% | 1% | 0%[lower-alpha 660] | 3% |
| Pulse Opinion Research/Center for American Greatness[upper-alpha 8] | Sep 23–25, 2020 | 850 (LV) | ± 4% | 42%[lower-alpha 661] | 56% | - | 1%[lower-alpha 662] | 1% |
| YouGov/UMass Lowell | Sep 17–25, 2020 | 657 (LV) | ± 4.6% | 44%[lower-alpha 663] | 52% | 1% | 2%[lower-alpha 664] | 1% |
| 44%[lower-alpha 665] | 53% | - | 0%[lower-alpha 666] | 1% | ||||
| Siena College/NYT Upshot | Sep 8–11, 2020 | 445 (LV) | ± 5.5% | 42% | 45% | 4% | 2%[lower-alpha 667] | 7%[lower-alpha 668] |
| SurveyMonkey/Axios | Aug 1–31, 2020 | 444 (LV) | – | 39% | 60% | - | – | 1% |
| Saint Anselm College | Aug 15–17, 2020 | 1,042 (RV) | ± 3.0% | 43% | 51% | - | 4%[lower-alpha 669] | 2% |
| SurveyMonkey/Axios | Jul 1–31, 2020 | 574 (LV) | – | 39% | 60% | - | – | 2% |
| University of New Hampshire | Jul 16–28, 2020 | 1,893 (LV) | ± 2.3% | 40% | 53% | - | 4%[lower-alpha 670] | 3% |
| SurveyMonkey/Axios | Jun 8–30, 2020 | 191 (LV) | – | 39% | 61% | - | – | 1% |
| University of New Hampshire | Jun 18–22, 2020 | 936 (LV) | – | 39% | 52% | - | 6%[lower-alpha 671] | 3% |
| Saint Anselm College | Jun 13–16, 2020 | 1,072 (RV) | ± 3% | 42% | 49% | - | 5% | 3% |
| University of New Hampshire | May 14–18, 2020 | 790 (LV) | – | 46% | 44% | - | 5%[lower-alpha 672] | 5% |
| Saint Anselm College | Apr 23–27, 2020 | 820 (RV) | ± 3.4% | 42% | 50% | - | 2% | 7% |
| University of New Hampshire | Feb 19–25, 2020 | 569 (LV) | ± 4.1% | 46% | 44% | - | 8%[lower-alpha 673] | 2% |
| AtlasIntel | Feb 8–10, 2020 | 1,100 (RV) | ± 3% | 46% | 44% | - | 11% | – |
| McLaughlin & Associates/NH Journal | Feb 4–5, 2020 | 400 (LV) | ± 4.9% | 49%[lower-alpha 674] | 45% | - | –[lower-alpha 675] | –[lower-alpha 676] |
| Marist College/NBC News | Jan 20–23, 2020 | 2,223 (RV) | ± 2.6% | 43% | 51% | - | 2% | 5% |
| Emerson College | Nov 23–26, 2019 | 637 (RV) | ± 3.8% | 48% | 52% | - | – | – |
| 547 (RV) | ± 4.1% | 42% | 46% | - | – | 13% | ||
| Saint Anselm College | Nov 13–18, 2019 | 512 (RV) | ± 4.3% | 43% | 51% | - | – | 6% |
| Emerson College | Sep 6–9, 2019 | 1,041 (RV) | ± 3.0% | 45% | 55% | - | – | – |
| Gravis Marketing | Aug 2–6, 2019 | 505 (RV) | ± 4.4% | 40% | 53% | - | – | 7% |
| Emerson College | Feb 21–22, 2019 | 910 (RV) | ± 3.2% | 45% | 55% | - | – | – |
| American Research Group | Mar 21–27, 2018 | 1,365 (RV) | ± 3.0% | 39% | 53% | - | – | 8% |
New Jersey
Aggregate polls
| Source of poll aggregation |
Dates administered |
Dates updated |
Joe Biden Democratic |
Donald Trump Republican |
Other/ Undecided [lower-alpha 1] |
Margin |
|---|---|---|---|---|---|---|
| 270 to Win | September 30 – October 13, 2020 | October 27, 2020 | 54.5% | 37.0% | 8.5% | Biden +17.5 |
| Real Clear Politics | September 4 – October 13, 2020 | October 27, 2020 | 54.7% | 37.3% | 8.0% | Biden +17.4 |
| FiveThirtyEight | until October 25, 2020 | October 27, 2020 | 56.3% | 36.6% | 7.1% | Biden +19.7 |
| Average | 55.2% | 37.0% | 7.8% | Biden +18.2 | ||
- Polls
| Poll source | Date(s) administered |
Sample size[lower-alpha 2] |
Margin of error |
Donald Trump Republican |
Joe Biden Democratic |
Jo Jorgensen Libertarian |
Howie Hawkins Green |
Other | Undecided |
|---|---|---|---|---|---|---|---|---|---|
| SurveyMonkey/Axios | Oct 20 – Nov 2, 2020 | 3,870 (LV) | ± 2% | 38%[lower-alpha 677] | 59% | - | - | – | – |
| Research Co. | Oct 31 – Nov 1, 2020 | 450 (LV) | ± 4.6% | 40% | 59% | - | - | 1%[lower-alpha 678] | 5% |
| Swayable | Oct 27 – Nov 1, 2020 | 324 (LV) | ± 7.2% | 40% | 59% | 1% | 0% | – | – |
| SurveyMonkey/Axios | Oct 1–28, 2020 | 6,472 (LV) | – | 37% | 60% | - | - | – | – |
| Swayable | Oct 23–26, 2020 | 386 (LV) | ± 6.5% | 38% | 62% | 0% | 0% | – | – |
| Rutgers-Eagleton | Oct 19–24, 2020 | 834 (LV) | ± 4% | 37% | 59% | - | - | 1%[lower-alpha 679] | 1% |
| Stockton College | Oct 7–13, 2020 | 721 (LV) | ± 3.7% | 36% | 56% | - | - | – | – |
| DKC Analytics/Brach Eichler | Oct 5–13, 2020 | 500 (LV) | ± 4.4% | 34% | 56% | - | - | 10%[lower-alpha 680] | – |
| Fairleigh Dickinson University | Sep 30 – Oct 5, 2020 | 582 (LV) | ± 4.6% | 38% | 53% | - | - | 5%[lower-alpha 681] | 4% |
| SurveyMonkey/Axios | Sep 1–30, 2020 | 2,952 (LV) | – | 37% | 60% | - | - | – | 3% |
| DKC Analytics/Brach Eichler | Sep 8–16, 2020 | 501 (LV) | ± 4.4% | 38% | 52% | - | - | 10%[lower-alpha 682] | – |
| Emerson College | Sep 4–7, 2020 | 500 (LV) | ± 4.4% | 40%[lower-alpha 683] | 58% | - | - | 2%[lower-alpha 684] | – |
| SurveyMonkey/Axios | Aug 1–31, 2020 | 2,309 (LV) | – | 40% | 57% | - | - | – | 3% |
| DKC Analytics/Brach Eichler | Aug 5–13, 2020 | 500 (LV) | ± 4.383% | 33% | 52% | - | - | 15%[lower-alpha 685] | – |
| SurveyMonkey/Axios | Jul 1–31, 2020 | 2,426 (LV) | – | 37% | 61% | - | - | – | 2% |
| Pollfish/DKC Analytics/Brach Eichler | Jul 7–12, 2020 | 500 (LV) | ± 4.383% | 33% | 51% | - | - | 7%[lower-alpha 686] | 8% |
| SurveyMonkey/Axios | Jun 8–30, 2020 | 1,110 (LV) | – | 37% | 61% | - | - | – | 3% |
| Quinnipiac | Apr 30 – May 4, 2020 | 941 (RV) | ± 3.2% | 35% | 54% | - | - | 3%[lower-alpha 687] | 8% |
| Rutgers-Eagleton | Apr 22 – May 2, 2020 | 689 (RV) | ± 4.2% | 33% | 56% | - | - | 5%[lower-alpha 688] | 7% |
| Monmouth University | Apr 16–19, 2020 | 635 (RV) | ± 3.9% | 38% | 54% | - | - | 2% | 6% |
| Fairleigh Dickinson University | Feb 12–16, 2020 | 715 (RV) | – | 35% | 53% | - | - | – | – |
New Mexico
Graphical summary
Aggregate polls
| Source of poll aggregation |
Dates administered |
Dates updated |
Joe Biden Democratic |
Donald Trump Republican |
Other/ Undecided [lower-alpha 1] |
Margin |
|---|---|---|---|---|---|---|
| 270 to Win | September 30 – October 29, 2020 | November 1, 2020 | 53.5% | 40.5% | 6.0% | Biden +13.0 |
| FiveThirtyEight | until October 31, 2020 | November 1, 2020 | 53.8% | 42.3% | 3.9% | Biden +11.5 |
| Average | 53.7% | 41.4% | 4.9% | Biden +12.3 | ||
Polls
| Poll source | Date(s) administered |
Sample size[lower-alpha 2] |
Margin of error |
Donald Trump Republican |
Joe Biden Democratic |
Jo Jorgensen Libertarian |
Howie Hawkins Green |
Other | Undecided |
|---|---|---|---|---|---|---|---|---|---|
| SurveyMonkey/Axios | Oct 20 – Nov 2, 2020 | 1,481 (LV) | ± 3.5% | 42%[lower-alpha 689] | 56% | - | - | – | – |
| Research & Polling Inc./Albuquerque Journal | Oct 23–29, 2020 | 1,180 (LV) | ± 2.9% | 42% | 54% | - | - | 3%[lower-alpha 690] | 1% |
| SurveyMonkey/Axios | Oct 1–28, 2020 | 2,719 (LV) | – | 46% | 52% | - | - | – | – |
| GBAO Strategies/Ben Ray Luján[upper-alpha 78] | Oct 14–17, 2020 | 600 (LV) | ± 4.0% | 41% | 54% | - | - | – | – |
| Public Policy Polling/NM Political Report | Sep 30 – Oct 1, 2020 | 886 (LV) | ± 3.3% | 39% | 53% | 2% | - | 2%[lower-alpha 691] | 4% |
| SurveyMonkey/Axios | Sep 1–30, 2020 | 1,015 (LV) | – | 44% | 54% | - | - | – | 1% |
| Research & Polling Inc./Albuquerque Journal | Aug 26 – Sep 2, 2020 | 1,123 (LV) | ± 2.9% | 39% | 54% | - | - | – | – |
| SurveyMonkey/Axios | Aug 1–31, 2020 | 1,087 (LV) | – | 43% | 56% | - | - | – | 2% |
| SurveyMonkey/Axios | Jul 1–31, 2020 | 904 (LV) | – | 48% | 49% | - | - | – | 2% |
| SurveyMonkey/Axios | Jun 8–30, 2020 | 506 (LV) | – | 50% | 49% | - | - | – | 1% |
| Public Policy Polling/NM Political Report | Jun 12–13, 2020 | 740 (V) | ± 3.6% | 39% | 53% | - | - | – | 8% |
| Public Policy Polling/The Majority Institute[upper-alpha 79] | Apr 20–21, 2020 | 1,091 (RV) | ± 3.1% | 40% | 52% | - | - | – | – |
| Emerson College | Jan 3–6, 2020 | 967 (RV) | ± 3.1% | 46% | 54% | - | - | – | – |
New York
Aggregate polls
| Source of poll aggregation |
Dates administered |
Dates updated |
Joe Biden Democratic |
Donald Trump Republican |
Other/ Undecided [lower-alpha 1] |
Margin |
|---|---|---|---|---|---|---|
| Real Clear Politics | April 30 – September 29, 2020 | October 2, 2020 | 59.7% | 31.0% | 9.3% | Biden +28.7 |
| FiveThirtyEight | until October 24, 2020 | October 25, 2020 | 62.2% | 31.3% | 6.5% | Biden +30.9 |
| Average | 61.0% | 31.2% | 7.8% | Biden +29.8 | ||
Polls
| Poll source | Date(s) administered |
Sample size[lower-alpha 2] |
Margin of error |
Donald Trump Republican |
Joe Biden Democratic |
Jo Jorgensen Libertarian |
Howie Hawkins Green |
Other | Undecided |
|---|---|---|---|---|---|---|---|---|---|
| SurveyMonkey/Axios | Oct 20 – Nov 2, 2020 | 6,548 (LV) | ± 2% | 35%[lower-alpha 692] | 63% | – | – | – | – |
| Research Co. | Oct 31 – Nov 1, 2020 | 450 (LV) | ± 4.6% | 34% | 64% | - | - | 2%[lower-alpha 693] | 4% |
| SurveyMonkey/Axios | Oct 1–28, 2020 | 10,220 (LV) | – | 34% | 63% | - | - | – | – |
| Swayable | Oct 23–26, 2020 | 495 (LV) | ± 5.8% | 33% | 65% | 1% | 1% | – | – |
| SurveyMonkey/Axios | Sep 1–30, 2020 | 10,007 (LV) | – | 34% | 64% | - | - | – | 2% |
| Siena College | Sep 27–29, 2020 | 504 (LV) | ± 4.4% | 29% | 61% | 0% | 1% | 2%[lower-alpha 694] | 7% |
| SurveyMonkey/Axios | Aug 1–31, 2020 | 9,969 (LV) | – | 34% | 64% | - | - | – | 2% |
| Public Policy Polling | Aug 20–22, 2020 | 1,029 (V) | ± 3.1% | 32% | 63% | - | - | – | 5% |
| SurveyMonkey/Axios | Jul 1–31, 2020 | 10,280 (LV) | – | 34% | 63% | - | - | – | 2% |
| SurveyMonkey/Axios | Jun 8–30, 2020 | 4,555 (LV) | – | 33% | 65% | - | - | – | 2% |
| Siena College | Jun 23–25, 2020 | 806 (RV) | ± 3.9% | 32% | 57% | - | - | – | 10% |
| Siena College | May 17–21, 2020 | 767 (RV) | ± 3.7% | 32% | 57% | - | - | – | 11% |
| Quinnipiac University | Apr 30 – May 4, 2020 | 915 (RV) | ± 3.2% | 32% | 55% | - | - | 5%[lower-alpha 695] | 8% |
| Siena College | Apr 19–23, 2020 | 803 (RV) | ± 3.7% | 29% | 65% | - | - | – | 6% |
| Siena College | Mar 22–26, 2020 | 566 (RV) | ± 4.5% | 33% | 58% | - | - | – | 10% |
| Siena College | Feb 16–20, 2020 | 658 (RV) | ± 4.5% | 36% | 55% | - | - | – | 5% |
North Carolina
Graphical summary
Aggregate polls
| Source of poll aggregation |
Dates administered |
Dates updated |
Joe Biden Democratic |
Donald Trump Republican |
Other/ Undecided [lower-alpha 1] |
Margin |
|---|---|---|---|---|---|---|
| 270 to Win | October 22 – November 1, 2020 | November 2, 2020 | 47.8% | 47.5% | 4.7% | Biden +0.3 |
| Real Clear Politics | October 26 – November 1, 2020 | November 2, 2020 | 47.6% | 47.8% | 4.6% | Trump +0.2 |
| FiveThirtyEight | until November 1, 2020 | November 2, 2020 | 48.9% | 47.1% | 4.0% | Biden +1.8 |
| Average | 48.1% | 47.5% | 4.4% | Biden +0.6 | ||
June 1 – October 31, 2020
| Poll source | Date(s) administered |
Sample size[lower-alpha 2] |
Margin of error |
Donald Trump Republican |
Joe Biden Democratic |
Jo Jorgensen Libertarian |
Howie Hawkins Green |
Other | Undecided |
|---|---|---|---|---|---|---|---|---|---|
| SurveyMonkey/Axios | Oct 20 – Nov 2, 2020 | 5,363 (LV) | ± 2% | 48%[lower-alpha 696] | 50% | - | - | – | – |
| Change Research/CNBC | Oct 29 – Nov 1, 2020 | 473 (LV) | ± 4.51% | 47% | 49% | 2% | 1% | – | 1% |
| Swayable | Oct 27 – Nov 1, 2020 | 690 (LV) | ± 5.3% | 46% | 52% | 1% | 0% | – | – |
| Ipsos/Reuters | Oct 27 – Nov 1, 2020 | 707 (LV) | ± 4.2% | 48%[lower-alpha 14] | 49% | 1% | 1% | 2%[lower-alpha 697] | – |
| 48%[lower-alpha 698] | 49% | - | - | 3%[lower-alpha 699] | 1% | ||||
| 48%[lower-alpha 700] | 50% | - | - | 2%[lower-alpha 701] | – | ||||
| Data for Progress | Oct 27 – Nov 1, 2020 | 908 (LV) | ± 3.3% | 48% | 50% | 1% | 1% | 0%[lower-alpha 702] | – |
| Frederick Polls/Compete Everywhere[upper-alpha 80] | Oct 30–31, 2020 | 676 (LV) | ± 3.7% | 49% | 51% | - | - | – | – |
| AtlasIntel | Oct 30–31, 2020 | 812 (LV) | ± 3.0% | 50% | 48% | - | - | 3% | – |
| Insider Advantage/Center for American Greatness[upper-alpha 8] | Oct 30–31, 2020 | 450 (LV) | ± 4.6% | 48% | 44% | 2% | - | – | 7% |
| Emerson College | Oct 29–31, 2020 | 855 (LV) | ± 3.3% | 47%[lower-alpha 703] | 47% | - | - | 6%[lower-alpha 704] | – |
| Morning Consult | Oct 22–31, 2020 | 1,982 (LV) | ± 2% | 48% | 49% | - | - | – | – |
| CNN/SSRS | Oct 23–30, 2020 | 901 (LV) | ± 4.1% | 45% | 51% | 2% | 1% | 1%[lower-alpha 705] | 1% |
| Pulse Opinion Research/Rasmussen Reports | Oct 28–29, 2020 | 800 (LV) | ± 3.5% | 48% | 47% | - | - | 2%[lower-alpha 706] | – |
| Trafalgar Group | Oct 27–29, 2020 | 1,082 (LV) | ± 2.9% | 49% | 47% | 3% | - | 1%[lower-alpha 707] | 1% |
| Redfield & Wilton Strategies | Oct 26–29, 2020 | 1,489 (LV) | – | 47% | 49% | 2% | 0% | 0% | 2% |
| Harvard-Harris/The Hill | Oct 26–29, 2020 | 903 (LV) | – | 48% | 49% | - | - | – | 3% |
| East Carolina University | Oct 27–28, 2020 | 1,103 (LV) | ± 3.4% | 48%[lower-alpha 708] | 50% | - | - | 2%[lower-alpha 709] | 0%[lower-alpha 710] |
| Cardinal Point Analytics (R)/NSJ | Oct 27–28, 2020 | 750 (LV) | ± 3.6% | 48% | 46% | 1% | 1% | 2%[lower-alpha 711] | 2% |
| Marist College/NBC | Oct 25–28, 2020 | 800 (LV) | ± 4.7% | 46% | 52% | - | - | 2% | 1% |
| SurveyMonkey/Axios | Oct 1–28, 2020 | 8,720 (LV) | – | 47% | 52% | - | - | – | – |
| Gravis Marketing | Oct 26–27, 2020 | 614 (LV) | ± 4% | 46% | 49% | - | - | – | 4% |
| Public Policy Polling/Protect Our Care[upper-alpha 81] | Oct 26–27, 2020 | 937 (V) | ± 3.2% | 47% | 51% | - | - | – | 3% |
| Meeting Street Insights/Carolina Partnership for Reform (R) | Oct 24–27, 2020 | 600 (LV) | ± 4% | 45% | 48% | - | - | – | – |
| Siena College/NYT Upshot | Oct 23–27, 2020 | 1,034 (LV) | ± 3.4% | 45% | 48% | 2% | 1% | 0%[lower-alpha 712] | 4%[lower-alpha 713] |
| Ipsos/Reuters | Oct 21–27, 2020 | 647 (LV) | ± 4.4% | 48%[lower-alpha 14] | 49% | 1% | 1% | 1%[lower-alpha 714] | – |
| 48%[lower-alpha 715] | 49% | - | - | 2%[lower-alpha 716] | 1% | ||||
| RMG Research/PoliticalIQ | Oct 24–26, 2020 | 800 (LV) | ± 3.5% | 47%[lower-alpha 14] | 48% | - | - | 3%[lower-alpha 717] | 2% |
| 46%[lower-alpha 718] | 50% | - | - | 3%[lower-alpha 719] | 2% | ||||
| 49%[lower-alpha 720] | 47% | - | - | 3%[lower-alpha 721] | 2% | ||||
| Swayable | Oct 23–26, 2020 | 396 (LV) | ± 6.8% | 48% | 50% | 2% | 0% | – | – |
| SurveyUSA/WRAL-TV | Oct 23–26, 2020 | 627 (LV) | ± 4.9% | 48% | 48% | - | - | 2%[lower-alpha 722] | 2% |
| YouGov/UMass Amherst | Oct 20–26, 2020 | 911 (LV) | ± 4.2% | 48% | 48% | 1% | 0% | 1%[lower-alpha 723] | 2% |
| Wick Surveys | Oct 24–25, 2020 | 1,000 (LV) | ± 3.1% | 49% | 47% | - | - | – | – |
| Harper Polling/Civitas (R) | Oct 22–25, 2020 | 504 (LV) | ± 4.37% | 46% | 47% | 1% | 0% | 0%[lower-alpha 724] | 6% |
| YouGov/CBS | Oct 20–23, 2020 | 1,022 (LV) | ± 4.1% | 47% | 51% | – | – | 2%[lower-alpha 725] | 0% |
| Trafalgar Group | Oct 20–22, 2020 | 1,098 (LV) | ± 2.9% | 48.8% | 46% | 2.3% | 0.4% | 0.8%[lower-alpha 726] | 1.7% |
| Citizen Data | Oct 17–20, 2020 | 1000 (LV) | ± 3.1% | 44% | 50% | 1% | 0.2% | 1.3% | 3.6% |
| Pulse Opinion Research/Rasmussen Reports | Oct 20–21, 2020 | 800 (LV) | ± 3.5% | 48% | 47% | - | - | 2%[lower-alpha 727] | 3% |
| Ipsos/Reuters | Oct 14–20, 2020 | 660 (LV) | ± 4.3% | 47%[lower-alpha 14] | 49% | 1% | 1% | 1%[lower-alpha 728] | – |
| 46%[lower-alpha 729] | 49% | - | - | 2%[lower-alpha 730] | 2% | ||||
| Morning Consult | Oct 11–20, 2020 | 1,904 (LV) | ± 2.2% | 47% | 50% | - | - | – | – |
| Meredith College | Oct 16–19, 2020 | 732 (LV) | ± 3.5% | 44% | 48% | 1% | 1% | 0%[lower-alpha 731] | 4% |
| Change Research/CNBC | Oct 16–19, 2020 | 521 (LV)[lower-alpha 41] | – | 47% | 50% | - | - | – | – |
| Data for Progress (D) | Oct 15–18, 2020 | 929 (LV) | ± 3.2% | 44% | 48% | 1% | 1% | – | 5% |
| East Carolina University | Oct 15–18, 2020 | 1,155 (LV) | ± 3.4% | 47%[lower-alpha 732] | 51% | - | - | 2%[lower-alpha 733] | 0% |
| ABC/Washington Post | Oct 12–17, 2020 | 646 (LV) | ± 4.5% | 48%[lower-alpha 14] | 49% | 1% | 0%[lower-alpha 734] | 0%[lower-alpha 735] | 1% |
| 48%[lower-alpha 736] | 50% | - | - | 0%[lower-alpha 737] | 1% | ||||
| Emerson College | Oct 11–14, 2020 | 721 (LV) | ± 3.6% | 49%[lower-alpha 738] | 49% | - | - | 2%[lower-alpha 739] | – |
| Civiqs/Daily Kos | Oct 11–14, 2020 | 1,211 (LV) | ± 3.3% | 46% | 51% | - | - | 2%[lower-alpha 740] | 1% |
| Redfield & Wilton Strategies | Oct 10–13, 2020 | 994 (LV) | – | 46%[lower-alpha 41] | 49% | 1% | 0% | – | – |
| Siena College/NYT Upshot | Oct 9–13, 2020 | 627 (LV) | ± 4.5% | 42% | 46% | 2% | 1% | 1%[lower-alpha 741] | 8%[lower-alpha 742] |
| Ipsos/Reuters | Oct 7–13, 2020 | 660 (LV) | ± 4.3% | 48%[lower-alpha 14] | 48% | 2% | 0% | 1%[lower-alpha 743] | – |
| 47%[lower-alpha 744] | 48% | - | - | 3%[lower-alpha 745] | 3% | ||||
| Monmouth University | Oct 8–11, 2020 | 500 (RV) | ± 4.4% | 46% | 49% | 3% | 0% | 0%[lower-alpha 746] | 2% |
| 500 (LV)[lower-alpha 747] | 46% | 50% | - | - | 2% | 2% | |||
| 500 (LV)[lower-alpha 748] | 48% | 49% | - | - | 2% | 1% | |||
| SurveyUSA/WRAL-TV | Oct 8–11, 2020 | 669 (LV) | ± 4.8% | 45% | 50% | - | - | 2%[lower-alpha 749] | 3% |
| Susquehanna Polling & Research Inc./American Greatness PAC[upper-alpha 8] | Oct 7–11, 2020 | 500 (LV) | ± 4.3% | 46% | 48% | 2% | - | 1%[lower-alpha 750] | 4% |
| RMG Research/PoliticalIQ | Oct 7–11, 2020 | 800 (LV) | – | 45%[lower-alpha 14] | 47% | 2% | 1% | 1% | 4% |
| 43%[lower-alpha 751] | 49% | 2% | 1% | 1% | 4% | ||||
| 47%[lower-alpha 752] | 44% | 2% | 1% | 1% | 4% | ||||
| Morning Consult | Oct 2–11, 2020 | 1,993 (LV) | ± 2.2% | 46% | 50% | - | - | – | – |
| YouGov/CCES | Sep 29 – Oct 7, 2020 | 1,627 (LV) | – | 45% | 49% | - | - | – | – |
| Redfield & Wilton Strategies | Oct 9–10 | 750 (LV) | – | 42%[lower-alpha 41] | 49% | 1% | 0% | – | – |
| Redfield & Wilton Strategies | Oct 4–6, 2020 | 938 (LV) | ± 3.2% | 44% | 49% | 1% | 0% | 0%[lower-alpha 753] | 5% |
| Ipsos/Reuters | Sep 29 – Oct 6, 2020 | 693 (LV) | ± 4.2% | 47% | 47% | - | - | 2%[lower-alpha 754] | 3% |
| Public Policy Polling | Oct 4–5, 2020 | 911 (V) | – | 46% | 50% | - | - | – | 3% |
| Data For Progress (D) | Sep 30 - Oct 5, 2020 | 1,285 (LV) | ± 2.7% | 44% | 51% | 2% | 0% | – | 3% |
| Change Research/CNBC | Oct 2–4, 2020 | 396 (LV) | – | 47% | 49% | - | - | – | – |
| East Carolina University | Oct 2–4, 2020 | 1,232 (LV) | ± 3.2% | 46% | 50% | - | - | 2%[lower-alpha 755] | 2% |
| SurveyMonkey/Axios | Sep 1–30, 2020 | 3,495 (LV) | – | 46% | 52% | - | - | – | 2% |
| ALG Research/Piedmont Rising[upper-alpha 82] | Sep 22–28, 2020 | 822 (V) | – | 47% | 50% | - | - | – | – |
| Hart Research Associates/Human Rights Campaign[upper-alpha 83] | Sep 24–27, 2020 | 400 (LV) | ± 4.9% | 47% | 49% | - | - | – | – |
| Redfield & Wilton Strategies | Sep 23–26, 2020 | 1,097 (LV) | ± 2.96% | 45% | 47% | 2% | 0% | 1%[lower-alpha 756] | 6% |
| YouGov/CBS | Sep 22–25, 2020 | 1,213 (LV) | ± 3.6% | 46% | 48% | - | - | 2%[lower-alpha 757] | 4% |
| YouGov/UMass Lowell | Sep 18–25, 2020 | 921 (LV) | ± 4.1% | 47%[lower-alpha 14] | 47% | 2% | 1% | 0%[lower-alpha 758] | 2% |
| 49%[lower-alpha 759] | 48% | - | - | 2%[lower-alpha 760] | 2% | ||||
| Meredith College | Sep 18–22, 2020 | 705 (RV) | ± 3.5% | 45% | 46% | 2% | 0% | 1%[lower-alpha 761] | 6% |
| Change Research/CNBC | Sep 18–20, 2020 | 579 (LV) | – | 46% | 48% | - | - | – | – |
| Harper Polling/Civitas (R) | Sep 17–20, 2020 | 612 (LV) | ± 3.96% | 45% | 44% | 2% | 0% | 0%[lower-alpha 762] | 8% |
| Emerson College | Sep 16–18, 2020 | 717 (LV) | ± 3.6% | 49%[lower-alpha 763] | 51% | - | - | – | – |
| Siena College/NYT Upshot | Sep 11–16, 2020 | 653 (LV) | ± 4.3% | 44% | 45% | 2% | 1% | 0%[lower-alpha 764] | 8%[lower-alpha 765] |
| Ipsos/Reuters | Sep 11–16, 2020 | 586 (LV) | ± 4.6% | 47% | 47% | - | - | 3%[lower-alpha 766] | 3% |
| Redfield & Wilton Strategies | Sep 12–15, 2020 | 1,092 (LV) | ± 2.97% | 45% | 47% | 1% | 1% | 0%[lower-alpha 767] | 5% |
| Suffolk University/USA Today | Sep 11–14, 2020 | 500 (LV) | – | 42.8% | 46.2% | 4.8% | 0.2% | 1.8%[lower-alpha 768] | 4.2% |
| SurveyUSA/WRAL TV | Sep 10–13, 2020 | 596 (LV) | ± 5.6% | 47% | 47% | - | - | 2%[lower-alpha 769] | 5% |
| CNN/SSRS | Sep 9–13, 2020 | 787 (LV) | ± 3.9% | 46% | 49% | 2% | 1% | 0%[lower-alpha 770] | 2% |
| Kaiser Family Foundation/Cook Political Report | Aug 29 – Sep 13, 2020 | 1,172 (RV) | ± 3% | 43% | 45% | - | - | 4%[lower-alpha 771] | 9% |
| Trafalgar | Sep 9–11, 2020 | 1,046 (LV) | ± 3% | 47.8% | 46.1% | 1.6% | 0.5% | 1.5%[lower-alpha 772] | 2.5% |
| Pulse Opinion Research/Rasmussen Reports | Sep 7–8, 2020 | 1,000 (LV) | ± 3% | 49%[lower-alpha 773] | 48% | - | - | 3%[lower-alpha 774] | – |
| Benenson Strategy Group/GS Group/AARP | Aug 28 – Sep 8, 2020 | 1,600 (LV) | ± 2.5% | 48% | 48% | - | - | 1%[lower-alpha 775] | 4% |
| Morning Consult | Aug 29 – Sep 7, 2020 | 1,592 (LV) | ± (2%-4%) | 47%[lower-alpha 776] | 48% | - | - | – | – |
| Change Research/CNBC | Sep 4–6, 2020 | 442 (LV) | – | 47% | 49% | - | - | 4%[lower-alpha 777] | – |
| Redfield & Wilton Strategies | Aug 30 – Sep 3, 2020 | 951 (LV) | ± 3.18% | 44% | 43% | 1% | 1% | 1%[lower-alpha 778] | 9% |
| Monmouth University | Aug 29 – Sep 1, 2020 | 401 (RV) | ± 4.9% | 45% | 47% | 3% | 0% | 1%[lower-alpha 779] | 3% |
| 401 (LV)[lower-alpha 780] | 46% | 48% | - | - | 3% | 3% | |||
| 401 (LV)[lower-alpha 781] | 46% | 48% | - | - | 3% | 3% | |||
| Fox News | Aug 29 – Sep 1, 2020 | 722 (LV) | ± 3.5% | 46% | 50% | 1% | 0% | 0%[lower-alpha 782] | 2% |
| 804 (RV) | ± 3.5% | 45% | 49% | 2% | 1% | 2%[lower-alpha 783] | 3% | ||
| SurveyMonkey/Axios | Aug 1–31, 2020 | 2,914 (LV) | – | 51% | 48% | - | - | – | 2% |
| East Carolina University | Aug 29–30, 2020 | 1,101 (LV) | ± 3.4% | 49% | 47% | - | - | 2%[lower-alpha 784] | 3% |
| Morning Consult | Aug 21–30, 2020 | 1,567 (LV) | ± (2%–4%) | 47% | 49% | - | - | – | – |
| Change Research/CNBC | Aug 21–23, 2020 | 560 (LV) | – | 47% | 48% | – | – | – | – |
| Morning Consult | Aug 14–23, 2020 | 1,541 (LV) | ± 2.0% | 46% | 49% | – | – | 1%[lower-alpha 785] | 3% |
| Redfield & Wilton Strategies | Aug 16–17, 2020 | 967 (LV) | ± 3.09% | 46% | 44% | 2% | 0% | 1%[lower-alpha 786] | 7% |
| Morning Consult | Aug 7–16, 2020 | 1,493 (LV) | ± (2%–4%) | 46% | 49% | - | - | – | – |
| East Carolina University | Aug 12–13, 2020 | 1,255 (RV) | ± 3.2% | 47% | 47% | – | – | 3%[lower-alpha 787] | 4% |
| Emerson College | Aug 8–10, 2020 | 673 (LV) | ± 3.8% | 51%[lower-alpha 788] | 49% | – | – | – | – |
| Harper Polling/Civitas | Aug 6–10, 2020 | 600 (LV) | ± 4.0% | 44% | 45% | 2% | 1% | 1%[lower-alpha 789] | 7% |
| Change Research/CNBC | Aug 7–9, 2020 | 493 (LV) | – | 48% | 47% | – | – | – | – |
| Pulse Opinion Research/Rasmussen Reports/American Greatness PAC[upper-alpha 8] | Aug 6–8, 2020 | 750 (LV) | ± 3.6% | 48%[lower-alpha 41] | 47% | – | – | – | – |
| Data for Progress | Jul 24 – Aug 2, 2020 | 1,170 (LV) | – | 45% | 49% | – | – | – | 6% |
| 44% | 46% | 2% | 1% | – | 7% | ||||
| Public Policy Polling/Giffords[upper-alpha 84] | Jul 30–31, 2020 | 934 (V) | – | 46% | 49% | – | – | – | 6% |
| YouGov/CBS | Jul 28–31, 2020 | 1,129 (LV) | ± 3.9% | 44% | 48% | – | – | 2%[lower-alpha 790] | 5% |
| HIT Strategies/DFER[upper-alpha 85] | Jul 23–31, 2020 | 400 (RV) | ± 4.9% | 37% | 47% | – | – | 4%[lower-alpha 791] | 10%[lower-alpha 792] |
| SurveyMonkey/Axios | Jul 1–31, 2020 | 3,466 (LV) | – | 50% | 49% | - | - | – | 2% |
| Change Research/CNBC | Jul 24–26, 2020 | 284 (LV) | – | 46% | 49% | – | – | – | – |
| Morning Consult | Jul 17–26, 2020 | 1,504 (LV) | ± 2.5% | 47% | 47% | – | – | – | – |
| Public Policy Polling/AFSCME[upper-alpha 6] | Jul 23–24, 2020 | 884 (V) | – | 46% | 49% | – | – | – | 5% |
| Cardinal Point Analytics | Jul 22–24, 2020 | 735 (LV) | ± 3.6% | 48% | 47% | 1% | – | – | 4% |
| Zogby Analytics | Jul 21–23, 2020 | 809 (RV) | ± 3.4% | 40% | 44% | 4% | 1% | – | 11% |
| Marist College/NBC News | Jul 14–22, 2020 | 882 (RV) | ± 4.0% | 44% | 51% | – | – | 2% | 4% |
| Redfield & Wilton Strategies | Jul 19–21, 2020 | 919 (LV) | – | 42% | 43% | 2% | 1% | 1% | 11% |
| Spry Strategies/American Principles Project[upper-alpha 86] | Jul 11–16, 2020 | 600 (LV) | ± 3.7% | 49% | 46% | – | – | – | 5% |
| Cardinal Point Analytics | Jul 13–15, 2020 | 547 (LV) | ± 4.2% | 49% | 48% | 1% | – | – | 3% |
| Change Research/CNBC | Jul 10–12, 2020 | 655 (LV) | – | 46% | 47% | – | – | – | – |
| Public Policy Polling | Jul 7–8, 2020 | 818 (V) | ± 3.4% | 46% | 50% | – | – | – | 5% |
| SurveyMonkey/Axios | Jun 8–30, 2020 | 1,498 (LV) | – | 49% | 49% | - | - | – | 1% |
| Change Research/CNBC | Jun 26–28, 2020 | 468 (LV)[lower-alpha 41] | – | 44% | 51% | – | – | – | – |
| East Carolina University | Jun 22–25, 2020 | 1,149 (RV) | ± 3.4% | 44% | 45% | – | – | 7%[lower-alpha 793] | 4% |
| Public Policy Polling | Jun 22–23, 2020 | 1,157 (V) | – | 46% | 48% | – | – | – | 6% |
| Fox News | Jun 20–23, 2020 | 1,012 (RV) | ± 3% | 45% | 47% | – | – | 5%[lower-alpha 794] | 3% |
| NYT Upshot/Siena College | Jun 8–18, 2020 | 653 (RV) | ± 4.1% | 40% | 49% | – | – | 4%[lower-alpha 795] | 7% |
| Gravis Marketing/OANN | Jun 17, 2020 | 631 (RV) | ± 3.9% | 46% | 43% | – | – | – | 10% |
| Redfield & Wilton Strategies | Jun 14–17, 2020 | 902 (LV) | ± 3.26% | 40% | 46% | 1% | 0% | 1% | 11% |
| Change Research/CNBC | Jun 12–14, 2020 | 378 (LV)[lower-alpha 41] | – | 45% | 47% | 1% | 1% | – | – |
| Public Policy Polling | Jun 2–3, 2020 | 913 (V) | ± 3.2% | 45% | 49% | – | – | – | 6% |
January 1, 2020 – May 31, 2020
| Poll source | Date(s) administered |
Sample size[lower-alpha 2] |
Margin of error |
Donald Trump (R) |
Joe Biden (D) |
Other | Undecided |
|---|---|---|---|---|---|---|---|
| Change Research/CNBC | May 29–31, 2020 | 806 (LV) | – | 45% | 46% | 4% | 4% |
| Harper Polling/Civitas | May 26–28, 2020 | 500 (LV) | ± 4.38% | 47% | 44% | – | 9% |
| Morning Consult | May 17–26, 2020 | 1,403 (LV) | – | 49% | 46% | – | – |
| Neighbourhood Research & Media | May 12–21, 2020 | 391 (LV) | – | 42% | 42% | – | – |
| Redfield & Wilton Strategies | May 10–14, 2020 | 859 (LV) | ± 3.3% | 43% | 45% | 3%[lower-alpha 796] | 8% |
| Meeting Street Insights (R) | May 9–13, 2020 | 500 (RV) | – | 47% | 47% | – | 6% |
| East Carolina University | May 7–9, 2020 | 1,111 (RV) | ± 3.4% | 46% | 43% | 7%[lower-alpha 797] | 4% |
| Civiqs/Daily Kos | May 2–4, 2020 | 1,362 (RV) | ± 3% | 46% | 49% | 4%[lower-alpha 798] | 2% |
| Meredith College | Apr 27–28, 2020 | 604 (RV) | ± 4.0% | 40% | 47% | 5%[lower-alpha 799] | 7% |
| SurveyUSA | Apr 23–26, 2020 | 580 (LV) | ± 5.5% | 45% | 50% | – | 5% |
| Public Policy Polling[upper-alpha 87] | Apr 20–21, 2020 | 1,275 (RV) | – | 46% | 49% | – | 5% |
| Garin-Hart-Yang/Put NC First (D) | Apr 13–18, 2020 | 800 (LV) | – | 45% | 48% | – | – |
| GBAO Strategies/PLUS Paid Family Leave | Apr 13–16, 2020 | 500 (LV) | – | 46% | 48% | 1% | 4% |
| Public Policy Polling | Apr 14–15, 2020 | 1,318 (V) | – | 47% | 48% | – | 5% |
| Harper Polling | Apr 5–7, 2020 | 500 (LV) | ± 4.4% | 49% | 42% | – | 9% |
| East Carolina University | Feb 27–28, 2020 | 1,288 (RV) | ± 3.2% | 46% | 48% | – | – |
| NBC News/Marist College | Feb 23–27, 2020 | 2,120 (RV) | ± 2.4% | 45% | 49% | 1% | 5% |
| SurveyUSA | Feb 13–16, 2020 | 2,366 (RV) | ± 2.5% | 45% | 49% | – | 6% |
| Climate Nexus | Feb 11–15, 2020 | 675 (RV) | ± 3.9% | 44% | 46% | – | 11% |
January 1, 2018 – December 31, 2019
| Poll source | Date(s) administered |
Sample size[lower-alpha 2] |
Margin of error |
Donald Trump (R) |
Joe Biden (D) |
Other | Undecided |
|---|---|---|---|---|---|---|---|
| Fox News | Nov 10–13, 2019 | 1,504 (RV) | ± 2.5% | 43% | 45% | 5% | 5% |
| NYT Upshot/Siena College | Oct 13–26, 2019 | 651 (LV) | ± 4.4% | 48% | 46% | – | – |
| East Carolina University | Oct 2–9, 2019 | 1,076 (RV) | ± 3.0% | 46% | 50% | 4% | –[lower-alpha 800] |
| Meredith College | Sep 29 – Oct 7, 2019 | 996 (RV) | ± 3.0% | 38% | 35% | 20%[lower-alpha 801] | 7% |
| Public Policy Polling | Oct 4–6, 2019 | 963 (V) | ± 3.2% | 46% | 51% | – | 4% |
| SurveyUSA | Aug 1–5, 2019 | 2,113 (RV) | ± 2.7% | 41% | 49% | – | 10% |
| Harper Polling | Aug 1–4, 2019 | 500 (LV) | ± 4.4% | 45% | 44% | – | 11% |
| Fabrizio Ward/AARP | Jul 29–31, 2019 | 600 (LV) | ± 4.0% | 45% | 49% | – | 5% |
| Public Policy Polling | Jun 17–18, 2019 | 610 (RV) | ± 4.0% | 46% | 49% | – | 5% |
| Emerson College | May 31 – Jun 3, 2019 | 932 (RV) | ± 3.1% | 44% | 56% | – | – |
| Spry Strategies (R)[upper-alpha 88] | May 25 – Jun 1, 2019 | 730 (LV) | – | 52% | 41% | – | 7% |
| Harper Polling | Feb 11–13, 2019 | 500 (LV) | ± 4.4% | 43% | 39% | 7% | 11% |
| Public Policy Polling | Jan 4–7, 2019 | 750 (RV) | ± 3.6% | 44% | 49% | – | 7% |
| Meredith College | Jan 21–25, 2018 | 621 (RV) | ± 4.0% | 45% | 46% | 8% | 1% |
North Dakota
Polls with a sample size of <100 have their sample size entries marked in red to indicate a lack of reliability.
Aggregate polls
| Source of poll aggregation |
Dates administered |
Dates updated |
Joe Biden Democratic |
Donald Trump Republican |
Other/ Undecided [lower-alpha 1] |
Margin |
|---|---|---|---|---|---|---|
| 270 to Win | September 26 – October 17, 2020 | October 19, 2020 | 38.0% | 57.5% | 4.5% | Trump +19.5 |
| FiveThirtyEight | until October 25, 2020 | October 27, 2020 | 38.2% | 56.3% | 5.5% | Trump +18.1 |
| Average | 38.1% | 56.9% | 5.0% | Trump +18.8 | ||
Polls
| Poll source | Date(s) administered |
Sample size[lower-alpha 2] |
Margin of error |
Donald Trump Republican |
Joe Biden Democratic |
Jo Jorgensen Libertarian |
Other | Undecided |
|---|---|---|---|---|---|---|---|---|
| SurveyMonkey/Axios | Oct 20 – Nov 2, 2020 | 402 (LV) | ± 7% | 59%[lower-alpha 802] | 39% | - | – | – |
| SurveyMonkey/Axios | Oct 1–28, 2020 | 700 (LV) | – | 57% | 42% | - | – | – |
| SurveyMonkey/Axios | Sep 1–30, 2020 | 249 (LV) | – | 63% | 34% | - | – | 3% |
| DFM Research/North Dakota Voters First | Sep 26–29, 2020 | 460 (A) | ± 4.6% | 51% | 37% | - | 4%[lower-alpha 803] | 7% |
| DFM Research/North Dakota Voters First | Sep 12–16, 2020 | 500 (LV) | ± 4.5% | 56% | 37% | - | 3%[lower-alpha 804] | 4% |
| SurveyMonkey/Axios | Aug 1–31, 2020 | 269 (LV) | – | 66% | 32% | - | – | 2% |
| SurveyMonkey/Axios | Jul 1–31, 2020 | 261 (LV) | – | 63% | 36% | - | – | 1% |
| SurveyMonkey/Axios | Jun 8–30, 2020 | 88 (LV) | – | 71% | 28% | - | – | 1% |
| DFM Research | Mar 3–5, 2020 | 400 (LV) | ± 4.9% | 55% | 38% | - | 2% | 5% |
| DFM Research | Jan 28 – Feb 1, 2020 | 600 (A) | ± 4.0% | 59% | 34% | - | 2% | 5% |
| 1892 Polling/Doug Burgum[upper-alpha 89] | Jul 15–17, 2019 | 500 (LV) | ± 4.4% | 60% | 34% | - | – | – |
| DFM Research | May 14–18, 2019 | 400 (A) | ± 4.9% | 54% | 39% | - | 2% | 5% |
Ohio
Graphical summary
Aggregate polls
| Source of poll aggregation |
Dates administered |
Dates updated |
Joe Biden Democratic |
Donald Trump Republican |
Other/ Undecided [lower-alpha 1] |
Margin |
|---|---|---|---|---|---|---|
| 270 to Win | October 22 – November 1, 2020 | November 2, 2020 | 47.0% | 48.4% | 4.6% | Trump +1.4 |
| Real Clear Politics | October 17–31, 2020 | November 1, 2020 | 46.8% | 47.0% | 6.2% | Trump +0.2 |
| FiveThirtyEight | until November 1, 2020 | November 2, 2020 | 47.1% | 47.5% | 5.4% | Trump +0.4 |
| Average | 47.0% | 47.6% | 5.4% | Trump +0.6 | ||
June 1, 2020 – October 31, 2020
| Poll source | Date(s) administered |
Sample size[lower-alpha 2] |
Margin of error |
Donald Trump Republican |
Joe Biden Democratic |
Jo Jorgensen Libertarian |
Howie Hawkins Green |
Other | Undecided |
|---|---|---|---|---|---|---|---|---|---|
| SurveyMonkey/Axios | Oct 20 – Nov 2 | 6,025 (LV) | ± 2% | 51%[lower-alpha 805] | 47% | – | – | – | – |
| Pulse Opinion Research/Rasmussen Reports | Oct 31 – Nov 1 | 800 (LV) | ± 3.5% | 49% | 45% | – | – | 3%[lower-alpha 806] | – |
| Research Co. | Oct 31 – Nov 1 | 450 (LV) | ± 4.6% | 47% | 47% | – | – | 2%[lower-alpha 807] | 4% |
| Swayable | Oct 27 – Nov 1 | 516 (LV) | ± 5.8% | 52% | 47% | 1% | 0% | – | – |
| Civiqs/Daily Kos | Oct 29 – Nov 1 | 1,136 (LV) | ± 3% | 49% | 48% | – | – | 1%[lower-alpha 808] | 1% |
| Quinnipiac University | Oct 28 – Nov 1 | 1,440 (LV) | ± 2.6% | 43% | 47% | – | – | 2%[lower-alpha 809] | 8% |
| Survey Monkey/Tableau | Oct 20 – Nov 1 | 5,305 (LV) | ± 2.0% | 50% | 47% | – | – | – | |
| Trafalgar Group | Oct 30–31 | 1,041 (LV) | ± 2.96% | 49% | 44% | – | – | – | – |
| Emerson College | Oct 29–31 | 656 (LV) | ± 3.8% | 49%[lower-alpha 810] | 50% | – | – | 2%[lower-alpha 811] | – |
| Morning Consult | Oct 22–31 | 2,179 (LV) | ± 2% | 49% | 47% | – | – | – | – |
| AtlasIntel | Oct 29–30 | 660 (LV) | ± 4% | 50% | 47% | – | – | 3% | – |
| Gravis Marketing | Oct 27–28 | 613 (LV) | ± 4% | 49% | 47% | – | – | – | 4% |
| SurveyMonkey/Axios | Oct 1–28, 2020 | 8,089 (LV) | – | 51% | 47% | – | – | – | – |
| Quinnipiac University | Oct 23–27 | 1,186 (LV) | ± 2.9% | 43% | 48% | – | – | 1%[lower-alpha 812] | 8% |
| Swayable | Oct 23–26 | 440 (LV) | ± 6.3% | 55% | 44% | 1% | 0% | – | – |
| Wick Surveys | Oct 24–25 | 1,000 (LV) | ± 3.1% | 49% | 47% | – | – | – | – |
| Citizen Data | Oct 17–20 | 1,000 (LV) | ± 3% | 44% | 43% | 2% | 1% | 2% | 8% |
| Fox News | Oct 17–20 | 1,018 (LV) | ± 3% | 48% | 45% | 3% | 1% | 1%[lower-alpha 813] | 3% |
| Morning Consult | Oct 11–20 | 2,271 (LV) | ± 2.1% | 49% | 47% | – | – | – | – |
| Pulse Opinion Research/Rasmussen Reports | Oct 18–19 | 800 (LV) | ± 3.5% | 47% | 48% | – | – | 2%[lower-alpha 814] | 4% |
| Quinnipiac University | Oct 8–12 | 1,160 (LV) | ± 2.9% | 47% | 48% | – | – | 2%[lower-alpha 815] | 4% |
| Civiqs/Rust Belt Rising[upper-alpha 53] | Oct 8–11 | 586 (LV) | ± 4.2% | 50% | 47% | – | – | 2%[lower-alpha 816] | 1% |
| Morning Consult | Oct 2–11 | 2,283 (LV) | ± 2.1% | 49% | 46% | – | – | – | – |
| Baldwin Wallace University | Sep 30 – Oct 8 | 1,009 (LV) | ± 3.1% | 47% | 45% | 1% | 0% | 1%[lower-alpha 817] | 5% |
| Siena College/NYT Upshot | Oct 2–6 | 661 (LV) | ± 4.3% | 44% | 45% | 2% | 1% | 0%[lower-alpha 818] | 7%[lower-alpha 819] |
| Trafalgar Group | Oct 1–3 | 1,035 (LV) | ± 2.97% | 48% | 44% | 3% | 1% | 1%[lower-alpha 820] | 4% |
| YouGov/CBS | Sep 30 – Oct 2 | 1,114 (LV) | ± 3.7% | 47% | 47% | – | – | 1%[lower-alpha 821] | 5% |
| OnMessage Inc./American Action Forum[upper-alpha 10] | Sep 28 – Oct 1 | 800 (LV) | ± 3.46% | 48% | 47% | 2% | 1% | 0%[lower-alpha 822] | 3% |
| SurveyMonkey/Axios | Sep 1–30 | 4,012 (LV) | – | 51% | 47% | – | – | – | 2% |
| Hart Research Associates/Human Rights Campaign[upper-alpha 90] | Sep 24–27 | 400 (LV) | ± 4.9% | 49% | 47% | – | – | – | – |
| Fox News | Sep 20–23 | 830 (LV) | ± 3% | 45% | 50% | 1% | 1% | 0%[lower-alpha 823] | 2% |
| 907 (RV) | ± 3% | 44% | 49% | 1% | 2% | 2%[lower-alpha 824] | 3% | ||
| Quinnipiac University | Sep 17–21 | 1,078 (LV) | ± 3% | 47% | 48% | – | – | 2% | 4% |
| Baldwin Wallace University | Sep 9–22 | 1,011 (LV) | ± 3.3% | 44% | 45% | 2% | 0% | 1%[lower-alpha 825] | 7% |
| Civiqs/Rust Belt Rising[upper-alpha 53] | Sep 11–15 | 556 (RV) | ± 4.3% | 48%[lower-alpha 826] | 45% | – | – | 5%[lower-alpha 827] | 1% |
| Morning Consult | Aug 29 – Sep 7 | 1,963 (LV) | ± (2%–4%) | 50%[lower-alpha 828] | 45% | – | – | – | – |
| OnMessage Inc./American Action Forum[upper-alpha 10] | Aug 31 – Sep 3 | 800 (LV) | ± 3.46% | 51% | 45% | – | – | 2%[lower-alpha 829] | 3% |
| Pulse Opinion Research/Rasmussen Reports | Sep 1–2 | 1,000 (LV) | ± 3% | 47%[lower-alpha 830] | 51% | – | – | 3%[lower-alpha 831] | – |
| ALG Research/Progressive Policy Institute[upper-alpha 91] | Aug 26 – Sep 1 | 500 (LV) | – | 46% | 48% | – | – | – | – |
| SurveyMonkey/Axios | Aug 1–31 | 3,220 (LV) | – | 51% | 48% | – | – | – | 2% |
| Morning Consult | Aug 21–30 | 1,811 (LV) | ± (2%–4%) | 50% | 45% | – | – | – | – |
| Civiqs/Rust Belt Rising[upper-alpha 53] | Aug 13–17 | 631 (RV) | – | 47% | 47% | – | – | 4%[lower-alpha 832] | 2% |
| Morning Consult | Aug 7–16 | 1,744 (LV) | ± (2%–4%) | 49% | 45% | – | – | – | – |
| TargetSmart/Progress Ohio[upper-alpha 92] | Jul 28 – Aug 3 | 1,249 (LV) | ± 3.6% | 46% | 47% | – | – | 8%[lower-alpha 833] | – |
| SurveyMonkey/Axios | Jul 1–31 | 3,694 (LV) | – | 52% | 46% | – | – | – | 2% |
| Morning Consult | Jul 17–26 | 1,741 (LV) | ± 2.3% | 48% | 45% | – | – | – | – |
| YouGov/CBS | Jul 21–24 | 1,211 (LV) | ± 3.6% | 46% | 45% | – | – | 2%[lower-alpha 834] | 7% |
| Zogby Analytics | Jul 21–23 | 805 (RV) | ± 3.5% | 41% | 43% | 4% | 1% | – | 11% |
| Pulse Opinion Research/Rasmussen Reports/AGPAC[upper-alpha 8] | Jul 15–16 | 750 (LV) | ± 4% | 46% | 50% | – | – | 2%[lower-alpha 835] | 2% |
| University of Akron | Jun 24 – Jul 15 | 1,037 (RV) | ± 3.0% | 42% | 46% | – | – | 6%[lower-alpha 836] | 6% |
| SurveyMonkey/Axios | Jun 8–30 | 1,610 (LV) | – | 50% | 49% | – | – | – | 1% |
| Quinnipiac | Jun 18–22 | 1,139 (RV) | ± 2.9% | 45% | 46% | – | – | 4%[lower-alpha 837] | 5% |
| Fox News | May 30 – Jun 2 | 803 (RV) | ± 3.5% | 43% | 45% | – | – | 6%[lower-alpha 838] | 6% |
January 1, 2020 – May 31, 2020
| Poll source | Date(s) administered |
Sample size[lower-alpha 2] |
Margin of error |
Donald Trump (R) |
Joe Biden (D) |
Other | Undecided | |
|---|---|---|---|---|---|---|---|---|
| Morning Consult | May 17–26 | 1,720 (LV) | – | 50% | 42% | – | – | |
| Emerson College | May 8–10 | 725 (RV) | ± 3.5% | 51%[lower-alpha 839] | 49% | – | – | |
| Baldwin Wallace University/Oakland University/Ohio Northern University | Apr 20–25 | 797 (RV) | ± 3.7% | 44% | 45% | – | 11% | |
| Baldwin Wallace University Great Lakes | Mar 17–25 | 1,025 (RV) | ± 3.3% | 47% | 43% | – | 10% | |
| Change Research | Mar 21–23 | 510 (LV) | – | 52% | 44% | – | 5% | |
| NBC News/Wall Street Journal/Marist College | Mar 10–13 | 1,710 (RV) | ± 2.9% | 45% | 49% | 1% | 5% | |
January 1, 2018 – December 31, 2019
| Poll source | Date(s) administered |
Sample size[lower-alpha 2] |
Margin of error |
Donald Trump (R) |
Joe Biden (D) |
Other | Undecided |
|---|---|---|---|---|---|---|---|
| Public Policy Polling | Oct 10–11, 2019 | 776 (V) | ± 3.5% | 46% | 48% | – | 6% |
| Climate Nexus[lower-alpha 840] | Oct 1–7, 2019 | 1112 (LV) | ± 2.9% | 47% | 53% | – | – |
| 42% | 48% | – | 10% | ||||
| Emerson College | Sep 29 – Oct 2, 2019 | 837 (RV) | ± 3.2% | 47% | 53% | – | – |
| Quinnipiac University | Jul 17–22, 2019 | 1,431 (RV) | ± 3.2% | 42% | 50% | – | – |
| Public Policy Polling | Nov 27–28, 2018 | 648 (V) | ± 3.9% | 44% | 48% | – | 8% |
Oklahoma

Aggregate polls
| Source of poll aggregation |
Dates administered |
Dates updated |
Joe Biden Democratic |
Donald Trump Republican |
Other/ Undecided [lower-alpha 1] |
Margin |
|---|---|---|---|---|---|---|
| 270 to Win | September 17, 2020 – October 20, 2020 | October 28, 2020 | 38.5% | 58.5% | 3.0% | Trump +20.0 |
| FiveThirtyEight | until October 27, 2020 | October 28, 2020 | 36.4% | 58.3% | 5.3% | Trump +21.9 |
| Average | 37.5% | 58.4% | 4.1% | Trump +20.9 | ||
Polls
| Poll source | Date(s) administered |
Sample size[lower-alpha 2] |
Margin of error |
Donald Trump Republican |
Joe Biden Democratic |
Jo Jorgensen Libertarian |
Other | Undecided |
|---|---|---|---|---|---|---|---|---|
| SurveyMonkey/Axios | Oct 20 – Nov 2, 2020 | 1,902 (LV) | ± 3% | 65%[lower-alpha 841] | 35% | - | – | – |
| SurveyMonkey/Axios | Oct 1–28, 2020 | 3,191 (LV) | – | 59% | 40% | - | – | – |
| SoonerPoll/News 9/News on 6 | Oct 15–20, 2020 | 5,466 (LV) | ± 1.33% | 59% | 37% | 1% | 2%[lower-alpha 842] | 2% |
| SurveyMonkey/Axios | Sep 1–30, 2020 | 1,174 (LV) | – | 63% | 35% | - | – | 2% |
| Amber Integrated | Sep 17–20, 2020 | 500 (LV) | ± 4.38% | 55% | 33% | 1% | 5%[lower-alpha 843] | 6% |
| SoonerPoll/News9 | Sep 2–8, 2020 | 486 (LV) | ± 4.45% | 60% | 35% | - | 1%[lower-alpha 844] | 4% |
| SoonerPoll | Aug 13–31, 2020 | 379 (LV) | ± 5.03% | 60% | 35% | - | 2%[lower-alpha 845] | 4% |
| SurveyMonkey/Axios | Aug 1–31, 2020 | 1,009 (LV) | – | 64% | 35% | - | – | 2% |
| SurveyMonkey/Axios | Jul 1–31, 2020 | 1,410 (LV) | – | 64% | 34% | - | – | 4% |
| DFM Research/Abby Broyles for US Senate[upper-alpha 93] | Jul 29–30, 2020 | 572 (LV) | ± 4.1% | 56% | 36% | - | 5%[lower-alpha 846] | 3% |
| SurveyMonkey/Axios | Jun 8–30, 2020 | 591 (LV) | – | 61% | 37% | - | – | 1% |
| Amber Integrated | Jun 3–4, 2020 | 500 (LV) | ± 4.4% | 55% | 36% | - | 4%[lower-alpha 847] | 5% |
| Amber Integrated | Mar 5–8, 2020 | 500 (LV) | ± 4.4 % | 57% | 33% | - | 4% | 5% |
| Cole Hargrave Snodgrass & Associates/OK Sooner |
Feb 10–13, 2020 | 500 (RV) | ± 4.3% | 62% | 34% | - | – | 4% |
Oregon
Graphical summary
Polls
Aggregate polls
| Source of poll aggregation |
Dates administered |
Dates updated |
Joe Biden Democratic |
Donald Trump Republican |
Other/ Undecided [lower-alpha 1] |
Margin |
|---|---|---|---|---|---|---|
| 270 to Win | September 26 – October 17, 2020 | October 20, 2020 | 58.0% | 38.5% | 3.5% | Biden +19.5 |
| FiveThirtyEight | until October 27, 2020 | October 28, 2020 | 57.5% | 38.0% | 4.5% | Biden +19.5 |
| Average | 57.8% | 38.3% | 3.9% | Biden +19.5 | ||
Polls
| Poll source | Date(s) administered |
Sample size[lower-alpha 2] |
Margin of error |
Donald Trump Republican |
Joe Biden Democratic |
Jo Jorgensen Libertarian |
Howie Hawkins Pacific Green |
Other | Undecided |
|---|---|---|---|---|---|---|---|---|---|
| SurveyMonkey/Axios | Oct 20 – Nov 2, 2020 | 3,543 (LV) | ± 2.5% | 39%[lower-alpha 848] | 59% | - | - | – | – |
| Swayable | Oct 23 – Nov 1, 2020 | 324 (LV) | ± 7.3% | 37% | 60% | 1% | 1% | – | – |
| SurveyMonkey/Axios | Oct 1–28, 2020 | 5,422 (LV) | – | 38% | 61% | - | - | – | – |
| SurveyMonkey/Axios | Sep 1–30, 2020 | 2,109 (LV) | – | 38% | 61% | - | - | – | 2% |
| Civiqs/Daily Kos | Sep 26–29, 2020 | 944 (LV) | ± 3.5% | 39% | 56% | - | - | 3%[lower-alpha 849] | 2% |
| DHM Research | Sep 3–8, 2020 | 502 (LV) | ± 4% | 39% | 51% | - | - | 6%[lower-alpha 850] | 4% |
| SurveyMonkey/Axios | Aug 1–31, 2020 | 1,648 (LV) | – | 38% | 60% | - | - | – | 2% |
| SurveyMonkey/Axios | Jul 1–31, 2020 | 1,890 (LV) | – | 38% | 61% | - | - | – | 1% |
| SurveyMonkey/Axios | Jun 8–30, 2020 | 872 (LV) | – | 39% | 59% | - | - | – | 2% |
Pennsylvania
Graphical summary
Aggregate polls
| Source of poll aggregation |
Dates administered |
Dates updated |
Joe Biden Democratic |
Donald Trump Republican |
Other/ Undecided [lower-alpha 1] |
Margin |
|---|---|---|---|---|---|---|
| 270 to Win | October 22 – November 2, 2020 | November 3, 2020 | 49.4% | 45.7% | 4.9% | Biden +3.7 |
| Real Clear Politics | October 29 – November 2, 2020 | November 3, 2020 | 48.7% | 47.5% | 3.8% | Biden +1.2 |
| FiveThirtyEight | until November 2, 2020 | November 3, 2020 | 50.2% | 45.6% | 4.2% | Biden +4.6 |
| Average | 49.4% | 46.3% | 4.3% | Biden +3.1 | ||
2020 polls
| Poll source | Date(s) administered |
Sample size[lower-alpha 2] |
Margin of error |
Donald Trump Republican |
Joe Biden Democratic |
Jo Jorgensen Libertarian |
Howie Hawkins Green |
Other | Undecided |
|---|---|---|---|---|---|---|---|---|---|
| Susquehanna Polling & Research Inc. | Nov 1–2 | 499 (LV) | ± 4.3% | 49%[lower-alpha 851] | 48% | 1% | - | 0%[lower-alpha 852] | 0% |
| SurveyMonkey/Axios | Oct 20 – Nov 2 | 6,045 (LV) | ± 2% | 47%[lower-alpha 853] | 52% | - | - | – | – |
| Pulse Opinion Research/Rasmussen Reports | Oct 31 – Nov 1 | 800 (LV) | ± 3.5% | 47%[lower-alpha 854] | 50% | - | - | 1%[lower-alpha 855] | – |
| Research Co. | Oct 31 – Nov 1 | 450 (LV) | ± 4.6% | 46% | 52% | - | - | 2%[lower-alpha 856] | 4% |
| AYTM/Aspiration | Oct 30 – Nov 1 | 340 (LV) | – | 49% | 51% | - | - | – | – |
| Change Research/CNBC | Oct 29 – Nov 1 | 699 (LV) | ± 3.71% | 46% | 50% | 2% | - | – | 2% |
| Marist College/NBC | Oct 29 – Nov 1 | 772 (LV) | ± 4.4% | 46% | 51% | - | - | 1% | 2% |
| Monmouth University | Oct 28 – Nov 1 | 502(RV) | ± 4.4% | 45% | 50% | 1% | - | 0%[lower-alpha 857] | 4% |
| 502 (LV) | 44%[lower-alpha 858] | 51% | - | - | – | – | |||
| 45%[lower-alpha 859] | 50% | - | - | – | – | ||||
| Swayable | Oct 27 – Nov 1 | 1,107 (LV) | ± 3.9% | 48% | 50% | 2% | - | – | – |
| Data for Progress | Oct 27 – Nov 1 | 1,417 (LV) | ± 2.6% | 45% | 52% | 2% | 0% | 0%[lower-alpha 860] | – |
| Ipsos/Reuters | Oct 27 – Nov 1 | 673 (LV) | ± 4.3% | 45%[lower-alpha 14] | 51% | 1% | 1% | 2%[lower-alpha 861] | – |
| 44%[lower-alpha 862] | 51% | - | - | 3%[lower-alpha 863] | 2% | ||||
| 46%[lower-alpha 864] | 52% | - | - | 2%[lower-alpha 865] | – | ||||
| Trafalgar | Oct 30–31 | 1,062 (LV) | ± 2.93% | 48% | 46% | 2% | - | 1%[lower-alpha 866] | 4% |
| Frederick Polls/Compete Everywhere[upper-alpha 94] | Oct 30–31 | 879 (LV) | ± 3% | 48% | 52% | - | - | – | – |
| Insider Advantage/Center for American Greatness[upper-alpha 8] | Oct 30–31 | 500 (LV) | ± 4.4% | 48.7% | 47.4% | 1.3% | - | – | 2.6% |
| Siena College/NYT Upshot | Oct 26–31 | 1,862 (LV) | ± 2.4% | 43% | 49% | 2% | - | 0%[lower-alpha 867] | 5%[lower-alpha 868] |
| Morning Consult | Oct 22–31 | 2,686 (LV) | ± 2% | 43% | 52% | - | - | – | – |
| Emerson College | Oct 29–30 | 823 (LV) | ± 3.3% | 47%[lower-alpha 869] | 52% | - | - | 2%[lower-alpha 870] | – |
| AtlasIntel | Oct 29–30 | 672 (LV) | ± 4% | 50% | 49% | - | - | 2% | – |
| Targoz Market Research/PollSmart | Oct 25–30 | 998 (LV) | – | 42% | 56% | - | - | 2%[lower-alpha 871] | – |
| Public Policy Polling/American Bridge PAC[upper-alpha 95] | Oct 28–29 | 1,012 (V) | – | 45% | 52% | - | - | – | 3% |
| Redfield & Wilton Strategies | Oct 26–29 | 2,125 (LV) | – | 45% | 50% | 1% | - | 1% | 3% |
| Harvard-Harris/The Hill | Oct 26–29 | 901 (LV) | – | 46% | 51% | - | - | – | 3% |
| ABC/Washington Post | Oct 24–29 | 824 (LV) | ± 4% | 44% | 51% | 3% | - | 0%[lower-alpha 872] | 1% |
| Muhlenberg College/Morning Call | Oct 23–28 | 419 (LV) | ± 5.5% | 44% | 49% | - | - | 4%[lower-alpha 873] | 2% |
| SurveyMonkey/Axios | Oct 1–28 | 10,599 (LV) | ± 1.5% | 46% | 52% | - | - | – | - |
| RMG Research/PoliticalIQ | Oct 25–27 | 800 (LV) | ± 3.5% | 45%[lower-alpha 14] | 51% | - | - | 2% | 2% |
| 44%[lower-alpha 874] | 52% | - | - | 2% | 2% | ||||
| 47%[lower-alpha 875] | 49% | - | - | 2% | 2% | ||||
| Quinnipiac University | Oct 23–27 | 1,324 (LV) | ± 2.7% | 44% | 51% | - | - | 1%[lower-alpha 876] | 4% |
| Swayable | Oct 23–26 | 491 (LV) | ± 6% | 46% | 52% | 2% | - | – | – |
| Civiqs/Daily Kos | Oct 23–26 | 1,145 (LV) | ± 3% | 45% | 52% | - | - | 2%[lower-alpha 877] | 1% |
| Ipsos/Reuters | Oct 20–26 | 655 (LV) | ± 4.4% | 44%[lower-alpha 14] | 51% | 3% | 0% | 1%[lower-alpha 878] | – |
| 45%[lower-alpha 879] | 50% | - | - | 3%[lower-alpha 880] | 2% | ||||
| Insider Advantage/Center for American Greatness[upper-alpha 8] | Oct 25 | 400 (LV) | ± 4.9% | 48.5% | 45.5% | 3.3% | - | – | 2.8% |
| Trafalgar Group | Oct 24–25 | 1,076 (LV) | ± 2.91% | 48% | 48% | 2% | - | 1%[lower-alpha 881] | 1% |
| Wick Surveys | Oct 24–25 | 1,000 (LV) | ± 3.1% | 49% | 47% | - | - | – | – |
| Franklin & Marshall College | Oct 19–25 | 558 (LV) | ± 5% | 44% | 50% | 2% | - | 1%[lower-alpha 882] | 3% |
| Univision/University of Houston/Latino Decisions/North Star Opinion Research |
Oct 17–25 | 723 (RV) | ± 3.64% | 45% | 50% | - | - | 3%[lower-alpha 883] | 2% |
| Gravis Marketing | Oct 23 | 602 (LV) | ± 4% | 44% | 51% | - | - | – | 5% |
| Public Policy Polling/American Bridge PAC[upper-alpha 96] | Oct 21–22 | 980 (V) | – | 46% | 51% | - | - | – | 4% |
| Civiqs/Dan Hopkins | Oct 17–21 | 1,577 (A) | 3% | 46% | 52% | - | - | – | 2% |
| YouGov/University of Wisconsin-Madison | Oct 13–21 | 669 (LV) | ± 4.45% | 44% | 52% | - | - | 3%[lower-alpha 884] | – |
| Citizen Data | Oct 17–20 | 1,000 (LV) | ± 3.1% | 39% | 44% | 9% | 0% | 1% | 7% |
| CNN/SSRS | Oct 15–20 | 843 (LV) | ± 4% | 43% | 53% | 2% | - | 1%[lower-alpha 885] | 1% |
| Muhlenberg College/Morning Call | Oct 13–20 | 416 (LV) | ± 5.5% | 44% | 51% | - | - | 2%[lower-alpha 886] | 4% |
| Morning Consult | Oct 11–20 | 2,563 (LV) | ± 1.9% | 43% | 52% | - | - | – | – |
| Fox News | Oct 18–19 | 1,045 (LV) | ± 3% | 45% | 50% | 1% | - | 1%[lower-alpha 887] | 2% |
| Pulse Opinion Research/Rasmussen Reports | Oct 18–19 | 800 (LV) | ± 3.5% | 47% | 50% | - | - | 2%[lower-alpha 888] | 3% |
| Quinnipiac University | Oct 16–19 | 1,241 (LV) | ± 2.8% | 43% | 51% | - | - | 1%[lower-alpha 889] | 5% |
| Change Research/CNBC | Oct 16–19 | 574 (LV)[lower-alpha 41] | – | 47% | 49% | - | - | – | – |
| Suffolk University/USA Today | Oct 15–19 | 500 (LV) | ± 4.4% | 42% | 49% | 1% | - | 4%[lower-alpha 890] | 4% |
| Ipsos/Reuters | Oct 13–19 | 653 (LV) | ± 4.4% | 45%[lower-alpha 14] | 49% | 2% | 0% | 3%[lower-alpha 891] | – |
| 45%[lower-alpha 892] | 49% | - | - | 3%[lower-alpha 893] | 4% | ||||
| Trafalgar Group/Restoration PAC[upper-alpha 52] | Oct 13–15 | 1,041 (LV) | ± 2.96% | 46% | 48% | 3% | - | 2%[lower-alpha 894] | 2% |
| HarrisX/The Hill | Oct 12–15 | 1,289 (LV) | – | 46% | 51% | - | - | – | – |
| Insider Advantage/Center for American Greatness[upper-alpha 8] | Oct 12–13 | 400 (LV) | ± 4.9% | 43% | 46% | 2% | - | – | 9% |
| Redfield & Wilton Strategies | Oct 10–13 | 1,289 (LV) | – | 43%[lower-alpha 41] | 51% | 1% | 0% | – | – |
| Trafalgar Group | Oct 10–12 | 1,034 (LV) | ± 2.97% | 45% | 47% | 3% | - | 3%[lower-alpha 895] | 2% |
| RMG Research/PoliticalIQ | Oct 7–12 | 800 (LV) | – | 43%[lower-alpha 14] | 49% | 1% | – | 1% | 6% |
| 42%[lower-alpha 896] | 50% | 1% | – | 1% | 6% | ||||
| 45%[lower-alpha 897] | 47% | 1% | – | 1% | 6% | ||||
| Civiqs/Rust Belt Rising[upper-alpha 53] | Oct 8–11 | 600 (LV) | ± 4.2% | 45% | 52% | - | - | 2%[lower-alpha 898] | 1% |
| Ipsos/Reuters | Oct 6–11 | 622 (LV) | ± 4.5% | 45%[lower-alpha 14] | 51% | 1% | 0% | 2%[lower-alpha 899] | – |
| 44%[lower-alpha 900] | 51% | - | - | 1%[lower-alpha 901] | 4% | ||||
| Morning Consult | Oct 2–11 | 2,610 (LV) | ± 1.9% | 44% | 52% | - | - | – | – |
| Redfield & Wilton Strategies | Oct 9–10 | 1,145 (LV) | – | 44%[lower-alpha 41] | 49% | 1% | - | – | – |
| Whitman Insight Strategies | Oct 5–9 | 517 (LV) | ± 4.3% | 46% | 51% | - | - | 1%[lower-alpha 902] | 3% |
| Baldwin Wallace University | Sep 30 – Oct 8 | 1,140 (LV) | ± 3.1% | 45% | 50% | 1% | 0% | 0%[lower-alpha 903] | 4% |
| YouGov/CCES | Sep 29 – Oct 7 | 2,703 (LV) | – | 44% | 52% | - | - | – | – |
| Redfield & Wilton Strategies | Oct 4–6 | 927 (LV) | ± 3.22% | 42% | 49% | 1% | - | 1%[lower-alpha 904] | 7% |
| Emerson College | Oct 4–5 | 688 (LV) | ± 3.7% | 47%[lower-alpha 905] | 51% | - | - | 2%[lower-alpha 906] | – |
| Quinnipiac University | Oct 1–5 | 1,211 (LV) | ± 2.8% | 41% | 54% | - | - | 1%[lower-alpha 907] | 3% |
| Ipsos/Reuters | Sep 29 – Oct 5 | 605 (LV) | ± 4.5% | 45% | 50% | - | - | 2%[lower-alpha 908] | 3% |
| Change Research/CNBC | Oct 2–4 | 468 (LV) | – | 46% | 50% | - | - | – | – |
| Monmouth University | Sep 30 – Oct 4 | 500 (RV) | ± 4.4% | 42% | 54% | 1% | - | 0%[lower-alpha 909] | 2% |
| 500 (LV) | 43%[lower-alpha 910] | 54% | - | - | – | – | |||
| 45%[lower-alpha 911] | 53% | - | - | – | – | ||||
| YouGov/CBS | Sep 30 – Oct 2 | 1,287 (LV) | ± 3.2% | 44% | 51% | - | - | 2%[lower-alpha 912] | 5% |
| Siena College/NYT Upshot | Sep 30 – Oct 2 | 706 (LV) | ± 4.1% | 42% | 49% | 3% | - | 0%[lower-alpha 913] | 5%[lower-alpha 914] |
| SurveyMonkey/Axios | Sep 1–30 | 4,613 (LV) | – | 46% | 52% | - | - | – | 2% |
| ABC News/Washington Post | Sep 21–26 | 567 (LV) | ± 5.0% | 45% | 54% | - | - | 0%[lower-alpha 915] | 1% |
| Siena College/NYT Upshot | Sep 25–27 | 711 (LV) | ± 4.3% | 40% | 49% | 2% | - | 0%[lower-alpha 916] | 8%[lower-alpha 917] |
| TIPP/The Federalist | Sep 24–26 | 774 (LV) | ± 3.6% | 45% | 50% | - | - | 1%[lower-alpha 918] | 4% |
| Redfield & Wilton Strategies | Sep 23–25 | 1,015 (LV) | ± 3.08% | 44% | 50% | 0% | – | 1%[lower-alpha 919] | 5% |
| Fox News | Sep 20–23 | 856 (LV) | ± 3% | 44% | 51% | 2% | – | 1%[lower-alpha 920] | 2% |
| 910 (RV) | ± 3% | 43% | 51% | 2% | – | 2%[lower-alpha 921] | 3% | ||
| Baldwin Wallace University | Sep 9–22 | 1,012 (LV) | ± 3.6% | 45% | 47% | 2% | 0% | 1%[lower-alpha 922] | 5% |
| Trafalgar Group/Restoration PAC[upper-alpha 52] | Sep 18–21 | 1,006 (LV) | ± 2.99% | 46% | 48% | 1% | 1% | 2%[lower-alpha 923] | 2% |
| YouGov/UW-Madison Elections Research Center/Wisconsin State Journal |
Sep 10–21 | 642 (LV) | – | 45% | 49% | - | - | – | – |
| Change Research/CNBC | Sep 18–20 | 579 (LV) | – | 45% | 49% | - | - | – | – |
| Franklin & Marshall College | Sep 14–20 | 480 (LV) | ± 7.8% | 42% | 48% | - | - | – | – |
| Hart Research Associates/Human Rights Campaign[upper-alpha 97] | Sep 17–19 | 400 (LV) | ± 4.9% | 42% | 53% | - | - | – | – |
| CPEC[upper-alpha 98] | Sep 15–17 | 830 (LV) | ± 2.3% | 45% | 50% | - | - | 1%[lower-alpha 924] | 4% |
| Trafalgar Group (R) | Sep 15–17 | 1,006 (LV) | ± 2.99% | 45% | 47% | 2% | 1% | 2%[lower-alpha 925] | 2% |
| Ipsos/Reuters | Sep 11–16 | 611 (LV) | ± 4.5% | 46% | 49% | - | - | 2%[lower-alpha 926] | 4% |
| Civiqs/Rust Belt Rising[upper-alpha 53] | Sep 11–15 | 704 (RV) | ± 4.4% | 45% | 52% | - | - | 1%[lower-alpha 927] | 2% |
| Redfield & Wilton Strategies | Sep 12–14 | 1,036 (LV) | ± 3.04% | 44% | 49% | 1% | 1% | 0%[lower-alpha 928] | 5% |
| Climate Nexus | Sep 8–11 | 659 (RV) | ± 4% | 43% | 48% | - | - | 3%[lower-alpha 929] | 6% |
| Benenson Strategy Group/GS Strategy Group/AARP | Aug 28 – Sep 8 | 1,600 (LV) | ± 2.5% | 46% | 49% | - | - | 1%[lower-alpha 930] | 4% |
| Marist College/NBC News | Aug 31 – Sep 7 | 771 (LV) | ± 4.4% | 44% | 53% | - | - | 1% | 2% |
| Morning Consult | Aug 29 – Sep 7 | 2,227 (LV) | ± (2%-4%) | 45%[lower-alpha 931] | 50% | - | - | – | – |
| Change Research/CNBC | Sep 4–6 | 829 (LV) | – | 46% | 50% | - | - | 4%[lower-alpha 932] | – |
| TargetSmart | Sep 3–6 | 835 (LV) | ± 3.4% | 44% | 51% | - | - | 3% | 3% |
| Susquehanna Polling & Research Inc. | Aug 26 – Sep 4 | 498 (LV) | ± 4.3% | 42% | 44% | - | - | 6%[lower-alpha 933] | 7% |
| Redfield & Wilton Strategies | Aug 30 – Sep 3 | 1,053 (LV) | ± 3.02% | 43% | 48% | 1% | 1% | 1%[lower-alpha 934] | 7% |
| Quinnipiac | Aug 28 – Sep 1 | 1,235 (LV) | ± 3% | 44% | 52% | - | - | 1%[lower-alpha 935] | 3% |
| ALG Research/Progressive Policy Institute[upper-alpha 99] | Aug 26 – Sep 1 | 500 (LV) | – | 44% | 50% | - | - | – | – |
| Monmouth University | Aug 28–31 | 400 (RV) | ± 4.9% | 45% | 49% | 2% | 0% | 1%[lower-alpha 936] | 4% |
| 400 (LV) | 46%[lower-alpha 937] | 49% | - | - | 2% | 3% | |||
| 47%[lower-alpha 938] | 48% | - | - | 2% | 3% | ||||
| Hodas & Associates/Restoration PAC[upper-alpha 52] | Aug 26–31 | 600 (LV) | – | 45% | 51% | - | - | – | 4% |
| SurveyMonkey/Axios | Aug 1–31 | 3,531 (LV) | – | 45% | 53% | - | - | – | 2% |
| Morning Consult | Aug 21–30 | 2,158 (LV) | ± (2%–4%) | 45% | 49% | - | - | – | – |
| Pulse Opinion Research/Rasmussen Reports | Aug 25–27 | 1,000 (LV) | ± 3% | 48%[lower-alpha 939] | 48% | - | - | 4%[lower-alpha 940] | – |
| GQR Research/Unite the Country PAC[upper-alpha 100] | Aug 20–24 | 971 (LV) | ± 4.4% | 43% | 52% | - | - | – | 5% |
| Franklin & Marshall College | Aug 17–24 | 681 (RV) | ± 5.2% | 42%[lower-alpha 941] | 50% | - | - | 3%[lower-alpha 942] | 7% |
| Change Research/CNBC | Aug 21–23 | 984 (LV) | – | 46% | 49% | - | - | – | – |
| Global Strategy Group/Climate Power 2020 /League of Conservation Voters/Sierra Club[upper-alpha 101] |
Aug 13–19 | 801 (RV) | ± 3.5% | 42%[lower-alpha 14] | 50% | 2% | 1% | – | 5% |
| 43%[lower-alpha 943] | 53% | - | - | – | 4% | ||||
| Redfield and Wilton Strategies | Aug 16–17 | 1,006 (LV) | ± 3.1% | 41% | 48% | 1% | 1% | 1%[lower-alpha 944] | 8% |
| Civiqs/Rust Belt Rising[upper-alpha 53] | Aug 13–17 | 617 (RV) | – | 44% | 51% | - | - | 3%[lower-alpha 945] | 1% |
| Muhlenberg College/Morning Call | Aug 11–17 | 416 (LV) | ± 5.5% | 45% | 49% | - | - | 3%[lower-alpha 946] | 3% |
| Morning Consult | Aug 7–16 | 1,777 (LV) | ± (2%–4%) | 44% | 50% | - | - | – | – |
| Emerson College | Aug 8–10 | 843 (LV) | ± 3.8% | 47%[lower-alpha 947] | 53% | - | - | – | – |
| Change Research/CNBC | Aug 7–9 | 456 (RV) | – | 44% | 48% | - | - | – | – |
| YouGov/CBS | Aug 4–7 | 1,211 (LV) | ± 3.7% | 43% | 49% | - | - | 3%[lower-alpha 948] | 5% |
| OnMessage Inc./Heritage Action[upper-alpha 102] | Aug 2–4 | 400 (LV) | ± 4.7% | 46% | 50% | - | - | – | 4% |
| YouGov/University of Wisconsin-Madison | Jul 27 – Aug 6 | 742 (RV) | ± 4.9% | 41% | 50% | - | - | 2%[lower-alpha 949] | 5% |
| SurveyMonkey/Axios | Jul 1–31 | 4,208 (LV) | – | 48% | 50% | - | - | – | 2% |
| Change Research/CNBC | Jul 24–26 | 382 (LV) | – | 46% | 48% | - | - | – | – |
| Franklin & Marshall College | Jul 20–26 | 667 (RV) | ± 5.5% | 41% | 50% | - | - | 2%[lower-alpha 950] | 6% |
| Morning Consult | Jul 17–26 | 2,092 (LV) | ± 2.1% | 42% | 50% | - | - | – | – |
| Gravis Marketing | Jul 22–24 | 1,006 (RV) | ± 3.1% | 45% | 48% | - | - | – | 8% |
| Zogby Analytics | Jul 21–23 | 809 (RV) | ± 3.4% | 43% | 44% | 4% | 2% | - | 8% |
| Hodas & Associates/Restoration PAC[upper-alpha 52] | Jul 17–22 | 600 (LV) | – | 45% | 51% | - | - | – | 5% |
| Redfield & Wilton Strategies | Jul 19–21 | 1,016 (LV) | – | 41% | 48% | 1% | 0% | 2%[lower-alpha 951] | 8% |
| Fox News | Jul 18–20 | 793 (RV) | ± 3.5% | 39% | 50% | - | - | 5%[lower-alpha 952] | 6% |
| Pulse Opinion Research/Rasmussen Reports/American Greatness PAC[upper-alpha 8] | Jul 15–16 | 750 (LV) | ± 4% | 46% | 51% | - | - | 2%[lower-alpha 953] | 1% |
| Spry Strategies/American Principles Project[upper-alpha 103] | Jul 11–16 | 700 (LV) | ± 3.7% | 48% | 47% | - | - | – | 5% |
| Monmouth University | Jul 9–13 | 401 (RV) | ± 4.9% | 40% | 53% | - | - | 3%[lower-alpha 954] | 4% |
| 401 (LV) | 42%[lower-alpha 955] | 52% | - | - | 3% | 3% | |||
| 44%[lower-alpha 956] | 51% | - | - | 2% | 3% | ||||
| Change Research/CNBC | Jul 10–12 | 743 (LV) | – | 42% | 50% | - | - | – | – |
| Trafalgar Group | Jun 29 – Jul 2 | 1,062 (LV) | ± 2.92% | 43% | 48% | - | - | 6%[lower-alpha 957] | 3% |
| SurveyMonkey/Axios | Jun 8–30 | 2,184 (LV) | – | 48% | 50% | - | - | – | 2% |
| Change Research/CNBC | Jun 26–28 | 760 (LV)[lower-alpha 41] | – | 44% | 50% | - | - | – | – |
| Susquehanna Polling/Fox 43 | Jun 15–23 | 715 (LV) | – | 41% | 46% | - | - | 5% | 8% |
| Redfield & Wilton Strategies | Jun 14–16 | 1,125 (LV) | ± 2.92% | 39% | 49% | 1% | 1% | 1%[lower-alpha 958] | 9% |
| Siena College/NYT Upshot | Jun 8–16 | 651 (RV) | ± 4.2% | 40% | 50% | - | - | 3%[lower-alpha 959] | 6% |
| Change Research/CNBC | Jun 12–14 | 491 (LV)[lower-alpha 41] | – | 46% | 49% | - | - | 3%[lower-alpha 960] | – |
| Hodas & Associates/Restoration PAC[upper-alpha 52] | Jun 8–11 | 600 (LV) | ± 4.0% | 42% | 54% | - | - | – | 4% |
| Civiqs/Dan Hopkins | Jun 6–11 | 1,221 (A) | 3.6% | 46% | 49% | - | - | – | 5% |
| Civiqs/Dan Hopkins | May 30 – Jun 2 | 2,045 (A) | 2.4% | 46% | 49% | - | - | – | 5% |
| Change Research/CNBC | May 29–31 | 579 (LV)[lower-alpha 41] | – | 50% | 46% | - | - | 2% | 2% |
| Morning Consult | May 17–26 | 2,120 (LV) | – | 44%[lower-alpha 41] | 48% | - | - | – | – |
| Redfield & Wilton Strategies | May 10–14 | 963 (LV) | ± 3.2% | 39% | 48% | - | - | 2%[lower-alpha 961] | 11% |
| Hodas & Associates/Restoration PAC[upper-alpha 52] | May 9–13 | 600 (LV) | ± 3.0% | 51% | 46% | - | - | – | 4% |
| Harper Polling (R) | Apr 21–26 | 644 (LV) | ± 3.9% | 43% | 49% | - | - | – | 8% |
| Public Policy Polling[upper-alpha 104] | Apr 20–21 | 1,251 (RV) | – | 44% | 51% | - | - | – | 5% |
| Fox News | Apr 18–21 | 803 (RV) | ± 3.5% | 42% | 50% | - | - | – | – |
| Ipsos | Apr 15–20 | 578 (RV) | ± 5.0% | 40% | 46% | - | - | – | – |
| Suquehanna Research/Fox 43 | Apr 14–20 | 693 (LV) | – | 42% | 48% | - | - | – | – |
| Hodas & Associates/Restoration PAC[upper-alpha 52] | Apr 16–18 | 600 (RV) | ± 3.0% | 47% | 47% | - | - | – | 6% |
| Civiqs/Dan Hopkins | Apr 4–8 | 1,912 (A) | 2.5% | 47% | 47% | - | - | – | 6% |
| Baldwin Wallace University Great Lakes | Mar 17–25 | 973 (RV) | ± 3.9% | 47% | 45% | - | - | – | 9% |
| Change Research | Mar 21–23 | 510 (LV) | – | 50% | 47% | - | - | – | 4% |
| Hodas & Associates/Restoration PAC[upper-alpha 52] | Mar 19–21 | 600 (RV) | – | 47% | 45% | - | - | – | – |
| Civiqs/Dan Hopkins | Mar 14–18 | 1,589 (A) | 2.7% | 48% | 46% | - | - | – | 6% |
| YouGov/Yahoo News | Mar 6–8 | 725 (RV) | – | 40% | 46% | - | - | 5%[lower-alpha 962] | 8% |
| Firehouse Strategies/Øptimus | Mar 5–7 | 533 (RV) | ± 5.3% | 45% | 44% | - | - | – | – |
| Civiqs/Dan Hopkins | Feb 27 – Mar 3 | 2,462 (A) | 2.2% | 48% | 46% | - | - | – | 7% |
| Muhlenberg College/Morning Call | Feb 12–20 | 424 (RV) | ± 5.5% | 47% | 47% | - | - | 2% | 4% |
| YouGov | Feb 11–20 | 1,171 (RV) | ± 4.0% | 45% | 46% | - | - | – | – |
| Quinnipiac University | Feb 12–18 | 849 (RV) | ± 3.4% | 42% | 50% | - | - | 6%[lower-alpha 963] | 3% |
| Expedition Strategies/Progressive Policies Institute | Feb 6–18 | 500 (RV) | – | 42% | 47% | - | - | – | 11% |
2017–2019 polls
| Poll source | Date(s) administered |
Sample size[lower-alpha 2] |
Margin of error |
Donald Trump Republican |
Joe Biden Democratic |
Other | Undecided |
|---|---|---|---|---|---|---|---|
| Firehouse Strategies/Øptimus | Dec 3–5, 2019 | 598 (LV) | ± 4.3% | 45% | 41% | 8%[lower-alpha 964] | 6%[lower-alpha 965] |
| Muhlenberg College/Morning Call | Nov 4–9, 2019 | 410 (RV) | ± 6.0% | 43% | 52% | 4% | 2% |
| Siena College/NYT Upshot | Oct 13–25, 2019 | 661 (LV) | ± 4.4% | 45% | 46% | – | – |
| Firehouse Strategies/Øptimus | Sep 7–9, 2019 | 527 (LV) | ± 4.2% | 41% | 45% | 14% | – |
| Firehouse Strategies/Øptimus | Jun 11–13, 2019 | 565 (LV) | ± 4.2% | 42% | 43% | 15% | – |
| Quinnipiac University | May 9–14, 2019 | 978 (RV) | ± 4.2% | 42% | 53% | 1% | 3% |
| WPA Intelligence | Apr 27–30, 2019 | 200 (LV) | ± 6.9% | 45% | 46% | – | 8% |
| Emerson College | Mar 26–28, 2019 | 808 (RV) | ± 3.4% | 45% | 55% | – | – |
| Firehouse Strategies/Øptimus | Mar 19–21, 2019 | 632 (LV) | ± 4.0% | 43% | 50% | 4% | – |
Rhode Island
Graphical summary
Aggregate polls
| Source of poll aggregation |
Dates administered |
Dates updated |
Joe Biden Democratic |
Donald Trump Republican |
Other/ Undecided [lower-alpha 1] |
Margin |
|---|---|---|---|---|---|---|
| FiveThirtyEight | until October 27, 2020 | October 28, 2020 | 64.3% | 31.4% | 4.3% | Biden +32.9 |
Polls
| Poll source | Date(s) administered |
Sample size[lower-alpha 2] |
Margin of error |
Donald Trump Republican |
Joe Biden Democratic |
Jo Jorgensen Libertarian |
Other | Undecided |
|---|---|---|---|---|---|---|---|---|
| SurveyMonkey/Axios | Oct 20 – Nov 2, 2020 | 566 (LV) | ± 5.5% | 36%[lower-alpha 966] | 62% | - | – | – |
| SurveyMonkey/Axios | Oct 1–28, 2020 | 910 (LV) | – | 32% | 67% | - | – | – |
| SurveyMonkey/Axios | Sep 1–30, 2020 | 351 (LV) | – | 37% | 62% | - | – | 0% |
| SurveyMonkey/Axios | Aug 1–31, 2020 | 208 (LV) | – | 41% | 57% | - | – | 3% |
| SurveyMonkey/Axios | Jul 1–31, 2020 | 253 (LV) | – | 39% | 60% | - | – | 1% |
| SurveyMonkey/Axios | Jun 8–30, 2020 | 176 (LV) | – | 40% | 60% | - | – | 1% |
South Carolina
Graphical summary
Aggregate polls
| Source of poll aggregation |
Dates administered |
Dates updated |
Joe Biden Democratic |
Donald Trump Republican |
Other/ Undecided [lower-alpha 1] |
Margin |
|---|---|---|---|---|---|---|
| 270 to Win | October 9–25, 2020 | October 28, 2020 | 43.3% | 50.3% | 6.4% | Trump +7.0 |
| FiveThirtyEight | until October 31, 2020 | November 1, 2020 | 43.5% | 51.4% | 5.1% | Trump +7.9 |
| Average | 43.4% | 50.9% | 5.7% | Trump +7.5 | ||
Polls
| Poll source | Date(s) administered |
Sample size[lower-alpha 2] |
Margin of error |
Donald Trump Republican |
Joe Biden Democratic |
Jo Jorgensen Libertarian |
Howie Hawkins Green |
Other | Undecided |
|---|---|---|---|---|---|---|---|---|---|
| Optimus | Oct 31 – Nov 2, 2020 | 817 (LV) | ± 3.9% | 51% | 39% | – | – | 2%[lower-alpha 967] | 8% |
| SurveyMonkey/Axios | Oct 20 – Nov 2, 2020 | 2,485 (LV) | ± 3% | 56%[lower-alpha 968] | 42% | – | – | – | – |
| Data For Progress | Oct 27 – Nov 1, 2020 | 1,121 (LV) | ± 2.9% | 53% | 44% | 2% | 0% | 0%[lower-alpha 969] | – |
| Swayable | Oct 23 – Nov 1, 2020 | 426 (LV) | ± 7.4% | 50% | 49% | 1% | 0% | – | – |
| Morning Consult | Oct 22–31, 2020 | 904 (LV) | ± 3% | 51% | 45% | – | – | – | – |
| SurveyMonkey/Axios | Oct 1–28, 2020 | 4,725 (LV) | – | 54% | 44% | – | – | – | – |
| Data for Progress | Oct 22–27, 2020 | 1,196 (LV) | ± 2.8% | 50% | 44% | 1% | 0% | – | 4% |
| Starboard Communications | Oct 26, 2020 | 800 (LV) | – | 51% | 44% | – | – | – | 5% |
| East Carolina University | Oct 24–25, 2020 | 763 (LV) | ± 4.1% | 52% | 44% | – | – | 3%[lower-alpha 970] | 1% |
| Morning Consult | Oct 11–20, 2020 | 926 (LV) | ± 3.2% | 51% | 45% | – | – | – | – |
| New York Times/Siena College | Oct 9–14, 2020 | 605 (LV) | ± 4.5% | 49% | 41% | 2% | 1% | 1%[lower-alpha 971] | 6%[lower-alpha 972] |
| Data for Progress | Oct 8–11, 2020 | 801 (LV) | ± 3.5% | 52% | 43% | 1% | 1% | – | 4% |
| Morning Consult | Oct 2–11, 2020 | 903 (LV) | ± 3% | 54% | 42% | – | – | – | – |
| SurveyMonkey/Axios | Sep 1–30, 2020 | 1,833 (LV) | – | 53% | 45% | – | – | – | 2% |
| GBAO Strategies/DSCC[upper-alpha 105] | Sep 24–28, 2020 | 800 (LV) | ± 3.5% | 49% | 44% | – | – | – | – |
| Data for Progress (D) | Sep 23–28, 2020 | 824 (LV) | ± 3.4% | 47%[lower-alpha 973] | 43% | 1% | 1% | – | 8% |
| 50%[lower-alpha 974] | 45% | – | – | – | 5% | ||||
| Quinnipiac University | Sep 23–27, 2020 | 1,123 (LV) | ± 2.9% | 48% | 47% | – | – | 1%[lower-alpha 975] | 4% |
| YouGov/CBS | Sep 22–25, 2020 | 1,080 (LV) | ± 3.8% | 52% | 42% | – | – | 2%[lower-alpha 976] | 4% |
| Morning Consult | Sep 11–20, 2020 | 764 (LV) | ± (3% – 4%) | 50%[lower-alpha 977] | 44% | – | – | – | – |
| Quinnipiac University | Sep 10–14, 2020 | 969 (LV) | ± 3.2% | 51% | 45% | – | – | 0%[lower-alpha 978] | 4% |
| Morning Consult | Sep 2–11, 2020 | ~764 (LV) | ± (3%–4%) | 51% | 44% | – | – | – | – |
| Morning Consult | Aug 23 – Sep 1, 2020 | ~764 (LV) | ± (3%–4%) | 52% | 42% | – | – | – | – |
| SurveyMonkey/Axios | Aug 1–31, 2020 | 1,326 (LV) | – | 53% | 45% | – | – | – | 2% |
| Morning Consult | Aug 13–22, 2020 | ~764 (LV) | ± (3%–4%) | 51% | 43% | – | – | – | – |
| Morning Consult | Aug 3–12, 2020 | ~764 (LV) | ± (3%–4%) | 50% | 43% | – | – | – | – |
| Quinnipiac University | Jul 30 – Aug 3, 2020 | 914 (RV) | ± 3.2% | 47% | 42% | – | – | 4%[lower-alpha 979] | 7% |
| Morning Consult | Jul 24 – Aug 2, 2020 | 741 (LV) | ± 4.0% | 49%[lower-alpha 980] | 44% | – | – | 3%[lower-alpha 981] | 4% |
| Morning Consult | Jul 23 – Aug 1, 2020 | ~764 (LV) | ± (3%–4%) | 48% | 45% | – | – | – | – |
| SurveyMonkey/Axios | Jul 1–31, 2020 | 1,700 (LV) | – | 53% | 44% | – | – | – | 2% |
| Morning Consult | Jul 13–22, 2020 | ~764 (LV) | ± (3%–4%) | 50% | 43% | – | – | – | – |
| ALG Research/Lindsey Must Go[upper-alpha 106] | Jul 15–20, 2020 | 591 (LV) | – | 50% | 45% | – | – | 1% | 4% |
| Gravis Marketing | Jul 17, 2020 | 604 (LV) | ± 4.0% | 50% | 46% | – | – | – | – |
| brilliant corners Research & Strategies/Jaime Harrison[upper-alpha 107] | Jul 13–19, 2020 | 800 (LV) | ± 3.5% | 50% | 43% | – | – | – | – |
| SurveyMonkey/Axios | Jun 8–30, 2020 | 863 (LV) | – | 52% | 47% | – | – | – | 2% |
| Civiqs/Daily Kos | May 23–26, 2020 | 591 (RV) | ± 4.5% | 52% | 42% | – | – | 5%[lower-alpha 982] | 1% |
| AtlasIntel | Feb 25–28, 2020 | 1,100 (RV) | ± 3.0% | 48% | 42% | – | – | 11% | – |
| East Carolina University | Jan 31 – Feb 2, 2020 | 1,756 (RV) | ± 2.7% | 52% | 40% | – | – | – | 8% |
| Change Research | Jun 11–14, 2019 | 2,312 (RV) | ± 2.0% | 54% | 38% | 3%[lower-alpha 983] | 1%[lower-alpha 984] | – | – |
| Emerson College | Feb 28 – Mar 2, 2019 | 755 (RV) | ± 3.5% | 52% | 48% | – | – | – | – |
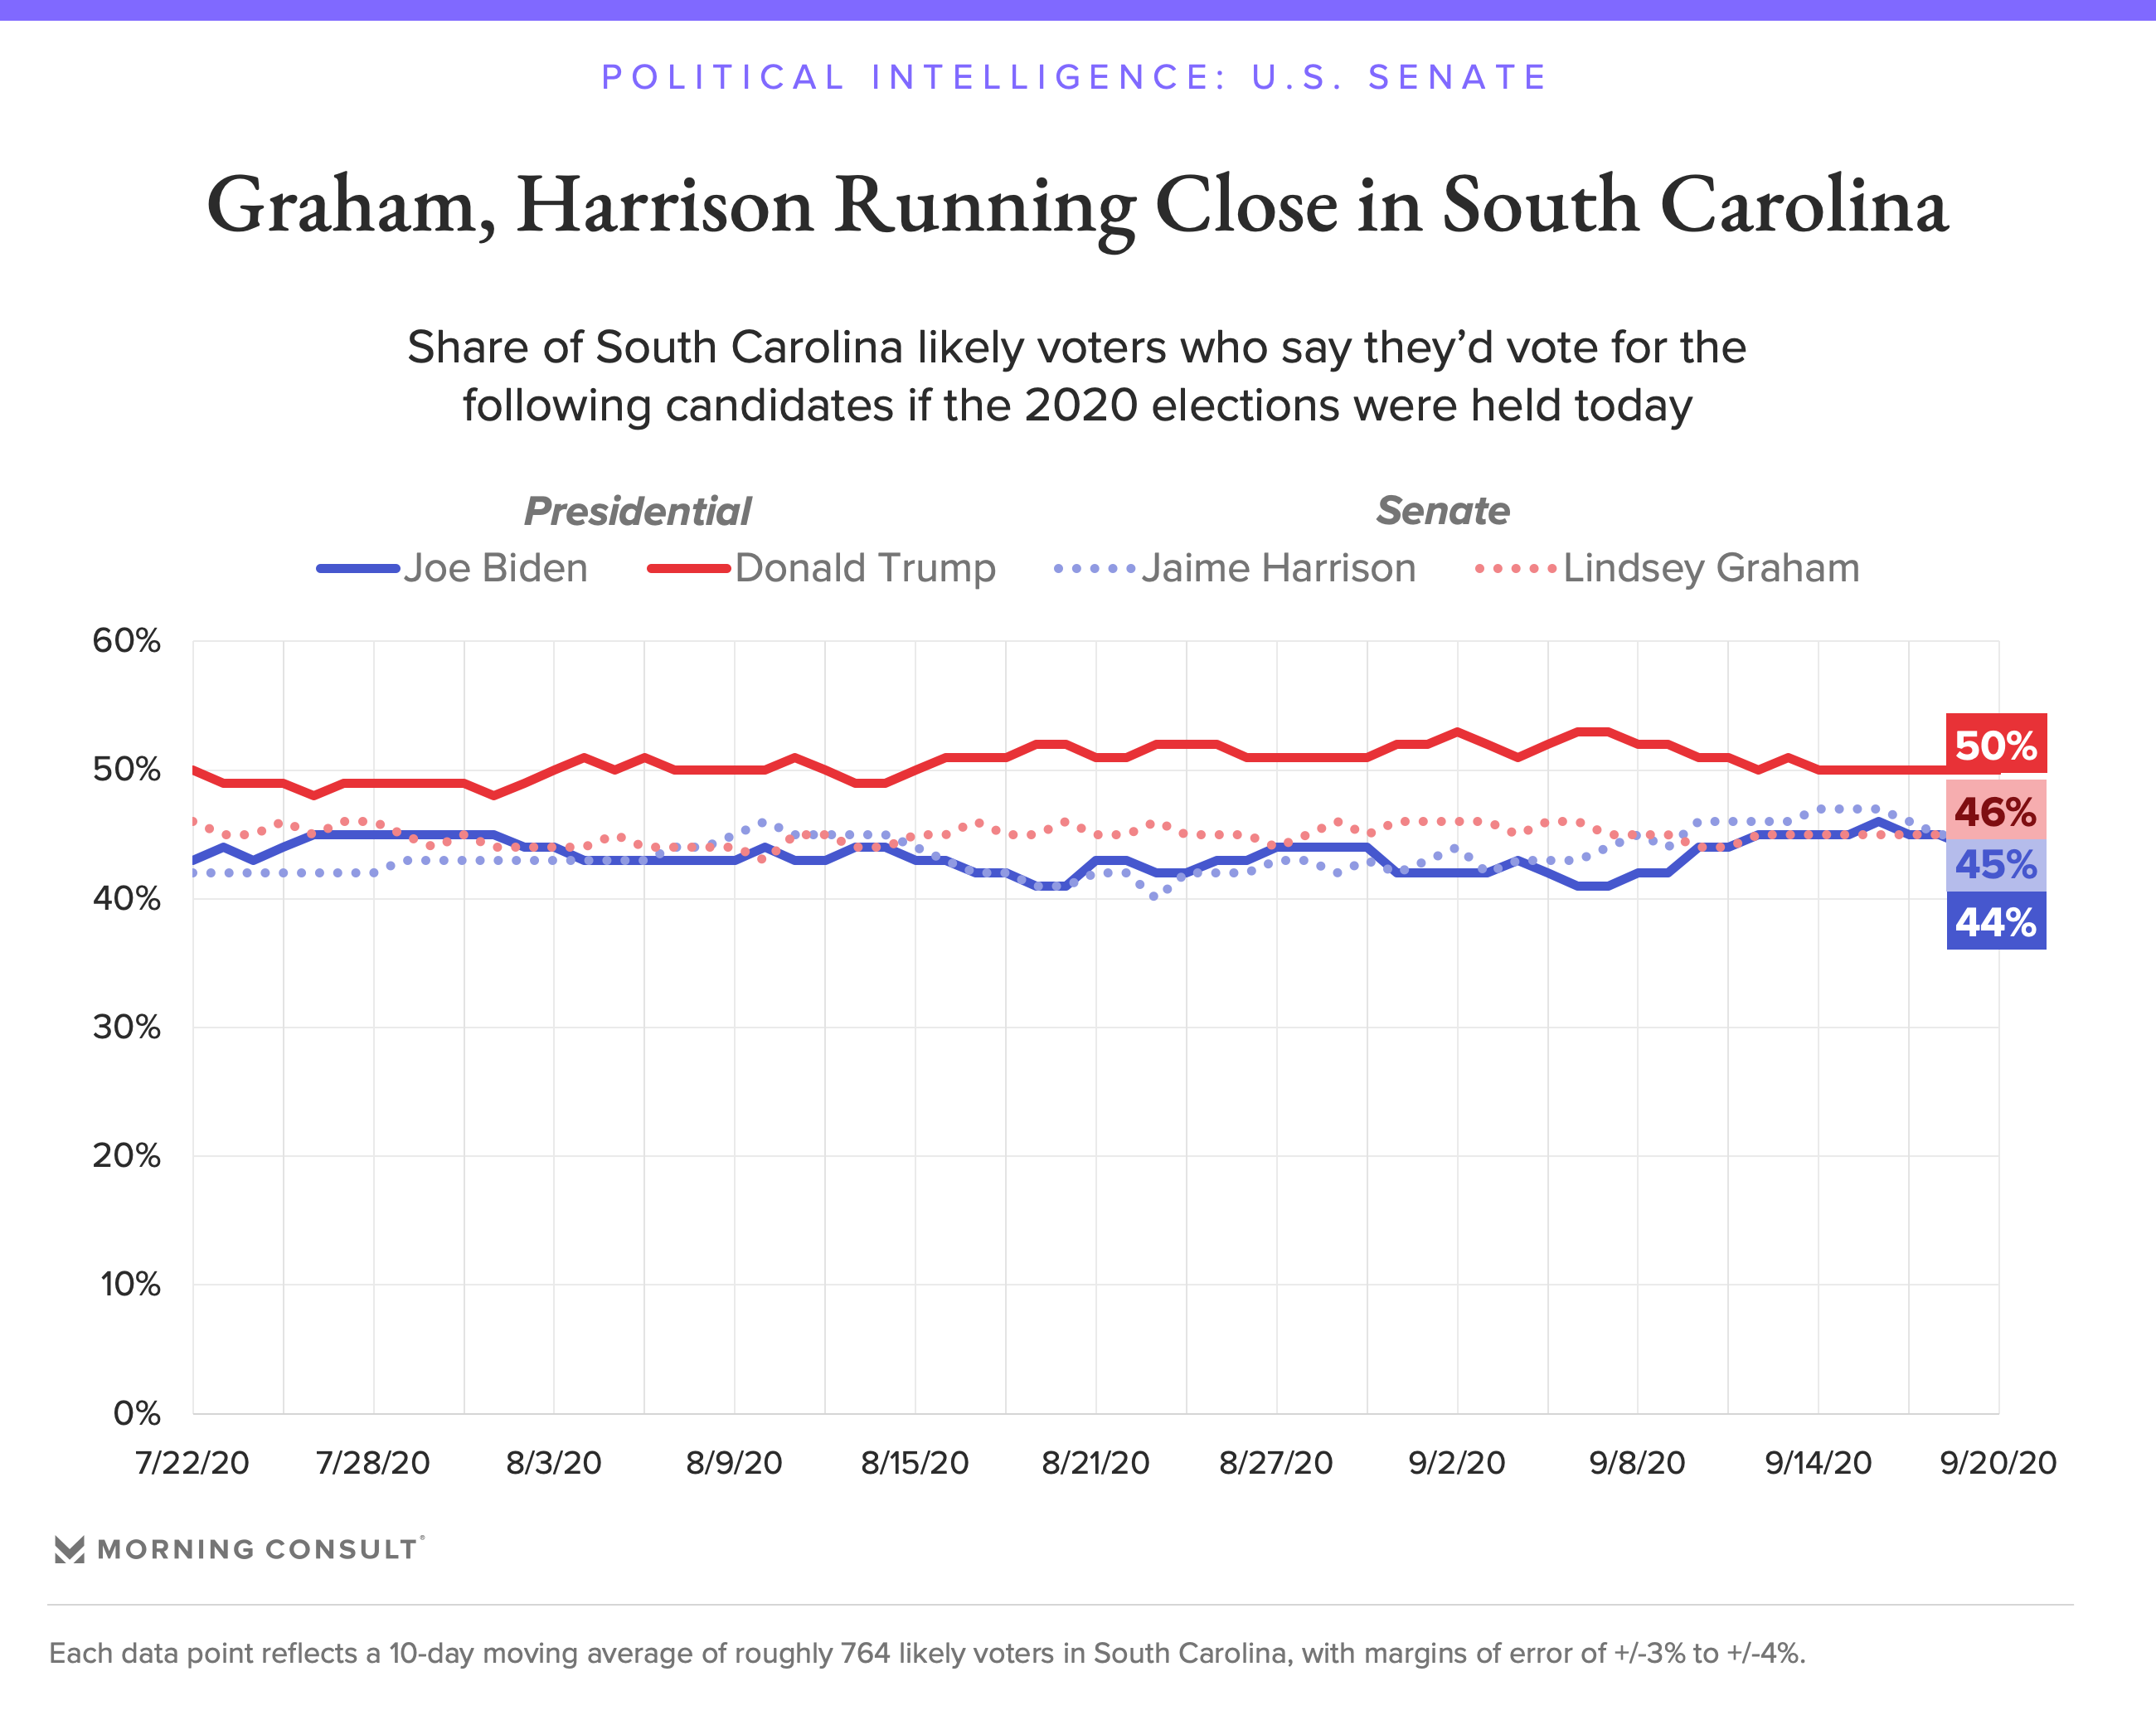
South Dakota
Aggregate polls
| Source of poll aggregation |
Dates administered |
Dates updated |
Joe Biden Democratic |
Donald Trump Republican |
Other/ Undecided [lower-alpha 1] |
Margin |
|---|---|---|---|---|---|---|
| 270 to Win | September 20 – October 21, 2020 | November 1, 2020 | 42.0% | 52.5% | 5.5% | Trump +10.5 |
| FiveThirtyEight | until October 31, 2020 | November 1, 2020 | 38.9% | 54.0% | 7.1% | Trump +15.1 |
| Average | 40.4% | 53.3% | 6.3% | Trump +12.9 | ||
Polls
| Poll source | Date(s) administered |
Sample size[lower-alpha 2] |
Margin of error |
Donald Trump Republican |
Joe Biden Democratic |
Jo Jorgensen Libertarian |
Other | Undecided |
|---|---|---|---|---|---|---|---|---|
| SurveyMonkey/Axios | Oct 20 – Nov 2, 2020 | 606 (LV) | ± 5.5% | 63%[lower-alpha 985] | 36% | – | – | – |
| Nielson Brothers Polling | Oct 24–28, 2020 | 484 (LV) | ± 4.45% | 55% | 40% | 3% | – | 2% |
| SurveyMonkey/Axios | Oct 1–28, 2020 | 1,098 (LV) | – | 57% | 41% | – | – | – |
| Mason-Dixon | Oct 19–21, 2020 | 625 (LV) | ± 4% | 51% | 40% | – | 3% | 6% |
| SurveyMonkey/Axios | Sep 1–30, 2020 | 354 (LV) | – | 58% | 41% | – | – | 1% |
| SurveyMonkey/Axios | Aug 1–31, 2020 | 277 (LV) | – | 59% | 38% | – | – | 3% |
| SurveyMonkey/Axios | Jul 1–31, 2020 | 396 (LV) | – | 62% | 35% | – | – | 2% |
| SurveyMonkey/Axios | Jun 8–30, 2020 | 160 (LV) | – | 61% | 37% | – | – | 2% |
Tennessee
Aggregate polls
| Source of poll aggregation |
Dates administered |
Dates updated |
Joe Biden Democratic |
Donald Trump Republican |
Other/ Undecided [lower-alpha 1] |
Margin |
|---|---|---|---|---|---|---|
| RealClearPolitics | Jan 28, 2020 – May 22, 2020 | September 15, 2020 | 39.0% | 53.0% | 8.0% | Trump +14.0 |
| FiveThirtyEight | until October 27, 2020 | October 28, 2020 | 41.0% | 54.4% | 4.6% | Trump +13.4 |
| Average | 40.0% | 53.7% | 6.3% | Trump +13.7 | ||
Polls
| Poll source | Date(s) administered |
Sample size[lower-alpha 2] |
Margin of error |
Donald Trump Republican |
Joe Biden Democratic |
Jo Jorgensen Libertarian |
Howie Hawkins Green |
Other | Undecided |
|---|---|---|---|---|---|---|---|---|---|
| SurveyMonkey/Axios | Oct 20 – Nov 2, 2020 | 3,342 (LV) | ± 2.5% | 54%[lower-alpha 986] | 45% | - | - | – | – |
| Swayable | Oct 23 – Nov 1, 2020 | 485 (LV) | ± 5.9% | 58% | 41% | 1% | 0% | – | – |
| SurveyMonkey/Axios | Oct 1–28, 2020 | 5,099 (LV) | – | 56% | 42% | - | - | – | – |
| SurveyMonkey/Axios | Sep 1–30, 2020 | 2,329 (LV) | – | 58% | 41% | - | - | – | 2% |
| SurveyMonkey/Axios | Aug 1–31, 2020 | 1,796 (LV) | – | 59% | 40% | - | - | – | 1% |
| SurveyMonkey/Axios | Jul 1–31, 2020 | 2,481 (LV) | – | 61% | 38% | - | - | – | 2% |
| SurveyMonkey/Axios | Jun 8–30, 2020 | 1,092 (LV) | – | 61% | 37% | - | - | – | 2% |
| SSRS/Vanderbilt University | May 5–22, 2020 | 1,000 (RV) | ± 3.8% | 51% | 42% | - | - | 5%[lower-alpha 987] | 2% |
| East Tennessee State University | Apr 22 – May 1, 2020 | 536 (LV) | – | 53% | 36% | - | - | 6% | 5% |
| Mason-Dixon | Jan 28–30, 2020 | 625 (RV) | ± 4.0% | 55% | 39% | - | - | – | 6% |
Texas
Graphical summary
Aggregate polls
| Source of poll aggregation |
Dates administered |
Dates updated |
Joe Biden Democratic |
Donald Trump Republican |
Other/ Undecided [lower-alpha 1] |
Margin |
|---|---|---|---|---|---|---|
| 270 to Win | Oct 20–31, 2020 | November 2, 2020 | 47.5% | 48.8% | 3.7% | Trump +1.3 |
| Real Clear Politics | October 20–31, 2020 | November 1, 2020 | 46.5% | 47.7% | 5.8% | Trump +1.2 |
| FiveThirtyEight | until November 1, 2020 | November 2, 2020 | 47.5% | 48.5% | 4.0% | Trump +1.0 |
| Average | 47.2% | 48.3% | 4.5% | Trump +1.1 | ||
Polls
| Poll source | Date(s) administered |
Sample size[lower-alpha 2] |
Margin of error |
Donald Trump Republican |
Joe Biden Democratic |
Jo Jorgensen Libertarian |
Howie Hawkins Green |
Other | Undecided |
|---|---|---|---|---|---|---|---|---|---|
| SurveyMonkey/Axios | Oct 20 – Nov 2, 2020 | 9,226 (LV) | ± 1.5% | 51%[lower-alpha 988] | 47% | – | – | – | – |
| Swayable | Oct 27 – Nov 1, 2020 | 1,151 (LV) | ± 3.9% | 51% | 47% | 1% | 0% | – | – |
| Data For Progress | Oct 27 – Nov 1, 2020 | 926 (LV) | ± 3.2% | 48% | 49% | 1% | 1% | 0%[lower-alpha 989] | – |
| AtlasIntel | Oct 30–31, 2020 | 686 (LV) | ± 4% | 50% | 47% | – | – | 3% | – |
| Emerson College | Oct 29–31, 2020 | 763 (LV) | ± 3.5% | 49%[lower-alpha 990] | 48% | - | - | 2%[lower-alpha 991] | – |
| Morning Consult | Oct 22–31, 2020 | 3,267 (LV) | ± 2% | 48% | 48% | – | – | – | – |
| Public Policy Polling | Oct 28–29, 2020 | 775 (V) | – | 48% | 50% | – | – | – | 2% |
| Gravis Marketing | Oct 27–28, 2020 | 670 (LV) | ± 3.8% | 50% | 45% | – | – | – | 5% |
| RMG Research/PoliticalIQ | Oct 27–28, 2020 | 800 (LV) | ± 3.5% | 50%[lower-alpha 992] | 46% | – | – | 2%[lower-alpha 993] | 2% |
| 48%[lower-alpha 994] | 48% | – | – | 2%[lower-alpha 995] | 2% | ||||
| 52%[lower-alpha 996] | 44% | – | – | 2%[lower-alpha 997] | 2% | ||||
| SurveyMonkey/Axios | Oct 1–28, 2020 | 15,145 (LV) | – | 51% | 47% | – | – | – | – |
| Swayable | Oct 23–26, 2020 | 552 (LV) | ± 5.7% | 49% | 48% | 3% | 1% | – | – |
| YouGov/UMass Amherst | Oct 20–26, 2020 | 873 (LV) | ± 4.2% | 48% | 47% | 2% | 1% | 0%[lower-alpha 998] | 1% |
| Data for Progress (D) | Oct 22–25, 2020 | 1,018 (LV) | ± 3.1% | 48% | 49% | 1% | 0% | – | 2% |
| Siena College/NYT Upshot | Oct 20–25, 2020 | 802 (LV) | ± 3.8% | 47% | 43% | 3% | 0% | 2%[lower-alpha 999] | 5%[lower-alpha 1000] |
| Univision/University of Houston/Latino Decisions/North Star Opinion Research |
Oct 17–25, 2020 | 758 (RV) | ± 3.56% | 49% | 46% | – | – | 3%[lower-alpha 1001] | 2% |
| Citizen Data | Oct 17–20, 2020 | 1,000 (LV) | ± 3% | 45% | 49% | 1% | 0% | 1% | 4% |
| YouGov/University of Houston | Oct 13–20, 2020 | 1,000 (LV) | ± 3.1% | 50% | 45% | 2% | 0% | – | 3% |
| University of Texas at Tyler/Dallas Morning News | Oct 13–20, 2020 | 925 (LV) | ± 3.2% | 47%[lower-alpha 1002] | 49% | 3% | 1% | – | 1% |
| Morning Consult | Oct 11–20, 2020 | 3,347 (LV) | ± 1.7% | 47% | 48% | – | – | – | – |
| Quinnipiac University | Oct 16–19, 2020 | 1,145 (LV) | ± 2.9% | 47% | 47% | – | – | 1%[lower-alpha 1003] | 5% |
| Data for Progress (D) | Oct 15–18, 2020 | 933 (LV) | ± 3.2% | 46%[lower-alpha 1004] | 47% | 2% | 1% | – | 5% |
| Morning Consult | Oct 2–11, 2020 | 3,455 (LV) | ± 1.7% | 49% | 47% | – | – | – | 3% |
| Public Policy Polling/Texas Democrats[upper-alpha 108] | Oct 7–8, 2020 | 721 (LV) | ± 3.6% | 48% | 48% | – | – | – | 1% |
| YouGov/CCES | Sep 29 – Oct 7, 2020 | 2,947 (LV) | – | 49% | 47% | – | – | – | – |
| Morning Consult | Sep 28 – Oct 7, 2020 | ~2,700 (LV) | ± 2% | 49% | 46% | – | – | – | – |
| Pulse Opinion Research/Rasmussen Reports/Crosswind PR | Oct 5–6, 2020 | 1,000 (LV) | ± 3% | 51% | 44% | – | – | – | – |
| Civiqs/Daily Kos | Oct 3–6, 2020 | 895 (LV) | ± 3.4% | 48% | 48% | – | – | 2%[lower-alpha 1005] | 1% |
| Data For Progress (D) | Sep 30 – Oct 5, 2020 | 1,949 (LV) | ± 2.2% | 45% | 47% | 2% | 1% | – | 5% |
| YouGov/University of Texas/Texas Tribune | Sep 25 – Oct 4, 2020 | 908 (LV) | ± 3.25% | 50% | 45% | 2% | 2% | 1%[lower-alpha 1006] | – |
| EMC Research/Blue Texas PAC[upper-alpha 109] | Sep 27 – Oct 2, 2020 | 848 (LV) | – | 49% | 49% | – | – | – | – |
| SurveyMonkey/Axios | Sep 1–30, 2020 | 13,395 (LV) | – | 52% | 46% | – | – | – | 2% |
| Hart Research Associates/Human Rights Campaign[upper-alpha 110] | Sep 24–27, 2020 | 400 (LV) | ± 4.9% | 49% | 47% | – | – | – | – |
| Morning Consult | Sep 18–27, 2020 | ~2,700 (LV) | ± 2% | 48% | 47% | – | – | – | – |
| Public Policy Polling/Texas Democrats[upper-alpha 111] | Sep 25–26, 2020 | 612 (LV) | ± 3.6% | 48% | 48% | – | – | – | 4% |
| YouGov/UMass Lowell | Sep 18–25, 2020 | 882 (LV) | ± 4.3% | 49%[lower-alpha 1007] | 46% | 2% | 1% | 1%[lower-alpha 1008] | 1% |
| 50%[lower-alpha 1009] | 46% | – | – | 2%[lower-alpha 1010] | 2% | ||||
| Data For Progress[upper-alpha 112] | Sep 18–22, 2020 | 726 (LV) | ± 3.6% | 47% | 45% | – | – | – | 9% |
| Siena College/NYT Upshot | Sep 16–22, 2020 | 653 (LV) | ± 4.3% | 46% | 43% | 1% | 1% | 0%[lower-alpha 1011] | 9%[lower-alpha 1012] |
| Quinnipiac University | Sep 17–21, 2020 | 1,078 (LV) | ± 3% | 50% | 45% | – | – | No voters | 4% |
| YouGov/CBS | Sep 15–18, 2020 | 1,129 (LV) | ± 3.5% | 48% | 46% | – | – | 2%[lower-alpha 1013] | 4% |
| Morning Consult | Sep 8–17, 2020 | ~2,700 (LV) | ± 2% | 47% | 47% | – | – | – | – |
| Morning Consult | Aug 29 – Sep 7, 2020 | 2,829 (LV) | ± 2% | 46%[lower-alpha 1014] | 46% | – | – | – | – |
| Public Policy Polling/Giffords[upper-alpha 113] | Sep 1–2, 2020 | 743 (V) | – | 48% | 47% | – | – | – | 5% |
| University of Texas at Tyler/Dallas Morning News | Aug 28 – Sep 2, 2020 | 901 (LV) | ± 3.26% | 49%[lower-alpha 1015] | 47% | 1% | 1% | 1% | – |
| SurveyMonkey/Axios | Aug 1–31, 2020 | 12,607 (LV) | – | 52% | 46% | – | – | – | 2% |
| Morning Consult | Aug 21–30, 2020 | 2,632 (LV) | ± 2% | 48%[lower-alpha 1016] | 47% | – | – | – | – |
| Tyson Group/Consumer Energy Alliance[upper-alpha 2] | Aug 20–25, 2020 | 906 (LV) | ± 3% | 44% | 48% | 0% | – | 0%[lower-alpha 1017] | 5% |
| Data for Progress/Texas Youth Power Alliance | Aug 20–25, 2020 | 2,295 (LV) | ± 2.0% | 45% | 48% | – | – | – | 8% |
| Public Policy Polling/Texas Democrats[upper-alpha 114] | Aug 21–22, 2020 | 764 (RV) | ± 3.6% | 47% | 48% | – | – | – | 5% |
| Morning Consult | Aug 13–22, 2020 | ~2,700 (LV) | ± 2% | 48% | 47% | – | – | – | – |
| Morning Consult | Aug 7–16, 2020 | 2,559 (LV) | ± 2% | 47%[lower-alpha 1018] | 46% | – | – | – | – |
| Global Strategy Group/Chrysta for Texas[upper-alpha 115] | Aug 11–13, 2020 | 700 (LV) | ± 3.7% | 45% | 47% | – | – | – | – |
| YouGov/Texas Hispanic Policy Foundation/Rice University’s Baker Institute | Aug 4–13, 2020 | 846 (RV) | – | 48% | 41% | 1% | 1% | – | 10.2% |
| – (LV)[upper-alpha 116] | 50% | 44% | 1% | 0% | – | 5% | |||
| Trafalgar Group (R) | Aug 1–5, 2020 | 1,015 (LV) | ± 3.0% | 49% | 43% | 2% | – | 2%[lower-alpha 1019] | 3% |
| Morning Consult | Aug 3–12, 2020 | ~2,700 (LV) | ± 2.0% | 47% | 46% | – | – | – | – |
| Morning Consult | Jul 24 – Aug 2, 2020 | 2,576 (LV) | ± 2.0% | 46%[lower-alpha 1020] | 47% | – | – | 2%[lower-alpha 1021] | 5% |
| SurveyMonkey/Axios | Jul 1–31, 2020 | 13,721 (LV) | – | 52% | 46% | – | – | – | 2% |
| Morning Consult | Jul 17–26, 2020 | 2,685 (LV) | ± 1.9% | 45%[lower-alpha 1022] | 47% | – | – | – | – |
| Morning Consult | Jul 16–25, 2020 | ~2,700 (LV)[lower-alpha 1023] | ± 2.0% | 45% | 47% | – | – | – | – |
| Spry Strategies/American Principles Project[upper-alpha 117] | Jul 16–20, 2020 | 750 (LV) | ± 3.5% | 49% | 45% | – | – | – | 6% |
| Quinnipiac University | Jul 16–20, 2020 | 880 (RV) | ± 3.3% | 44% | 45% | – | – | 7%[lower-alpha 1024] | 4% |
| Morning Consult | Jul 6–15, 2020 | – (LV)[lower-alpha 1025] | – | 46% | 46% | – | – | – | – |
| YouGov/CBS | Jul 7–10, 2020 | 1,185 (LV) | ± 3.6% | 46% | 45% | – | – | 4%[lower-alpha 1026] | 6% |
| Gravis Marketing/OANN | Jul 7, 2020 | 591 (LV) | ± 4.3% | 46% | 44% | – | – | – | – |
| Dallas Morning News/University of Texas at Tyler | Jun 29 – Jul 7, 2020 | 1,677 (LV) | ± 2.4% | 43% | 48% | – | – | 4% | 5% |
| Morning Consult | Jun 26 – Jul 5, 2020 | – (LV)[lower-alpha 1027] | – | 46% | 45% | – | – | – | – |
| SurveyMonkey/Axios | Jun 8–30, 2020 | 6,669 (LV) | – | 51% | 46% | – | – | – | 2% |
| YouGov/University of Texas/Texas Politics Project | Jun 19–29, 2020 | 1,200 (RV) | ± 2.89% | 48% | 44% | – | – | – | 8% |
| Public Policy Polling | Jun 24–25, 2020 | 729 (RV) | ± 3.6% | 46% | 48% | – | – | – | 5% |
| Morning Consult | Jun 16–25, 2020 | – (LV)[lower-alpha 1028] | – | 47% | 44% | – | – | – | – |
| Fox News | Jun 20–23, 2020 | 1,001 (RV) | ± 3% | 44% | 45% | – | – | 5%[lower-alpha 1029] | 5% |
| Public Policy Polling/Progress Texas[upper-alpha 118] | Jun 18–19, 2020 | 907 (V) | ± 3% | 48% | 46% | – | – | – | 6% |
| Morning Consult | Jun 6–15, 2020 | – (LV)[lower-alpha 1030] | – | 48% | 45% | – | – | – | – |
| Morning Consult | May 27 – Jun 5, 2020 | – (LV)[lower-alpha 1031] | – | 48% | 43% | – | – | – | – |
| Public Policy Polling/Texas Democrats[upper-alpha 119] | Jun 2–3, 2020 | 683 (V) | – | 48% | 48% | – | – | – | 4% |
| Quinnipiac | May 28 – Jun 1, 2020 | 1,166 (RV) | ± 2.9% | 44% | 43% | – | – | 6%[lower-alpha 1032] | 7% |
| Morning Consult | May 17–26, 2020 | 2,551 (LV) | – | 50%[lower-alpha 1033] | 43% | – | – | – | – |
| Morning Consult | May 16–25, 2020 | – (LV)[lower-alpha 1034] | – | 50% | 42% | – | – | – | – |
| Morning Consult | May 6–15, 2020 | – (LV)[lower-alpha 1035] | – | 49% | 43% | – | – | – | – |
| Emerson College | May 8–10, 2020 | 800 (RV) | ± 3.4% | 52%[lower-alpha 1036] | 48% | – | – | – | – |
| Public Policy Polling | Apr 27–28, 2020 | 1,032 (V) | – | 46% | 47% | – | – | – | 7% |
| Dallas Morning News/University of Texas at Tyler | Apr 18–27, 2020 | 1,183 (RV) | ± 2.85% | 43% | 43% | – | – | 5% | 9% |
| University of Texas/Texas Tribune | Apr 10–19, 2020 | 1,200 (RV) | ± 2.8% | 49% | 44% | – | – | – | 7% |
| AtlasIntel | Feb 24 – Mar 2, 2020 | 1,100 (RV) | ± 3.0% | 47% | 43% | – | – | 11% | – |
| NBC News/Marist College | Feb 23–27, 2020 | 2,409 (RV) | ± 2.5% | 49% | 45% | – | – | 1% | 5% |
| CNN/SSRS | Feb 22–26, 2020 | 1,003 (RV) | ± 3.4% | 47% | 48% | – | – | 3%[lower-alpha 1037] | 2% |
| Univision | Feb 21–26, 2020 | 1,004 (RV) | ± 3.1% | 43% | 46% | – | – | – | 11% |
| Dallas Morning News/University of Texas at Tyler | Feb 17–26, 2020 | 1,221 (RV) | ± 2.8% | 45% | 44% | – | – | 11% | – |
| YouGov/University of Texas/Texas Tribune | Jan 31 – Feb 9, 2020 | 1,200 (RV) | ± 2.83% | 47% | 44% | – | – | – | 10% |
| University of Texas at Tyler/Dallas News | Jan 21–30, 2020 | 910 (LV) | ± 3.24% | 46% | 44% | – | – | 10%[lower-alpha 1038] | – |
| Data For Progress[upper-alpha 120] | Jan 16–21, 2020 | 1,486 (LV) | – | 54% | 40% | – | – | 3%[lower-alpha 1039] | 3% |
| Texas Lyceum | Jan 10–19, 2020 | 520 (LV) | ± 4.3% | 51% | 46% | – | – | – | 3% |
| CNN/SSRS | Dec 4–9, 2019 | 1,003 (RV) | – | 48% | 47% | – | – | 2%[lower-alpha 1040] | 3% |
| Beacon Research (R) | Nov 9–21, 2019 | 1,601 (RV) | ± 3.0% | 45% | 44% | – | – | – | – |
| University of Texas at Tyler | Nov 5–14, 2019 | 1,093 (RV) | ± 3.0% | 45% | 39% | – | – | – | 16% |
| University of Texas/ Texas Tribune | Oct 18–27, 2019 | 1,200 (RV) | ± 2.8% | 46% | 39% | – | – | 9%[lower-alpha 1041] | 6% |
| University of Texas at Tyler | Sep 13–15, 2019 | 1,199 (RV) | ± 2.8% | 38% | 40% | – | – | 13% | 9% |
| Univision | Aug 31 – Sep 6, 2019 | 1,004 (RV) | – | 43% | 47% | – | – | – | 10% |
| Climate Nexus | Aug 20–25, 2019 | 1,660 (RV) | ± 2.4% | 43% | 43% | – | – | – | 9% |
| University of Texas at Tyler | Aug 1–4, 2019 | 1,261 (RV) | ± 2.8% | 37% | 41% | – | – | 14% | 8% |
| Emerson | Aug 1–3, 2019 | 1,033 (RV) | ± 3.0% | 49% | 51% | – | – | – | – |
| University of Texas at Tyler | Jul 24–27, 2019 | 1,414 (RV) | ± 2.6% | 37% | 37% | – | – | 12% | 14% |
| Quinnipiac University | May 29 – Jun 4, 2019 | 1,159 (RV) | ± 3.4% | 44% | 48% | – | – | 1% | 4% |
| WPA Intelligence | Apr 27–30, 2019 | 200 (LV) | ± 6.9% | 49% | 42% | – | – | – | 7% |
| Emerson College | Apr 25–28, 2019 | 799 (RV) | ± 3.4% | 50%[lower-alpha 1042] | 51% | – | – | – | – |
| Quinnipiac University | Feb 20–25, 2019 | 1,222 (RV) | ± 3.4% | 47% | 46% | – | – | 1% | 5% |
| Public Policy Polling (D)[upper-alpha 121] | Feb 13–14, 2019 | 743 (RV) | ± 3.6% | 49% | 46% | – | – | – | 5% |
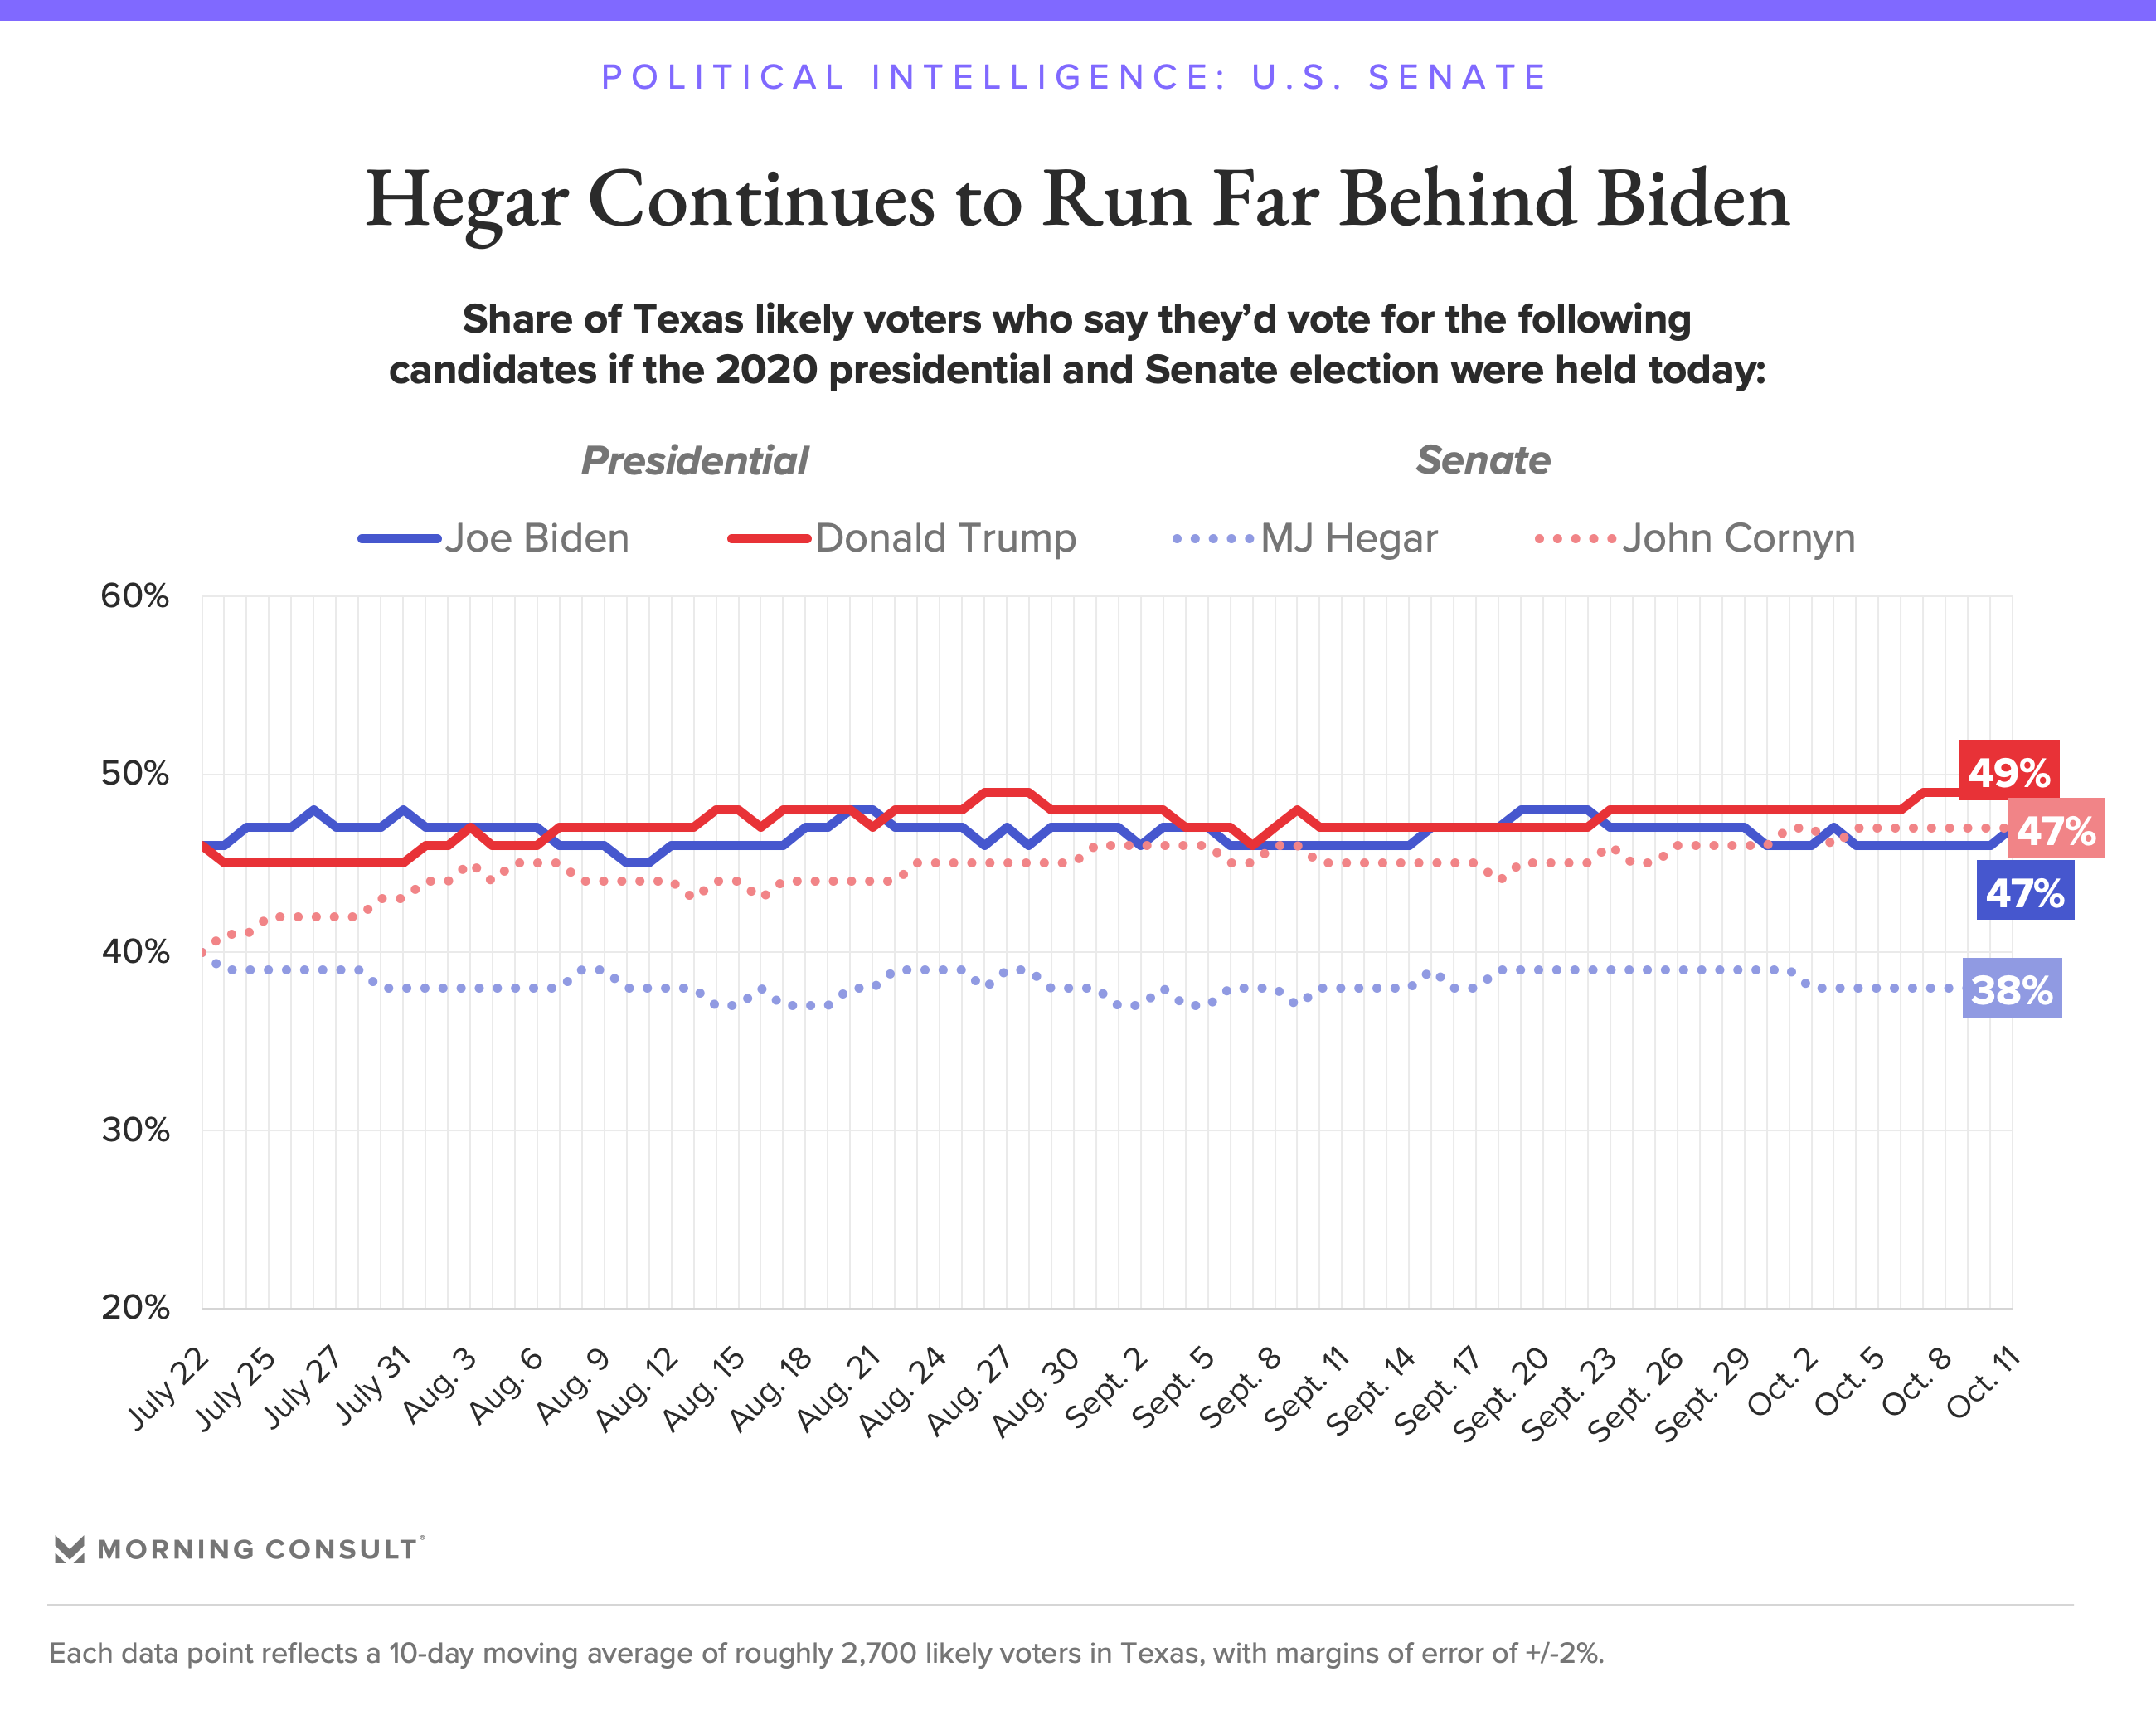
Utah
Graphical summary
Aggregate polls
| Source of poll aggregation |
Dates administered |
Dates updated |
Joe Biden Democratic |
Donald Trump Republican |
Other/ Undecided [lower-alpha 1] |
Margin |
|---|---|---|---|---|---|---|
| 270 to Win | September 26 – October 17, 2020 | October 28, 2020 | 39.0% | 50.0% | 11.0% | Trump +11.0 |
| FiveThirtyEight | until October 27, 2020 | October 28, 2020 | 40.1% | 51.3% | 8.6% | Trump +11.2 |
| Average | 39.6% | 50.7% | 9.7% | Trump +11.1 | ||
Polls
| Poll source | Date(s) administered |
Sample size[lower-alpha 2] |
Margin of error |
Donald Trump Republican |
Joe Biden Democratic |
Jo Jorgensen Libertarian |
Howie Hawkins Green |
Other | Undecided |
|---|---|---|---|---|---|---|---|---|---|
| SurveyMonkey/Axios | Oct 20 – Nov 2, 2020 | 1,586 (LV) | ± 3.5% | 55%[lower-alpha 1043] | 43% | – | – | – | – |
| SurveyMonkey/Axios | Oct 1–28, 2020 | 2,783 (LV) | – | 55% | 43% | – | – | – | – |
| Y2 Analytics/Salt Lake Tribune | Oct 15–24, 2020 | 660 (LV) | ± 3.8% | 51% | 44% | – | – | 5%[lower-alpha 1044] | – |
| RMG Research/Deseret News/Hinckley Institute of Politics | Oct 12–17, 2020 | 1,000 (LV) | ± 3.1% | 50% | 38% | 3% | 0% | 1% | 7% |
| Y2 Analytics/Salt Lake Tribune | Sep 26 – Oct 4, 2020 | 1,214 (LV) | ± 2.8% | 50% | 40% | – | – | 10% | 1% |
| SurveyMonkey/Axios | Sep 1–30, 2020 | 1,192 (LV) | – | 56% | 42% | – | – | – | 2% |
| RMG Research/Deseret News/Hinckley Institute of Politics | Sep 7–12, 2020 | 1,000 (LV) | ± 3.1% | 53% | 35% | 5% | 0% | 1% | 6% |
| SurveyMonkey/Axios | Aug 1–31, 2020 | 893 (LV) | – | 57% | 41% | – | – | – | 2% |
| RMG Research/Scott Rasmussen/Deseret News | Jul 27 – Aug 1, 2020 | 1,000 (RV) | ± 3.1% | 50% | 31% | 3% | 1% | 4% | 11% |
| SurveyMonkey/Axios | Jul 1–31, 2020 | 1,037 (LV) | – | 58% | 40% | – | – | – | 2% |
| SurveyMonkey/Axios | Jun 8–30, 2020 | 412 (LV) | – | 57% | 41% | – | – | – | 1% |
| Y2 Analytics/UtahPolicy.com/KUTV 2 | May 9–15, 2020 | 1,099 (LV) | ± 3% | 44% | 41% | – | – | 9%[lower-alpha 1045] | 5% |
| Scott Rasmussen/Deseret News | Apr 15–21, 2020 | 964 (RV) | ± 3.2% | 51% | 32% | – | – | 8% | 9% |
| Y2 Analytics | Mar 21–30, 2020 | 1,266 (RV) | ± 2.8% | 46% | 41% | – | – | 7% | 5% |
| Scott Rasmussen/Deseret News | Feb 24 – Mar 1, 2020 | 1,000 (RV) | ± 3.1% | 50% | 33% | – | – | 8%[lower-alpha 1046] | 8% |
| Scott Rasmussen/Deseret News | Jan 15–22, 2020 | 1,017 (RV) | ± 3.1% | 49% | 31% | – | – | 13%[lower-alpha 1047] | 7% |
| Y2 Analytics | Jul 31 – Aug 6, 2019 | 149 (RV) | – | 36% | 35% | – | – | 14%[lower-alpha 1048] | 5% |
Vermont
Aggregate polls
| Source of poll aggregation |
Dates administered |
Dates updated |
Joe Biden Democratic |
Donald Trump Republican |
Other/ Undecided [lower-alpha 1] |
Margin |
|---|---|---|---|---|---|---|
| FiveThirtyEight | until October 27, 2020 | October 28, 2020 | 64.4% | 29.1% | 6.5% | Biden +35.3 |
Polls
| Poll source | Date(s) administered |
Sample size[lower-alpha 2] |
Margin of error |
Donald Trump Republican |
Joe Biden Democratic |
Jo Jorgensen Libertarian |
Howie Hawkins Green |
Other | Undecided |
|---|---|---|---|---|---|---|---|---|---|
| SurveyMonkey/Axios | Oct 20 – Nov 2, 2020 | 906 (LV) | ± 4.5% | 26%[lower-alpha 1049] | 71% | - | - | – | – |
| co/efficient/Scott Milne for Lt. Governor[upper-alpha 122] | Oct 19–29, 2020 | 584 (LV) | ± 4.05% | 32% | 62% | - | - | – | 6% |
| SurveyMonkey/Axios | Oct 1–28, 2020 | 1,167 (LV) | – | 29% | 69% | - | - | – | – |
| SurveyMonkey/Axios | Sep 1–30, 2020 | 427 (LV) | – | 34% | 64% | - | - | – | 2% |
| Braun Research/VPR | Sep 3–15, 2020 | 582 (LV) | ± 4% | 32% | 56% | - | - | 8%[lower-alpha 1050] | 3% |
| SurveyMonkey/Axios | Aug 1–31, 2020 | 236 (LV) | – | 29% | 70% | - | - | – | 0% |
| SurveyMonkey/Axios | Jul 1–31, 2020 | 368 (LV) | – | 27% | 71% | - | - | – | 2% |
| SurveyMonkey/Axios | Jun 8–30, 2020 | 113 (LV) | – | 20% | 75% | - | - | – | 5% |
Virginia
- Graphical summary
Aggregate polls
| Source of poll aggregation |
Dates administered |
Dates updated |
Joe Biden Democratic |
Donald Trump Republican |
Other/ Undecided [lower-alpha 1] |
Margin |
|---|---|---|---|---|---|---|
| 270 to Win | September 30 – October 27, 2020 | October 28, 2020 | 53.3% | 40.5% | 6.2% | Biden +12.8 |
| FiveThirtyEight | until October 27, 2020 | October 28, 2020 | 52.9% | 41.1% | 6.0% | Biden +11.8 |
| Average | 53.1% | 40.8% | 6.1% | Biden +12.3 | ||
Polls
| Poll source | Date(s) administered |
Sample size[lower-alpha 2] |
Margin of error |
Donald Trump Republican |
Joe Biden Democratic |
Jo Jorgensen Libertarian |
Howie Hawkins Green |
Other | Undecided |
|---|---|---|---|---|---|---|---|---|---|
| SurveyMonkey/Axios | Oct 20 – Nov 2, 2020 | 4,550 (LV) | ± 2% | 41%[lower-alpha 1051] | 57% | - | - | – | – |
| Swayable | Oct 27 – Nov 1, 2020 | 467 (LV) | ± 6.4% | 39% | 59% | 2% | 1% | – | – |
| Data for Progress | Oct 27 – Nov 1, 2020 | 690 (LV) | ± 3.7% | 43% | 54% | 1% | 0% | 1%[lower-alpha 1052] | – |
| Roanoke College | Oct 23–29, 2020 | 802 (LV) | ± 3.5% | 42% | 53% | 2% | - | 1% | 2% |
| SurveyMonkey/Axios | Oct 1–28, 2020 | 7,663 (LV) | – | 43% | 55% | - | - | – | – |
| Christopher Newport University | Oct 15–27, 2020 | 908 (LV) | ± 3.4% | 41% | 53% | - | - | 2%[lower-alpha 1053] | 4% |
| Swayable | Oct 23–26, 2020 | 351 (LV) | ± 5.2% | 44% | 55% | 1% | - | – | – |
| Virginia Commonwealth University | Oct 13–22, 2020 | 709 (LV) | ± 4.93% | 39% | 51% | - | - | 2%[lower-alpha 1054] | 8%[lower-alpha 1055] |
| Schar School/Washington Post | Oct 13–19, 2020 | 908 (LV) | ± 4% | 41% | 52% | 3% | - | 0%[lower-alpha 1056] | 4% |
| Civiqs/Daily Kos | Oct 11–14, 2020 | 1,231 (LV) | ± 3.1% | 42% | 55% | - | - | 3%[lower-alpha 1057] | 1% |
| Reconnect Research/Roanoke College | Sep 30 – Oct 12, 2020 | 602 (LV) | – | 39%[lower-alpha 1058] | 54% | 4% | - | - | 4% |
| Survey Monkey/Tableau | Sep 15 – Oct 12, 2020 | 4,248 (LV) | – | 43% | 55% | - | - | – | 2% |
| Cygnal/Gade for Virginia[upper-alpha 123] | Oct 9–11, 2020 | 607 (LV) | – | 42% | 51% | - | - | – | – |
| SurveyMonkey/Axios | Sep 1–30, 2020 | 2,882 (LV) | – | 42% | 56% | - | - | – | 2% |
| Cygnal/Gade for Virginia[upper-alpha 123] | Sep 22–25, 2020 | 600 (LV) | – | 41% | 52% | - | - | – | – |
| Christopher Newport University | Sep 9–21, 2020 | 796 (LV) | ± 3.9% | 43% | 48% | - | - | 2%[lower-alpha 1059] | 7% |
| Virginia Commonwealth University | Aug 28 – Sep 7, 2020 | 693 (LV) | ± 6.22% | 39% | 52% | - | - | 1%[lower-alpha 1060] | 8%[lower-alpha 1061] |
| SurveyMonkey/Axios | Aug 1–31, 2020 | 2,626 (LV) | – | 41% | 57% | - | - | – | 2% |
| Roanoke College | Aug 9–22, 2020 | 566 (LV) | ± 4.1% | 39% | 53% | - | - | 3%[lower-alpha 1062] | 5% |
| SurveyMonkey/Axios | Jul 1–31, 2020 | 3,178 (LV) | – | 43% | 55% | - | - | – | 2% |
| Morning Consult | Jul 17–26, 2020 | 1,156 (LV) | ± 2.9% | 41% | 52% | - | - | – | – |
| Virginia Commonwealth University | Jul 11–19, 2020 | 725 (LV) | ± 6.2% | 39% | 50% | - | - | 1% | 10% |
| SurveyMonkey/Axios | Jun 8–30, 2020 | 1,619 (LV) | – | 42% | 57% | - | - | – | 1% |
| Morning Consult | May 17–26, 2020 | 1,148 (LV) | – | 42%[lower-alpha 1063] | 52% | - | - | – | – |
| Roanoke College | May 3–16, 2020 | 563 (LV) | ± 4.1% | 39% | 51% | - | - | – | – |
| Virginia Commonwealth University | Mar 25 – Apr 8, 2020 | 812 (A) | ± 4.5% | 41% | 51% | - | - | – | 8% |
| Hampton University | Feb 25–28, 2020 | 768 (RV) | ± 3.8% | 38% | 45% | - | - | – | – |
| Roanoke College | Feb 9–18, 2020 | 520 (LV) | ± 4.3% | 40% | 48% | - | - | – | – |
| Mason-Dixon | Dec 12–16, 2019 | 625 (RV) | ± 4.0% | 45% | 49% | - | - | – | 6% |
| Virginia Commonwealth University | Dec 2–13, 2019 | 728 (LV) | ± 5.1% | 46% | 49% | - | - | – | 5%[lower-alpha 1064] |
| Virginia Commonwealth University | Sep 23 – Oct 4, 2019 | 645 (LV) | ± 5.0% | 44% | 52% | - | - | – | 4%[lower-alpha 1064] |
| University of Mary Washington/Research America | Sep 3–15, 2019 | 1,009 (A) | ± 3.1% | 37% | 55% | - | - | 1% | 4% |
Washington
Graphical summary
Aggregate polls
| Source of poll aggregation |
Dates administered |
Dates updated |
Joe Biden Democratic |
Donald Trump Republican |
Other/ Undecided [lower-alpha 1] |
Margin |
|---|---|---|---|---|---|---|
| 270 to Win | October 8–15, 2020 | October 27, 2020 | 57.5% | 35.5% | 7.0% | Biden +22.0 |
| FiveThirtyEight | until October 25, 2020 | October 27, 2020 | 58.8% | 35.5% | 5.7% | Biden +23.3 |
| Average | 58.2% | 35.5% | 6.3% | Biden +22.7 | ||
Polls
| Poll source | Date(s) administered |
Sample size[lower-alpha 2] |
Margin of error |
Donald Trump Republican |
Joe Biden Democratic |
Jo Jorgensen Libertarian |
Howie Hawkins Green |
Other | Undecided |
|---|---|---|---|---|---|---|---|---|---|
| SurveyMonkey/Axios | Oct 20 – Nov 2, 2020 | 4,142 (LV) | ± 2% | 35%[lower-alpha 1065] | 62% | - | - | – | – |
| Swayable | Oct 23 – Nov 1, 2020 | 489 (LV) | ± 6% | 39% | 59% | 2% | 1% | – | – |
| SurveyMonkey/Axios | Oct 1–28, 2020 | 7,424 (LV) | – | 36% | 62% | - | - | – | – |
| PPP/NPI | Oct 14–15, 2020 | 610 (LV) | ± 4% | 37% | 60% | - | - | – | 2% |
| SurveyUSA/KING-TV | Oct 8–10, 2020 | 591 (LV) | ± 5.2% | 34% | 55% | - | - | 5%[lower-alpha 1066] | 5% |
| SurveyMonkey/Axios | Sep 1–30, 2020 | 7,953 (LV) | – | 35% | 64% | - | - | – | 2% |
| Strategies 360 | Sep 8–14, 2020 | 501 (RV) | ± 4.4% | 36% | 58% | - | - | – | 7%[lower-alpha 1067] |
| SurveyMonkey/Axios | Aug 1–31, 2020 | 7,489 (LV) | – | 37% | 61% | - | - | – | 2% |
| SurveyMonkey/Axios | Jul 1–31, 2020 | 7,691 (LV) | – | 37% | 62% | - | - | – | 2% |
| SurveyUSA/KING-TV | Jul 22–27, 2020 | 534 (LV) | ± 5.2% | 28% | 62% | - | - | 6%[lower-alpha 1068] | – |
| SurveyMonkey/Axios | Jun 8–30, 2020 | 3,939 (LV) | – | 36% | 62% | - | - | – | 2% |
| Public Policy Polling/NPI | May 19–20, 2020 | 1,070 (LV) | ± 3% | 37% | 59% | - | - | – | 5% |
| SurveyUSA/KING-TV | May 16–19, 2020 | 530 (LV) | ± 5.5% | 31% | 57% | - | - | 5%[lower-alpha 1069] | 7% |
| EMC Research | Mar 31 – Apr 6, 2020 | 583 (A) | ± 4.1% | 39% | 52% | - | - | – | 9% |
| SurveyUSA/KING-TV | Mar 4–6, 2020 | 992 (RV) | ± 3.8% | 34% | 57% | - | - | – | 9% |
| Public Policy Polling/The Cascadia Advocate | Oct 22–23, 2019 | 900 (LV) | ± 3.3% | 37% | 59% | - | - | – | 3% |
| Zogby Interactive/JZ Analytics | Jul 22 – Aug 1, 2019 | 1,265 (LV) | ± 2.8% | 31% | 52% | - | - | – | 17% |
West Virginia
- Graphical summary
Aggregate polls
| Source of poll aggregation |
Dates administered |
Dates updated |
Joe Biden Democratic |
Donald Trump Republican |
Other/ Undecided [lower-alpha 1] |
Margin |
|---|---|---|---|---|---|---|
| 270 to Win | September 1 – October 21, 2020 | October 28, 2020 | 37.7% | 57.7% | 4.6% | Trump +20.0 |
| FiveThirtyEight | until October 27, 2020 | October 28, 2020 | 35.7% | 59.9% | 4.4% | Trump +24.2 |
| Average | 36.7% | 58.8% | 4.5% | Trump +22.1 | ||
Polls
| Poll source | Date(s) administered |
Sample size[lower-alpha 2] |
Margin of error |
Donald Trump Republican |
Joe Biden Democratic |
Jo Jorgensen Libertarian |
Howie Hawkins Mountain |
Other | Undecided |
|---|---|---|---|---|---|---|---|---|---|
| SurveyMonkey/Axios | Oct 20 – Nov 2, 2020 | 816 (LV) | ± 5% | 67%[lower-alpha 1070] | 32% | – | – | – | – |
| SurveyMonkey/Axios | Oct 1–28, 2020 | 1,359 (LV) | – | 66% | 32% | – | – | – | – |
| Triton Polling and Research/WMOV | Oct 19–21, 2020 | 544 (LV) | ± 4.2% | 58% | 38% | – | – | – | 4% |
| Research America Inc./West Virginia Metro News | Oct 6–9, 2020 | 450 (LV) | ± 4.6% | 53% | 39% | 4% | 1% | – | 3% |
| Triton Polling & Research/WMOV | Sep 29–30, 2020[lower-alpha 1071] | 525 (RV) | ± 4.3% | 56% | 38% | – | – | – | 5% |
| SurveyMonkey/Axios | Sep 1–30, 2020 | 516 (LV) | – | 62% | 36% | – | – | – | 2% |
| SurveyMonkey/Axios | Aug 1–31, 2020 | 496 (LV) | – | 65% | 32% | – | – | – | 2% |
| SurveyMonkey/Axios | Jul 1–31, 2020 | 494 (LV) | – | 67% | 32% | – | – | – | 1% |
| SurveyMonkey/Axios | Jun 8–30, 2020 | 264 (LV) | – | 72% | 27% | – | – | – | 1% |
| WPA Intelligence/Club for Growth[upper-alpha 124] | Jan 7–9, 2020 | 500 (LV) | ± 4.4% | 66% | 31% | – | – | – | 3% |
Wisconsin
Graphical summary
Aggregate polls
| Source of poll aggregation |
Dates administered |
Dates updated |
Donald Trump Republican |
Joe Biden Democratic |
Other/ Undecided [lower-alpha 1] |
Margin |
|---|---|---|---|---|---|---|
| 270 to Win | October 26 – November 1, 2020 | November 1, 2020 | 43.8% | 51.8% | 4.4% | Biden +8.0 |
| Real Clear Politics | October 21 – November 1, 2020 | November 1, 2020 | 44.1% | 50.7% | 5.2% | Biden +6.6 |
| FiveThirtyEight | until November 1, 2020 | November 1, 2020 | 44.0% | 51.9% | 4.1% | Biden +7.9 |
| Average | 44.0% | 51.5% | 4.6% | Biden +7.5 | ||
2020 polls
| Poll source | Date(s) administered |
Sample size[lower-alpha 2] |
Margin of error |
Donald Trump Republican |
Joe Biden Democratic |
Jo Jorgensen Libertarian |
Howie Hawkins Green |
Other | Undecided |
|---|---|---|---|---|---|---|---|---|---|
| SurveyMonkey/Axios | Oct 20 – Nov 2 | 2,814 (LV) | ± 2.5% | 44%[lower-alpha 1072] | 54% | - | - | – | – |
| Research Co. | Oct 31 – Nov 1 | 450 (LV) | ± 4.6% | 45% | 54% | - | - | 1%[lower-alpha 1073] | 7% |
| Change Research/CNBC | Oct 29 – Nov 1 | 553 (LV) | ± 4.17% | 45% | 53% | 2% | - | – | 0% |
| Civiqs/Daily Kos | Oct 29 – Nov 1 | 789 (LV) | ± 3.6% | 47% | 51% | - | - | 1%[lower-alpha 1074] | 0% |
| Swayable | Oct 27 – Nov 1 | 253 (LV) | ± 8.2% | 45% | 55% | 1% | - | – | – |
| Ipsos/Reuters | Oct 27 – Nov 1 | 696 (LV) | ± 4.2% | 43%[lower-alpha 14] | 53% | 2% | 0% | 2%[lower-alpha 1075] | – |
| 43%[lower-alpha 1076] | 53% | - | - | 2%[lower-alpha 1077] | 2% | ||||
| 45%[lower-alpha 1078] | 53% | - | - | 2%[lower-alpha 1079] | – | ||||
| AtlasIntel | Oct 30–31 | 781 (LV) | ± 3% | 49% | 51% | - | - | – | 1% |
| Susquehanna Polling & Research Inc./Center for American Greatness[upper-alpha 8] | Oct 29–31 | 450 (LV) | ± 4.6% | 46% | 49% | - | - | 2%[lower-alpha 1080] | 1% |
| Morning Consult | Oct 22–31 | 1,002 (LV) | ± 3% | 41% | 54% | - | - | – | – |
| Emerson College | Oct 29–30 | 751 (LV) | ± 3.1% | 45%[lower-alpha 1081] | 52% | - | - | 2%[lower-alpha 1082] | – |
| AtlasIntel | Oct 29–30 | 672 (LV) | ± 4% | 50% | 49% | - | - | 2% | – |
| CNN/SSRS | Oct 29–30 | 873 (LV) | ± 3.9% | 44% | 52% | 3% | - | 0%[lower-alpha 1083] | 2% |
| Siena College/NYT Upshot | Oct 26–30 | 1,253 (LV) | ± 3.2% | 41% | 52% | 2% | - | 1%[lower-alpha 1084] | 4%[lower-alpha 1085] |
| Redfield & Wilton Strategies | Oct 26–29 | 800 (LV) | – | 41% | 53% | 2% | - | 1% | 2% |
| SurveyMonkey/Axios | Oct 1–28 | 4,569 (LV) | ± 2.0% | 43% | 55% | - | - | – | – |
| Swayable | Oct 23–26 | 313 (LV) | ± 7.2% | 45% | 54% | 1% | - | – | – |
| Ipsos/Reuters | Oct 20–26 | 664 (LV) | ± 4.3% | 44%[lower-alpha 14] | 53% | 2% | 1% | 3%[lower-alpha 1086] | – |
| 44%[lower-alpha 1087] | 53% | - | - | 2%[lower-alpha 1088] | 2% | ||||
| Trafalgar Group | Oct 24–25 | 1,082 (LV) | ± 2.89% | 47% | 47% | 3% | - | 1%[lower-alpha 1089] | 1% |
| Marquette Law School | Oct 21–25 | 749 (LV) | ± 4.4% | 43% | 48% | 2% | - | 7%[lower-alpha 1090] | 0% |
| ABC/Washington Post | Oct 20–25 | 809 (LV) | ± 4% | 40% | 57% | 2% | - | 1%[lower-alpha 1091] | 1% |
| Gravis Marketing | Oct 23 | 677 (LV) | ± 3.8% | 43% | 54% | - | - | – | 3% |
| YouGov/University of Wisconsin-Madison | Oct 13–21 | 647 (LV) | ± 4.07% | 44% | 53% | - | - | 3%[lower-alpha 1092] | – |
| Fox News | Oct 17–20 | 1,037 (LV) | ± 3% | 44% | 49% | 2% | - | 1%[lower-alpha 1093] | 4% |
| RMG Research/PoliticalIQ | Oct 14–20 | 800 (LV) | ± 3.5% | 44%[lower-alpha 14] | 50% | - | - | 3%[lower-alpha 1094] | 4% |
| 42%[lower-alpha 1095] | 52% | - | - | 3%[lower-alpha 1096] | 4% | ||||
| 45%[lower-alpha 1097] | 48% | - | - | 3%[lower-alpha 1098] | 4% | ||||
| Morning Consult | Oct 11–20 | 1,038 (LV) | ± 3% | 42% | 54% | - | - | – | – |
| Susquehanna Polling and Research Inc./Center for American Greatness[upper-alpha 8] | Oct 16–19 | 500 (LV) | ± 4.3% | 45% | 45% | 5% | - | 3%[lower-alpha 1099] | 3% |
| Change Research/CNBC | Oct 16–19 | 447 (LV)[lower-alpha 41] | – | 44% | 52% | - | - | – | – |
| Latino Decisions/DFER[upper-alpha 125] | Oct 14–19 | 400 (LV) | ± 5% | 45% | 50% | - | - | – | 4% |
| Ipsos/Reuters | Oct 13–19 | 663 (LV) | ± 4.3% | 45%[lower-alpha 14] | 51% | 2% | 0% | 3%[lower-alpha 1100] | – |
| 43%[lower-alpha 1101] | 51% | - | - | 3%[lower-alpha 1102] | 3% | ||||
| Trafalgar Group | Oct 14–16 | 1,051 (LV) | ± 2.94% | 46% | 48% | 2% | - | 1% | 3% |
| YouGov/CBS | Oct 13–16 | 1,112 (LV) | ± 3.5% | 45% | 50% | - | - | 3%[lower-alpha 1103] | 2% |
| Trafalgar Group/Restoration PAC[upper-alpha 52] | Oct 11–13 | 1,043 (LV) | ± 2.95% | 45% | 47% | 3% | – | 2%[lower-alpha 1104] | 3% |
| Redfield & Wilton Strategies | Oct 10–13 | 691 (LV) | – | 40%[lower-alpha 41] | 53% | 2% | 0% | – | – |
| David Binder Research/Focus on Rural America | Oct 10–13 | 200 (LV) | – | 43% | 53% | - | - | – | – |
| Civiqs/Rust Belt Rising[upper-alpha 53] | Oct 8–11 | 560 (LV) | ± 4.4% | 45% | 53% | - | - | 2%[lower-alpha 1105] | 1% |
| Siena College/NYT Upshot | Oct 8–11 | 789 (LV) | ± 4% | 41% | 51% | 3% | - | 0%[lower-alpha 1106] | 5%[lower-alpha 1107] |
| Ipsos/Reuters | Oct 6–11 | 577 (LV) | ± 4.7% | 45%[lower-alpha 14] | 51% | 2% | 0% | 1%[lower-alpha 1108] | – |
| 44%[lower-alpha 1109] | 51% | - | - | 3%[lower-alpha 1110] | 2% | ||||
| Morning Consult | Oct 2–11 | 1,067 (LV) | ± 3% | 44% | 51% | - | - | – | – |
| Redfield & Wilton Strategies | Oct 9–10 | 613 (LV) | – | 45%[lower-alpha 41] | 49% | 2% | - | – | – |
| Baldwin Wallace University | Sep 30 – Oct 8 | 883 (LV) | ± 3.4% | 43% | 49% | 2% | 0% | 1%[lower-alpha 1111] | 6% |
| Redfield & Wilton Strategies | Oct 4–7 | 688 (LV) | ± 3.74% | 41% | 51% | 1% | - | 1%[lower-alpha 1112] | 6% |
| Ipsos/Reuters | Sep 29 – Oct 5 | 601 (LV) | ± 4.6% | 44% | 50% | - | - | 2%[lower-alpha 1113] | 4% |
| Change Research/CNBC | Oct 2–4 | 442 (LV) | – | 44% | 51% | - | - | – | – |
| Marquette Law School | Sep 30 – Oct 4 | 805 (RV) | – | 41% | 46% | 5% | - | 7%[lower-alpha 1114] | 2% |
| 700 (LV) | 42% | 47% | 4% | - | 2%[lower-alpha 1115] | 1% | |||
| SurveyMonkey/Axios | Sep 1–30 | 3,806 (LV) | – | 44% | 53% | - | - | – | 2% |
| Trafalgar Group/Restoration PAC[upper-alpha 52] | Sep 25–28 | 1,084 (LV) | ± 2.89% | 44% | 47% | 3% | - | 2%[lower-alpha 1116] | 3% |
| Redfield & Wilton Strategies | Sep 23–27 | 663 (LV) | ± 3.81% | 43% | 48% | 2% | - | 0%[lower-alpha 1117] | 7% |
| Susquehanna Polling & Research Inc./Center for American Greatness[upper-alpha 8] | Sep 23–26 | 500 (LV) | ± 4.3% | 46% | 48% | - | - | – | – |
| Trafalgar Group (R) | Sep 22–24 | 1,189 (LV) | ± 2.76% | 45% | 48% | 3% | - | 2%[lower-alpha 1118] | 3% |
| Marist College/NBC | Sep 20–24 | 727 (LV) | ± 4.6% | 44% | 54% | - | - | 1% | 1% |
| Baldwin Wallace University | Sep 9–22 | 863 (LV) | ± 3.7% | 41% | 50% | 2% | 0% | 1%[lower-alpha 1119] | 6% |
| YouGov/UW-Madison Elections Research Center/Wisconsin State Journal |
Sep 10–21 | 664 (LV) | – | 46% | 50% | - | - | – | – |
| Change Research/CNBC | Sep 18–20 | 571 (LV) | – | 42% | 51% | - | - | – | – |
| Hart Research Associates/Human Rights Campaign[upper-alpha 126] | Sep 17–19 | 400 (LV) | ± 4.9% | 44% | 51% | - | - | – | – |
| Redfield & Wilton Strategies | Sep 12–16 | 636 (LV) | ± 3.89% | 41% | 47% | 1% | 1% | 1%[lower-alpha 1120] | 10% |
| Ipsos/Reuters | Sep 11–16 | 609 (LV) | – | 43% | 48% | - | - | 2%[lower-alpha 1121] | 6% |
| Morning Consult | Sep 7–16 | 800 (LV) | ± 3.5% | 42%[lower-alpha 1122] | 51% | - | - | – | – |
| Civiqs/Rust Belt Rising[upper-alpha 53] | Sep 11–15 | 549 (RV) | ± 3.9% | 44%[lower-alpha 41] | 51% | - | - | 2%[lower-alpha 1123] | 2% |
| Morning Consult | Sep 6–15 | 800 (LV) | ± 3.5% | 42% | 51% | - | - | – | – |
| CNN/SSRS | Sep 9–13 | 816 (LV) | ± 4.2% | 42% | 52% | 3% | - | 1%[lower-alpha 1124] | 1% |
| ABC/Washington Post | Sep 8–13 | 605 (LV) | ± 4.5% | 46% | 52% | - | - | 1%[lower-alpha 1125] | 1% |
| Siena College/NYT Upshot | Sep 8–10 | 760 (LV) | ± 4.7% | 43% | 48% | 2% | 0% | 2%[lower-alpha 1126] | 6%[lower-alpha 1127] |
| Emerson College | Sep 6–8 | 823 (LV) | ± 3.4% | 45%[lower-alpha 1128] | 52% | - | - | 4%[lower-alpha 1129] | – |
| Benenson Strategy Group/GS Group/AARP | Aug 28 – Sep 8 | 1,200 (LV) | ± 2.8% | 45% | 50% | - | - | 1%[lower-alpha 1130] | 4% |
| Change Research/CNBC | Sep 4–6 | 501 (LV) | – | 44% | 50% | - | - | 6%[lower-alpha 1131] | – |
| Morning Consult | Aug 27 – Sep 5 | 763 (LV) | ± 3.5% | 44% | 50% | - | - | – | – |
| YouGov/CBS | Sep 2–4 | 978 (LV) | ± 3.7% | 44% | 50% | - | - | 2%[lower-alpha 1132] | 4% |
| Redfield & Wilton Strategies | Aug 30 – Sep 4 | 670 (LV) | ± 3.78% | 41% | 50% | 2% | 0% | 0%[lower-alpha 1133] | 6% |
| Marquette Law School | Aug 30 – Sep 3 | 688 (LV) | – | 44% | 48% | 4% | - | 2%[lower-alpha 1134] | 2% |
| Pulse Opinion Research/Rasmussen Reports | Sep 1–2 | 1,000 (LV) | ± 3% | 43% | 51% | - | - | 3%[lower-alpha 1135] | 2% |
| Fox News | Aug 29 – Sep 1 | 801 (LV) | ± 3.5% | 42% | 50% | 2% | – | 1%[lower-alpha 1136] | 5% |
| 853 (RV) | ± 3% | 41% | 49% | 2% | – | 2%[lower-alpha 1137] | 5% | ||
| SurveyMonkey/Axios | Aug 1–31 | 1,913 (LV) | – | 49% | 48% | - | - | – | 2% |
| Opinium/The Guardian | Aug 21–28 | 700 (LV) | – | 40% | 53% | - | - | 1% | 5% |
| Morning Consult | Aug 17–26 | 797 (LV) | ± 3.5% | 42% | 52% | - | - | – | – |
| Change Research/CNBC | Aug 21–23 | 925 (LV) | – | 44% | 49% | - | - | – | – |
| Trafalgar Group | Aug 14–23 | 1,011 (LV) | ± 2.99% | 46% | 45% | 4% | - | 2%[lower-alpha 1138] | 3% |
| Hodas & Associates/Restoration PAC[upper-alpha 52] | Aug 17–20 | 600 (LV) | – | 44% | 52% | - | - | – | 4% |
| Redfield and Wilton Strategies | Aug 13–17 | 672 (LV) | ± 3.9% | 40% | 49% | 1% | 1% | 2%[lower-alpha 1139] | 7% |
| Civiqs/Rust Belt Rising[upper-alpha 53] | Aug 13–17 | 753 (RV) | – | 45% | 51% | - | - | 2%[lower-alpha 1140] | 2% |
| Morning Consult | Aug 7–16 | 788 (LV) | ± 3.5% | 43%[lower-alpha 1141] | 49% | - | - | 2%[lower-alpha 1142] | 5% |
| Morning Consult | Aug 4–13 | 797 (LV) | ± 3.5% | 43% | 50% | - | - | – | – |
| Change Research/CNBC | Aug 6–9 | 384 (LV) | – | 43% | 47% | - | - | – | – |
| Marquette Law School | Aug 4–9 | 694 (LV) | ± 3.8% | 46% | 50% | - | - | 3%[lower-alpha 1143] | 1% |
| YouGov/CBS | Aug 4–7 | 994 (LV) | ± 3.8% | 42% | 48% | - | - | 3%[lower-alpha 1144] | 7% |
| Pulse Opinion Research/Rasmussen Reports/American Greatness PAC[upper-alpha 8] | Aug 5–6 | 750 (LV) | – | 43% | 55% | - | - | 1% | 1% |
| YouGov/University of Wisconsin-Madison | Jul 27 – Aug 6 | 734 (RV) | ± 4.9% | 43% | 49% | - | - | 4%[lower-alpha 1145] | 4% |
| OnMessage Inc./Heritage Action[upper-alpha 127] | Aug 2–4 | 400 (LV) | ± 4.7% | 47% | 47% | - | - | – | 6% |
| Morning Consult | Jul 25 – Aug 3 | 797 (LV) | ± 3.5% | 41% | 51% | - | - | – | – |
| David Binder Research | Jul 30–31 | 200 (LV) | – | 42% | 53% | - | - | – | – |
| SurveyMonkey/Axios | Jul 1–31 | 2,173 (LV) | – | 48% | 50% | - | - | – | 2% |
| Hodas & Associates/Restoration PAC[upper-alpha 52] | Jul 22–27 | 600 (LV) | – | 38% | 52% | - | - | – | 10% |
| Change Research/CNBC | Jul 24–26 | 392 (LV) | – | 43% | 48% | - | - | – | – |
| Redfield & Wilton Strategies | Jul 19–24 | 742 (LV) | – | 35% | 45% | 2% | 0% | 3%[lower-alpha 1146] | 15% |
| Morning Consult | Jul 15–24 | 797 (LV) | ± 3.5% | 44% | 49% | - | - | – | – |
| Gravis Marketing | Jul 22 | 796 (RV) | ± 3.5% | 42% | 50% | - | - | – | 7% |
| Global Strategy Group (D) | Jul 11–17 | 600 (V) | ± 4.0% | 42% | 51% | - | - | 2%[lower-alpha 1147] | 4%[lower-alpha 1148] |
| Spry Strategies/American Principles Project[upper-alpha 128] | Jul 11–16 | 700 (LV) | ± 3.7% | 45% | 46% | - | - | – | 8% |
| Morning Consult | Jul 5–14 | 797 (LV) | ± 3.5% | 41% | 50% | - | - | – | – |
| Change Research/CNBC | Jul 10–12 | 601 (LV) | – | 42% | 48% | - | - | – | – |
| Morning Consult | Jun 25 – Jul 4 | 797 (LV) | ± 3.5% | 44% | 50% | - | - | – | – |
| SurveyMonkey/Axios | Jun 8–30 | 813 (LV) | – | 47% | 51% | - | - | – | 2% |
| Change Research/CNBC | Jun 26–28 | 502 (LV)[lower-alpha 41] | – | 43% | 51% | - | - | – | – |
| Trafalgar Group | Jun 25–26 | 1,021 (LV) | ± 3.0% | 46% | 45% | - | - | 8%[lower-alpha 1149] | 2% |
| Ogden & Fry | Jun 20–24 | 825 (LV) | ± 3.48% | 44% | 45% | - | - | – | 10% |
| Morning Consult | Jun 15–24 | 797 (LV) | ± 3.5% | 44% | 50% | - | - | – | – |
| Redfield & Wilton Strategies | Jun 14–19 | 846 (LV) | ± 3.37% | 36% | 45% | 1% | 1% | 2%[lower-alpha 1150] | 15% |
| Marquette Law School | Jun 14–18 | 686 (LV) | – | 44% | 52% | - | - | 3%[lower-alpha 1151] | 1% |
| Hodas & Associates/Restoration PAC (R) | Jun 12–16 | 600 (LV) | ± 4.0% | 39% | 55% | - | - | – | 6% |
| NYT Upshot/Siena College | Jun 8–15 | 655 (RV) | ± 4.3% | 38% | 49% | - | - | 5%[lower-alpha 1152] | 8% |
| Morning Consult | Jun 5–14 | 797 (LV) | ± 3.5% | 44% | 49% | - | - | – | – |
| Change Research/CNBC | Jun 12–14 | 231 (LV)[lower-alpha 41] | – | 44% | 48% | - | - | 5%[lower-alpha 1153] | – |
| Morning Consult | May 26 – Jun 4 | 797 (LV) | ± 3.5% | 44% | 48% | - | - | – | – |
| Fox News | May 30 – Jun 2 | 801 (RV) | ± 3.5% | 40% | 49% | - | - | 6%[lower-alpha 1154] | 5% |
| Change Research/CNBC | May 29–31 | 382 (LV)[lower-alpha 41] | – | 45% | 45% | - | - | 5% | 6% |
| Morning Consult | May 16–25 | 797 (LV) | ± 3.5% | 44% | 48% | - | - | – | – |
| Morning Consult | May 6–15 | 797 (LV) | ± 3.5% | 42% | 49% | - | - | – | – |
| Redfield & Wilton Strategies | May 10–14 | 875 (LV) | ± 3.3% | 38% | 48% | - | - | 3%[lower-alpha 1155] | 10% |
| Hodas & Associates/Restoration PAC (R) | May 6–8 | 600 (LV) | ± 3% | 42% | 51% | - | - | – | 8% |
| Marquette Law School | May 3–7 | 650 (LV) | – | 45% | 49% | - | - | 4%[lower-alpha 1156] | 2% |
| Morning Consult | Apr 26 – May 5 | 797 (LV) | ± 3.5% | 43% | 49% | - | - | – | – |
| Public Policy Polling[upper-alpha 129] | Apr 20–21 | 1,415 (RV) | – | 45% | 50% | - | - | – | 4% |
| Ipsos | Apr 15–20 | 645 (RV) | ± 5.0% | 40% | 43% | - | - | – | – |
| Hodas & Associates/Restoration PAC (R) | Apr 13–15 | 600 (RV) | ± 3.0% | 45% | 50% | - | - | – | 4% |
| Hart Research/CAP Action[upper-alpha 130] | Apr 6–8 | 303 (RV) | – | 47% | 48% | - | - | 2% | 3% |
| Marquette Law School | Mar 24–29 | 813 (RV) | – | 45% | 48% | - | - | 4%[lower-alpha 1157] | 3% |
| Baldwin Wallace University Great Lakes | Mar 17–25 | 822 (RV) | ± 3.8% | 45% | 45% | - | - | – | 10% |
| Change Research | Mar 21–23 | 510 (LV) | – | 49% | 45% | - | – | 6% | |
| Hodas & Associates/Restoration PAC (R) | Mar 17–19 | 600 (RV) | – | 49% | 45% | - | - | – | – |
| Public Policy Polling | Mar 10–11 | 1,727 (RV) | – | 45% | 48% | - | - | – | 6% |
| YouGov/Yahoo News | Mar 6–8 | 459 (RV) | – | 42% | 44% | - | - | 6%[lower-alpha 1158] | 7% |
| Firehouse Strategies/Øptimus | Mar 5–7 | 502 (LV) | ± 4.7% | 45% | 43% | - | - | – | – |
| Marquette Law School | Feb 19–23 | 1,000 (RV) | – | 46% | 46% | - | - | 5%[lower-alpha 1159] | 3% |
| YouGov | Feb 11–20 | 936 (RV) | ± 4.0% | 43% | 45% | - | - | – | – |
| Quinnipiac University | Feb 12–18 | 823 (RV) | ± 3.4% | 49% | 42% | - | - | 4%[lower-alpha 1160] | 4% |
| Expedition Strategies/Progressive Policies Institute | Feb 6–18 | 500 (RV) | – | 44% | 42% | - | - | – | 13% |
| Tarrance Group/Wisconsin Manufacturers and Commerce | Jan 14–16 | 500 (LV) | ± 4.5% | 46% | 47% | - | - | – | 6% |
| Marquette Law School | Jan 8–12 | 701 (LV) | – | 47% | 48% | - | - | 4%[lower-alpha 1161] | 2% |
| Fox News | Jan 5–8 | 1,504 (RV) | ± 2.5% | 41% | 46% | - | - | 8%[lower-alpha 1162] | 4% |
2019 polls
| Poll source | Date(s) administered |
Sample size[lower-alpha 2] |
Margin of error |
Donald Trump Republican |
Joe Biden Democratic |
Other | Undecided |
|---|---|---|---|---|---|---|---|
| Marquette Law School | Dec 3–8 | 652 (LV) | – | 47% | 49% | 2%[lower-alpha 1163] | 1% |
| Firehouse Strategies/Øptimus | Dec 3–5 | 610 (LV) | ± 4.1% | 48% | 39% | 8%[lower-alpha 1164] | 5%[lower-alpha 1165] |
| Marquette Law School | Nov 13–17 | 685 (LV) | – | 48% | 45% | 5%[lower-alpha 1166] | 2% |
| NYT Upshot/Siena College | Oct 13–26 | 651 (LV) | ± 4.4% | 44% | 46% | – | – |
| Marquette Law School | Oct 13–17 | 657 (LV) | – | 44% | 51% | 3%[lower-alpha 1167] | 1% |
| Fox News | Sep 29 – Oct 2 | 1,512 (RV) | ± 2.5% | 39% | 48% | 5% | 6% |
| Firehouse Strategies/Øptimus | Sep 7–9 | 534 (LV) | ± 4.0% | 42% | 44% | 14% | – |
| Marquette Law School | Aug 25–29 | 672 (LV) | – | 44% | 51% | 3%[lower-alpha 1168] | 2% |
| Firehouse Strategies/Øptimus | Jun 11–13 | 535 (LV) | ± 4.3% | 40% | 46% | 14% | – |
| WPA Intelligence | Apr 27–30 | 200 (LV) | ± 6.9% | 46% | 42% | – | 9% |
| Zogby Analytics | Apr 15–18 | 802 (LV) | ± 3.5% | 40% | 50% | – | 11% |
| Firehouse Strategies/Øptimus | Mar 19–21 | 616 (LV) | ± 4.1% | 40% | 53% | 5% | – |
| Emerson College | Mar 15–17 | 775 (RV) | ± 3.5% | 46% | 54% | – | – |
Wyoming
Graphical summary
Aggregate polls
| Source of poll aggregation |
Dates updated |
Joe Biden Democratic |
Donald Trump Republican |
Other/ Undecided [lower-alpha 1] |
Margin |
|---|---|---|---|---|---|
| FiveThirtyEight | October 28, 2020 | 29.7% | 65.2% | 5.1% | Trump +35.5 |
Polls
Polls with a sample size of <100 have their sample size entries marked in red to indicate a lack of reliability.
| Poll source | Date(s) administered |
Sample size[lower-alpha 2] |
Margin of error |
Donald Trump Republican |
Joe Biden Democratic |
Jo Jorgensen Libertarian |
Other | Undecided |
|---|---|---|---|---|---|---|---|---|
| SurveyMonkey/Axios | Oct 20 – Nov 2, 2020 | 367 (LV) | ± 7% | 66%[lower-alpha 1169] | 33% | – | – | – |
| University of Wyoming | Oct 8–28, 2020 | 614 (LV) | ± 4% | 59% | 31% | 5% | – | – |
| SurveyMonkey/Axios | Oct 1–28, 2020 | 739 (LV) | – | 68% | 31% | – | – | – |
| SurveyMonkey/Axios | Sep 1–30, 2020 | 236 (LV) | – | 65% | 34% | – | – | 1% |
| SurveyMonkey/Axios | Aug 1–31, 2020 | 211 (LV) | – | 74% | 25% | – | – | 1% |
| SurveyMonkey/Axios | Jul 1–31, 2020 | 246 (LV) | – | 70% | 28% | – | – | 2% |
| SurveyMonkey/Axios | Jun 8–30, 2020 | 98 (LV) | – | 78% | 22% | – | – | 0% |
See also
- Nationwide opinion polling for the 2020 United States presidential election
- Nationwide opinion polling for the 2020 Democratic Party presidential primaries
- Statewide opinion polling for the 2020 Democratic Party presidential primaries
- Opinion polling for the 2020 Republican Party presidential primaries
- 2020 Democratic National Convention
- 2020 Republican National Convention
Notes
- General footnotes
- Calculated by taking the difference of 100% and all other candidates combined.
- Key:
A – all adults
RV – registered voters
LV – likely voters
V – unclear - Overlapping sample with the previous SurveyMonkey/Axios poll, but more information available regarding sample size
- "Other candidate or write-in" with 0%
- "Refused" with 0%
- "Someone else" with 2%
- Key:
A – all adults
RV – registered voters
LV – likely voters
V – unclear - Overlapping sample with the previous SurveyMonkey/Axios poll, but more information available regarding sample size
- "Someone else" and would not vote with 1%
- Includes "Refused"
- "Someone else" with 3%
- Poll's funding crowdsourced by Election Twitter.
- Key:
A – all adults
RV – registered voters
LV – likely voters
V – unclear - Standard VI response
- "Some other candidate" and West (B) with 1%; would not vote with 0%
- If only Biden, Trump and "some other candidate" were available
- "Some other candidate" with 2%; would not vote with 0%
- Results considering those who lean towards a given candidate among those initially predisposed towards abstention, indecision or a candidate besides Biden or Trump in the response section immediately above
- "Some other candidate" with 2%
- Overlapping sample with the previous SurveyMonkey/Axios poll, but more information available regarding sample size
- "Other candidate or write-in" with 0%
- "Other" with 1.5%
- "Someone else" with 6%
- "Refused" with 5%; "Other" with 1%
- "Someone else" with 1%; would not vote with 0%
- Includes "Refused"
- "None of these" with 1%; "Other" with no voters
- "Some other candidate" with 3%
- "Someone else" with 1.7%
- "Some other candidate" with 2%; West (B) with 1%; would not vote with 0%
- If only Biden, Trump and "some other candidate" were available
- "Some other candidate" with 3%; would not vote with 0%
- "Refused" with 1%
- "Someone else" with 2%
- With voters who lean towards a given candidate
- "Other" with 1%; "Refused" with 0%
- "Some other candidate" with 2%; West (B) and would not vote with 0%
- If only Biden, Trump and "some other candidate" were available
- "Some other candidate" with 3%; would not vote with 0%
- "Some other candidate" with 3%
- Additional data sourced from FiveThirtyEight
- "Some other candidate" with 3%
- Results generated with high Democratic turnout model
- "Some other candidate" with 3%
- Results generated with high Republican turnout model
- "Some other candidate" with 3%
- "Refused" with 4%; "Other" with 1%
- "Someone else/third party" with 3%
- "Some other candidate" and would not vote with 1%; West (B) with 0%
- If only Biden, Trump and "some other candidate" were available
- "Some other candidate" with 2%; would not vote with 0%
- "Other candidate" with 1%; "No one" with no voters
- With a likely voter turnout model featuring high turnout
- With a likely voter turnout model featuring low turnout
- "Someone else" with 2%
- "Refused" with 0%
- If the only candidates were Biden and Trump
- "Refused" with 0%
- "Another Third Party/Write-in" with 1%
- "Some other candidate" with 2%; would not vote with 0%
- "Refused" with 3%
- "Some other candidate" with 3%; "Refused" with 2%
- "Someone else" with 1%; would not vote with 0%
- Includes "Refused"
- "Refused" with 1%
- "Another candidate" with 2%
- If the only candidates were Biden and Trump
- "Another Third Party/Write-in" with 1%
- "Neither" with 2%; "other" with 0%; would not vote with no voters
- "Some other candidate" with 2%; would not vote with 0%
- "Another Third Party/Write-in" with 1%
- "No one" with 1%; "Other candidate" with 0%
- With a likely voter turnout model featuring higher turnout than in the 2016 presidential election
- With a likely voter turnout model featuring lower turnout than in the 2016 presidential election
- "Someone else" with 1%; would not vote with 0%
- Includes "Refused"
- "Someone else" with 2%; would not vote with 1%; "Refused" with 0%
- "Someone else/third party" with 3%
- Would not vote with 1%
- Overlapping sample with the previous Morning Consult poll, but more information available regarding sample size
- "Other/not sure" with 6%
- West (B) and "Another Third Party/Write-in" with 0%
- "Other" with 1%
- "Other" with 2%; would not vote with 1%
- Listed as Jacob Hornberger (L)
- If the only candidates were Biden and Trump
- West (B) with 2%; "Another third party/write-in" with 1%
- Including voters who lean towards a given candidate
- "Another Party Candidate" with 1%
- If the only candidates were Biden and Trump
- Overlapping sample with the previous Morning Consult poll, but more information available regarding sample size
- Not yet released
- "Other" with 1%; "Neither" 3%
- West (B) with 2%; "Another Third Party/Write-In" with 1%
- Not yet released
- "Someone else/third party" with 4%; would not vote with 0%
- "Refused" with 0%
- Not yet released
- "Other" with 3.1%; "refused" with 0.2%
- Not yet released
- "other" with 2%
- "Another candidate" and would not vote with 2%
- "Someone else" with 5%
- Not yet released
- "Libertarian Party candidate/Green Party candidate" with 5%
- Not yet released
- "Other" with 5%; would not vote with 1%
- Overlapping sample with the previous Morning Consult poll, but more information available regarding sample size
- Not yet released
- "Some other candidate" with 4.3%
- Includes "refused"
- "Third party/write-in" with 3%
- "Refused" with 1%
- Not yet released
- Refused with 0%
- Overlapping sample with the previous SurveyMonkey/Axios poll, but more information available regarding sample size
- "Someone else" with 2%
- "Another candidate" with 5%
- Key:
A – all adults
RV – registered voters
LV – likely voters
V – unclear - Overlapping sample with the previous SurveyMonkey/Axios poll, but more information available regarding sample size
- "Someone else" with 4%
- Overlapping sample with the previous SurveyMonkey/Axios poll, but more information available regarding sample size
- De La Fuente (A) and De La Riva (PSOL) with 0%
- De La Fuente listed as Guerra
- Would not vote with 1%; "Someone else" with no voters
- "Another candidate" with 3%
- "Another Third Party/Write-in" with 1%
- De La Fuente (A) and De La Riva (PSOL) with 0%
- De La Fuente listed as Guerra
- "Would not vote" with 1%; "Someone else" with no voters
- "Someone else" with 3%
- "Another Third Party/Write-in" with 2%
- "Someone else" with 4%; would not vote with 2%
- Including voters who lean towards a given candidate
- Other with 0%; neither with 3%
- Other with 0%; neither with 3%
- Overlapping sample with the previous SurveyMonkey/Axios poll, but more information available regarding sample size
- Additional data sourced from FiveThirtyEight
- "Other candidate or write-in" with 0%
- "Someone else" with 3%
- "Some other candidate" with 1%
- "Someone else" with 3%
- "Other candidate" with 3%
- "Some other candidate" with 5%
- Overlapping sample with the previous Morning Consult poll, but more information available regarding sample size
- Would not vote with 2%
- West (B) with 1%
- Overlapping sample with the previous Morning Consult poll, but more information available regarding sample size
- Overlapping sample with the previous and subsequent Morning Consult polls, but more information available regarding sample size
- Overlapping sample with the previous Morning Consult poll, but more information available regarding sample size
- "Other candidate" with 3%
- Would not vote/would not vote for president with 1%
- Overlapping sample with the previous SurveyMonkey/Axios poll, but more information available regarding sample size
- "Someone else" with 7%
- "Someone else" with 2%; would not vote with 1%
- Overlapping sample with the previous SurveyMonkey/Axios poll, but more information available regarding sample size
- "None/other/undecided" with 10%
- Overlapping sample with the previous SurveyMonkey/Axios poll, but more information available regarding sample size
- "Someone else" with 1%
- Overlapping sample with the previous SurveyMonkey/Axios poll, but more information available regarding sample size
- "Refused/would not vote" with 2%; "Another candidate" with 0%
- "Someone else" with 1%
- "Other candidate or write-in" with 0%
- West (B) with 1%; "Some other candidate" and would not vote with 0%
- If only Biden, Trump and "some other candidate" were available
- "Some other candidate" with 2%; would not vote with 0%
- Results considering those who lean towards a given candidate among those initially predisposed towards abstention, indecision or a candidate besides Biden or Trump in the response section immediately above
- "Some other candidate" with 2%
- "Someone else" with 3%
- "Someone else" and would not vote with 0%
- Includes "Refused"
- "Some other candidate" with 2%
- Results generated with high Democratic turnout model
- "Some other candidate" with 2%
- Results generated with high Republican turnout model
- "Some other candidate" with 2%
- "Not sure/Someone else/Undecided" with 2%
- "None of these" and "Other" with 0%; would not vote with no voters
- "Someone else" with 1%
- "Other candidate" with 1%; "No one" with 0%
- With a likely voter turnout model featuring high turnout
- With a likely voter turnout model featuring low turnout
- "Someone else" with 1%
- "Some other candidate" and West (B) with 1%; would not vote with 0%
- If only Biden, Trump and "some other candidate" were available
- "Some other candidate" with 3%; would not vote with 0%
- "Someone else" with 2%
- "Refused/would not vote" with 2%; "Another candidate" with 1%
- "Someone else" with 2%
- Not yet released
- "Refused" with 3%
- "Other third party" with 2%
- "Third Party" with 2%
- "Some other candidate" with 1%
- Results generated with high Democratic turnout model
- "Some other candidate" with 1%
- Results generated with high Republican turnout model
- "Some other candidate" with 1%
- "Some other candidate" with 3%
- "Some other candidate" and West (B) with 1%; would not vote with 0%
- If only Biden, Trump and "some other candidate" were available
- "Some other candidate" with 1%; would not vote with 0%
- "Someone else" with 1%
- "Other" and "None of these" with 0%
- "Someone else" with 1%
- "Some other candidate" with 2%; West (B) and would not vote with 0%
- If only Biden, Trump and "some other candidate" were available
- "Some other candidate" with 1%; would not vote with 0%
- "Someone else" with 1%
- "Third party" with 1%
- With voters who lean towards a given candidate
- "Someone else" with 1%
- "One of the other party or independent tickets" with 1%
- "Someone else" with 4%
- Under a +2 Democratic turnout model
- "Someone else" with 4%
- Under a conservative +2 Republican turnout model
- "Someone else" with 4%
- "Someone else" with 2%
- Results generated with high Democratic turnout model
- Results generated with high Republican turnout model
- "Some other candidate" with 1%; would not vote with 0%
- "Another Third Party/Write-in" with 1%
- "Someone else" with 1%
- No voters
- "Refused" with 2%; La Riva (PSOL) with 1%; Blankenship (C), Fuente (A) and "other" with no voters
- With the preferences of La Riva and Jorgensen voters in an election featuring only Biden and Trump
- "Refused" with 2%; "Other" with 0%
- "Someone else" with 1%
- Includes "Refused"
- "Someone else" and would not vote with 0%
- Includes "Refused"
- Includes "Refused"
- "Another Third Party/Write-in" with 1%
- "Third party" with 2%
- "Neither" with 1%; "other" and would not vote with no voters
- "Someone else/third party" with 1%
- "Some other candidate" with 2%; would not vote with 0%
- "Another Third Party/Write-in" with 1%
- "No one" with 1%
- With a likely voter turnout model featuring higher turnout than in the 2016 presidential election
- "Other" with 1%
- With a likely voter turnout model featuring lower turnout than in the 2016 presidential election
- "Other" with 1%
- "Someone else" with 2%; "Refused" and would not vote with 1%
- "Someone else" with 0%
- "Third party" with 2%
- Would not vote with 2%
- Overlapping sample with the previous Morning Consult poll, but more information available regarding sample size
- "Other/not sure" with 4%
- "Another Party Candidate" with 1%
- "Another Third Party/Write-in" with 1%
- "Someone else" with 1%
- "Another Third Party/Write-in" with 1%
- "Refused" with 1%
- Overlapping sample with the previous Morning Consult poll, but more information available regarding sample size
- Not yet released
- "Other" with 1%; "Neither" 1%
- "Another third party/write-in" with 1%
- "Someone else" with 4%; would not vote with 2%
- Not yet released
- "Third-party candidate" with 2%
- "Someone else/third party" with 2%; would not vote with 0%
- Not yet released
- "Other party candidate" with 5%
- Not yet released
- "Other" with 4%; would not vote with 2%
- "Another candidate" and would not vote with 2%
- "Another Third Party/Write-in" with 1%
- Not yet released
- "Libertarian Party candidate/Green Party candidate" with 3%
- Not yet released
- "Other" with 3%; "prefer not to answer" with 1%
- Not yet released
- "Third party candidate" with 3.3%
- "Third party" with 2.7%
- Overlapping sample with the previous Morning Consult poll, but more information available regarding sample size
- Not yet released
- "Libertarian nominee" with 1.2%
- "Green nominee" with 0.4%
- Not yet released
- "Third party/write-in" with 3%
- Includes "Refused"
- Wouldn't vote with 6%
- "Someone else" with 1%
- Overlapping sample with the previous SurveyMonkey/Axios poll, but more information available regarding sample size
- Hawkins (G) and "Other candidate or write-in" with 0%
- With voters who lean towards a given candidate
- "Someone else" with 2%
- "Someone else" with 4%
- "Other candidate" with 1%; "No one" with 0%
- With a likely voter turnout model featuring higher turnout than in the 2016 presidential election
- With a likely voter turnout model featuring lower turnout than in the 2016 presidential election
- "Someone else" with 2%
- "Other third party" with 2%
- "Other" with 2%; Hawkins (G) with 0%
- With voters who lean towards a given candidate
- "Someone else" with 5%
- Hawkins (G) and "Someone else" with 1%; would not vote with 0%
- Includes "Refused"
- With voters who lean towards a given candidate
- "Someone else" with 3%; would not vote with 0%
- Includes "Refused"
- "Someone else" with 1%
- "Some other candidate" with 2%
- Hawkins (G) with 1%
- "Someone else" with 3%
- "Someone else" with 2%
- "Someone else" with 1%
- Hawkins (G) with 1%; "Another Third Party/Write-in" with 0%
- "Someone else" with 2%
- "No one" with 0%; "Other candidate" with no voters
- With a likely voter turnout model featuring higher turnout than in the 2016 presidential election
- With a likely voter turnout model featuring lower turnout than in the 2016 presidential election
- "Someone else" and would not vote with 0%
- Including "Refused"
- Standard VI response
- Hawkins (G) with 0%
- If only Biden and Trump were candidates
- Hawkins (G) with 1%; "Another Third Party/Write-in" with 0%
- Overlapping sample with the previous Morning Consult poll, but more information available regarding sample size
- Would not vote with 1%
- With voters who lean towards a given candidate
- Hawkins (G) and would not vote with 0%
- "Refused" with 2%
- "Some other candidate" with 4%
- "Someone else/third party" with 3%; would not vote with 0%
- "Third party candidate" with 4%; would not vote with 2%
- Includes "refused"
- With a likely voter turnout model featuring higher turnout than in the 2016 presidential election
- With a likely voter turnout model featuring lower turnout than in the 2016 presidential election
- "Another Party candidate"
- "Other" with 3%; "would not vote" with 1%
- "Different candidate" with 8%; would not vote with 2%
- "Someone else" with 3%
- Listed as "other/undecided"
- "Undecided" with 5%; "Did not answer" with 2%
- Wouldn't vote with 1%; don't know/refused with 3%
- Overlapping sample with the previous SurveyMonkey/Axios poll, but more information available regarding sample size
- "Neither" with 4%
- "Neither" with 6%
- Overlapping sample with the previous SurveyMonkey/Axios poll, but more information available regarding sample size
- Overlapping sample with the previous SurveyMonkey/Axios poll, but more information available regarding sample size
- "Someone else" with 1%
- Overlapping sample with the previous SurveyMonkey/Axios poll, but more information available regarding sample size
- Additional data sourced from FiveThirtyEight
- "Someone else" with 2%
- Overlapping sample with the previous SurveyMonkey/Axios poll, but more information available regarding sample size
- "Don't recall" with 2%
- "Someone else" with 3%
- "Other candidate or write-in" with 1%
- With voters who lean towards a given candidate
- "Refused" with 5%; "Someone else" with 3%; would not vote with 0%
- Includes "Do not remember"
- "Someone else" with 1%
- "Someone else" with 2%
- With voters who lean towards a given candidate
- "Someone else" with 4%
- "Someone else" with 2%
- Results generated with high Democratic turnout model
- "Someone else" with 2%
- Results generated with high Republican turnout model
- "Someone else" with 2%
- "Someone else" with 1%; would not vote with 0%
- Includes "Refused"
- No voters
- "Another candidate" and "No one" with 1%
- With a likely voter turnout model featuring higher turnout than in the 2016 presidential election
- With a likely voter turnout model featuring lower turnout than in the 2016 presidential election
- "Other third party" with 2%
- With voters who lean towards a given candidate
- "One of the other candidates" with 2%; West (B) with 1%
- Includes "Refused"
- "Someone else" with 4%
- "Someone else" with 2%
- If the only candidates were Biden and Trump
- "Other candidate" with 2%
- "Another candidate" with 1%; "No one" with no voters
- "Hawkins/Other" with 2%
- "Hawkins/Other" with 2%
- "Someone else" with 1%; Would not vote with 0%
- Includes "Refused"
- "Someone else" with 4%
- Would not vote with 1%
- With voters who lean towards a given candidate
- "Other" and "No-one" with <1%
- With a likely voter turnout model featuring higher turnout than in the 2016 presidential election
- "Other" with <1%
- With a likely voter turnout model featuring lower turnout than in the 2016 presidential election
- "Other" with 0%
- If the only candidates were Biden and Trump
- "Someone else" with 9%; would not vote with 1%
- "Someone else" with 7%
- Other with 2%; would not vote with 3%
- Overlapping sample with the previous SurveyMonkey/Axios poll, but more information available regarding sample size
- Hawkins (G) and "Other candidate/write-in" with 1%
- "Someone else" and would not vote with 1%
- Includes "Refused"
- "Neither of the two candidates" with 11%
- "Someone else" with 4%
- Standard VI response
- Hawkins (G) with 1%
- If only Trump and Biden were candidates
- "Some other candidate" with 5%
- "Someone else" with 6%
- "Someone else" with 3%
- Overlapping sample with the previous SurveyMonkey/Axios poll, but more information available regarding sample size
- Standard VI response
- Hawkins (G) with 1%
- If only Trump and Biden were candidates
- "Someone else" with 1%
- "Someone else" with 3%; would not vote with 1%
- "Someone else" with 2%
- Not yet released
- "someone else" with 5%
- Not yet released
- "Some other candidate" with 6%
- "Someone else" with 5%
- Additional data sourced from FiveThirtyEight
- Overlapping sample with the previous SurveyMonkey/Axios poll, but more information available regarding sample size
- "Another Party Candidate" with 1%
- "Refused" with no voters
- "Another Party Candidate" with 1%
- Did not vote with 1%; "Don't recall" and would not vote with 0%
- Overlapping sample with the previous SurveyMonkey/Axios poll, but more information available regarding sample size
- With voters who lean towards a given candidate
- "Someone else" with 2%
- De La Fuente (A) with 1%
- Reassigning the second and third preferences of non-Biden/Trump voters
- "No second choice"/"no third choice" with 1%
- "One of the minor party candidates" with 4%
- "All other candidates" with 6%
- "Refused" with 2%; De La Fuente (A) with no voters
- Ressigning the second preferences of Hawkins and Jorgensen voters
- "Refused" with 2%; De La Fuente (A), "No second preference" and "Someone else" with 1%; Hawkins (G) with 0%; Jorgensen (L) with no voters
- If the only candidates were Biden and Trump
- "A minor party candidate" with 4%
- "Refused" with 1%; Fuente (A) and "Other" with 0%
- Reassigning the second and third preferences of non-Biden/Trump voters
- "Refused" with 1%; Fuente (A) and Hawkins (G) with 0%; Jorgensen (L) and "Other" with no voters
- Topline after Ranked-Choice Voting is used
- Would not vote with 1%; "someone else" with 0%
- Includes "Refused"
- "Someone else" with 0%
- Would not vote with 1%
- "Someone else" with 8%; "Prefer not to say" and would not vote with 1%
- "Someone else" and would not vote with 3%
- "Some other candidate" with 7%
- If only Biden and Trump were candidates
- "One of the minor party candidates" with 5%
- Overlapping sample with the previous SurveyMonkey/Axios poll, but more information available regarding sample size
- "Someone else" with 3%
- "Refused" with 3%
- "Someone else" with 3%
- "Other" with 1%; would not vote with 0%
- Includes "Refused"
- "Some other candidate" with 5%; "Refused" with 3%; would not vote with no voters
- "Other" with 3%; would not vote with 0%
- "Another candidate" with 2%; "Refused" with 3%
- "Some other candidate" with 7%; would not vote with 3%
- Including voters who lean towards a given candidate
- "Another candidate" with 7%
- Overlapping sample with the previous SurveyMonkey/Axios poll, but more information available regarding sample size
- "Someone else" with 2%
- "Some other candidate" with 2%; West (B) and would not vote with 0%
- If only Biden, Trump and "some other candidate" were available
- "Some other candidate" with 3%; would not vote with 0%
- Results considering those who lean towards a given candidate among those initially predisposed towards abstention, indecision or a candidate besides Biden or Trump in the response section immediately above
- "Some other candidate" with 2%
- With voters who lean towards a given candidate
- "Someone else" with 3%
- "Not sure/Someone else/Undecided" with 8%
- "None of these" with 1%; "Other" with 0%
- "Someone else" with no voters
- Results generated with high Democratic turnout model
- Results generated with high Republican turnout model
- "Third party" with 5%
- Includes "Refused"
- "Someone else" with 1%
- "Other/third party" with 2%
- "Someone else" with 0%
- "Someone else" and would not vote with 0%
- Includes "Refused"
- "Some other candidate" with 2%; West (B) and would not vote with 0%
- If only Biden, Trump and "Some other candidate" were available
- "Some other candidate" with 3%; would not vote with 0%
- "Third party" with 2%
- "Other" and "None of these" with 0%; would not vote with no voters
- Includes Undecided
- "Other" with 2%; would not vote with no voters
- "Some other candidate" with 2%; West (B) and would not vote with 0%
- If only Biden, Trump and "Some other candidate" were available
- "Some other candidate" with 3%; would not vote with 0%
- "Third party candidate" with 5%
- Includes "Refused"
- "Someone else" with 1%
- "Someone else" with 2%
- "Someone else" with 2%
- Results generated with high Democratic turnout model
- Results generated with high Republican turnout model
- "Some other candidate" and West (B) with 1%; would not vote with 0%
- If only Biden, Trump and "Some other candidate" were available
- "Some other candidate" with 3%; would not vote with 0%
- "Third party candidate" with 4%
- Includes "Refused"
- "Someone else" with 4%
- "Someone else" with 1%; would not vote with 0%
- Includes "Refused"
- "Other third party" with 2%
- "Another candidate" with 0%
- With voters who lean towards a given candidate
- "Someone else" with 2%
- "Another Third Party/Write-in" with 1%
- With voters who lean towards a given candidate
- "Some other candidate" with 2%; would not vote with 0%
- "Refused" with 3%; "Third Party" with 2%
- "Someone else" with 1%
- "Another Third Party/Write-in" with 0%
- "Someone else" with 1.2%
- "Another candidate" with 1%
- If only Trump and Biden were candidates
- "Someone else" with 7%; "Refused" with 1%; would not vote with 0%
- "Some other candidate" with 2%; would not vote with 0%
- "Someone else" with 3%
- "Another Third Party/Write-in" with 0%
- "Third party candidate" with 5%
- Includes "Refused"
- Would not vote with 1%
- Overlapping sample with the previous Morning Consult poll, but more information available regarding sample size
- "Other/not sure" with 7%
- With voters who lean towards a given candidate
- "Some other candidate" with 3%
- "Refused" with 3%; "Third party" with 1%
- "Another Third Party/Write-in" with 1%
- With voters who lean towards a given candidate
- Would not vote with 0%
- "Another party candidate" with 1%
- "Another third party/write-in" 1%
- "Someone else" with 3%
- "Other" with 3%; would not vote with 2%
- "Third party" with 6%
- "Someone else/third party" with 2%; would not vote with 0%
- "Another Third Party/Write-In" with 2%
- "Other" with 1%; "Neither" with 4%
- "Other" with 3%; would not vote with 1%
- "Would vote third party" with 5%
- "Refused" with 2%
- "Third party candidate" with 5%
- Would not vote with 5%; "Another candidate" with 3%
- "other" with 2%
- "Refused/no answer" with 4%
- "Libertarian Party candidate/Green Party candidate" with 3%
- "Other" with 4%; "prefer not to answer" with 0%
- "A different candidate" with 6%
- Includes "refused"
- "Third party" with 4%
- "Third party/write-in" with 3%
- "Someone else" with 6%; "Refused" and would not vote with 1%
- "Other" with 4%; would not vote with 2%
- "Someone else" with 2%; would not vote with 4%
- A third party candidate with 5%; would not vote with 3%
- Includes "refused"
- Would not vote with 5%
- Overlapping sample with the previous SurveyMonkey/Axios poll, but more information available regarding sample size
- "Someone else" with 1%
- "Other candidate or write-in" with 1%
- "Someone else" with 2%
- "Not sure/Someone else/Undecided" with 3%
- "Some other candidate" with 5%
- West (B) with 3%; "Someone else" with 1%
- "Someone else" with 3%
- Additional data sourced from FiveThirtyEight
- "Another Third Party Candidate" and West (B) with 1%; would not vote with 0%
- "Some other candidate" with 3%
- "Refused" with 2%; Fuente (A), "Other" and West (B) with 1%; Pierce (I) with 0%; Kennedy (SWP) and La Riva (PSOL) with no voters
- "Another Third Party/Write-in" with 1%
- "Neither" with 1%; "Other" and would not vote with 0%
- Overlapping sample with the previous Morning Consult poll, but more information available regarding sample size
- "Someone else" with 2%
- "Someone else/third party" with 2%
- "Someone else" and would not vote with 0%
- Includes "Refused"
- "Some other candidate" with 4%
- Overlapping sample with the previous Morning Consult poll, but more information available regarding sample size
- "Someone else" with 3%
- "Another Party Candidate" with 1%
- Including voters who lean towards a given candidate
- "Another Party Candidate"
- "Other" with 5%; would not vote with 1%
- Including undecided voters who lean towards Trump
- Including undecided voters who lean towards Biden
- Overlapping sample with the previous SurveyMonkey/Axios poll, but more information available regarding sample size
- "Other candidate or write-in" with 1%
- "Someone else" with 3%
- "Refused" with no voters
- Additional data sourced from FiveThirtyEight
- "Someone else" with 6%
- Overlapping sample with the previous SurveyMonkey/Axios poll, but more information available regarding sample size
- "Someone else" with 5%
- "Another Party Candidate" with 1%
- "Someone else" with 3%
- "Don't recall" with 1%
- Overlapping sample with the previous SurveyMonkey/Axios poll, but more information available regarding sample size
- "Someone else" with 2%; would not vote with 0%
- Includes "Refused"
- Standard VI response
- "Someone else" with 4%
- Results generated with high Democratic turnout model
- "Someone else" with 4%
- Results generated with high Republican turnout model
- "Someone else" with 4%
- "Someone else" with 2%
- Hawkins (G) with 0%
- Hawkins (G) and would not vote with 1%; "someone else" with 0%
- Includes "Refused"
- "Refused" with 0%
- Includes "Refused"
- Including voters who lean towards a given candidate
- "Someone else" with 5%
- Listed as "other/not sure"
- Overlapping sample with the previous SurveyMonkey/Axios poll, but more information available regarding sample size
- "Don't recall" and Would not vote with 0%
- With voters tho lean towards a given candidate
- "Someone else" with 2%
- "Undecided, will vote for another candidate or refused to answer" with 5%
- would not vote with 1%; "someone else" with 0%
- Includes "Refused"
- "Other candidate" with 1%
- Includes "Refused"
- "Other candidate" with 2%
- Includes "Refused"
- "Someone else" with 1%
- Overlapping sample with the previous SurveyMonkey/Axios poll, but more information available regarding sample size
- "Other candidate or write-in" with 2%; Undecided with 0%
- "Someone else" with 4%
- "Someone else" with 1%
- "Someone else" and would not vote with 1%
- Includes "Refused"
- "Someone else" with 3%
- "None of these candidates" with 4%; Blankenship (C) with 1%
- "Other third party" with 2%
- "Someone else" with 1%; would not vote with 0%
- Includes "Refused"
- "Some other candidate" with 2%
- "Another candidate" with 4%; "None of the candidates" with 3%
- "Other" with 2%; would not vote with no voters
- "Other" with 2%; would not vote with 1%
- "Someone else" with 1%; would not vote and Hawkins (G) with 0%
- Includes "Refused"
- "Someone else" with 5%
- Other with 5%; wouldn't vote with 4%
- Other with 5%; wouldn't vote with 4%
- Overlapping sample with the previous SurveyMonkey/Axios poll, but more information available regarding sample size
- "Another candidate" with 1%
- "Another candidate" with 0%
- "Refused" with 2%; "Other" with 1%
- "Someone else" with 4%
- With voters who lean towards a given candidate
- "Someone else" with 2%
- "Another candidate" with 0%
- With voters who lean towards a given candidate
- "Some other candidate" with 1%
- Standard VI response
- Hawkins (G) with 2%; "Another candidate" with 0%
- With only Biden, Trump and "Another candidate" as options
- "Another candidate" with 0%
- "Someone else" and would not vote with 1%
- Includes "Refused"
- "Someone else" with 4%
- "Another candidate" with 4%
- "Another candidate" with 6%
- "Another candidate" with 5%
- "Another candidate" with 8%
- Data sourced from FiveThirtyEight
- Data not yet released
- Data not yet released
- Overlapping sample with the previous SurveyMonkey/Axios poll, but more information available regarding sample size
- "Someone else" with 1%
- "Neither" with 1%; "Someone else" with 0%
- "Another candidate or unsure" with 10%
- "Refused" with 4%; "Someone else" with 1%
- "Another candidate or unsure" with 10%
- With voters who lean towards a given candidate
- "Someone else" with 2%
- "Another candidate or unsure" with 15%
- "For another candidate" with 7%
- "Someone else" with 2%; would not vote with 1%
- "Neither" with 4%; "someone else" with 1%
- Overlapping sample with the previous SurveyMonkey/Axios poll, but more information available regarding sample size
- "Other candidate" with 3%
- "other" with 2%
- Overlapping sample with the previous SurveyMonkey/Axios poll, but more information available regarding sample size
- "Someone else" with 2%
- Pierce (I) with 2%, "someone else" and would not vote with 0%
- "Someone else" with 3%; would not vote with 2%
- Overlapping sample with the previous SurveyMonkey/Axios poll, but more information available regarding sample size
- "Some other candidate" and West (B) with 1%; would not vote with 0%
- If only Biden, Trump and "some other candidate" were available
- "Some other candidate" with 3%; would not vote with 0%
- Results considering those who lean towards a given candidate among those initially predisposed towards abstention, indecision or a candidate besides Biden or Trump in the response section immediately above
- "Some other candidate" with 2%
- "Other candidate or write-in" with 0%
- With voters who lean towards a given candidate
- "Someone else" with 6%
- "None of these" with 1%; "Other" with 0%
- "Some other candidate" with 2%
- "Someone else" with 1%
- With voters who lean towards a given candidate
- "Some other candidate" with 2%; did/would not vote and "Refused" with 0%
- No voters
- Blankenship (C) with 2%
- "Someone else" and would not vote with 0%
- Includes "Refused"
- "Some other candidate" with 1%; West (B) and would not vote with 0%
- If only Biden, Trump and "Some other candidate" were available
- "Some other candidate" with 2%; would not vote with 0%
- "Another candidate" with 3%
- Results generated with high Democratic turnout model
- "Another candidate" with 3%
- Results generated with high Republican turnout model
- "Another candidate" with 3%
- "Some other candidate" with 2%
- "Another candidate" with 1%
- Blankenship (C) with no voters
- "Other third party" with 2%
- "Someone else" with 0.6%; Blankenship (C) with 0.2%
- "Some other candidate" with 2%
- "Some other candidate" with 1%; West (B) and would not vote with 0%
- If only Biden, Trump and "Some other candidate" were available
- "Some other candidate" with 2%; would not vote with 0%
- Blankenship (C) with 0%
- With voters who lean towards a given candidate
- "Some other candidate" with 1%; did/would not vote and "Refused" with 0%
- No voters
- "Other", "None of these" and would not vote with 0%
- If only Biden and Trump were candidates
- "Other", "None of these" and would not vote with 0%
- With voters who lean towards a given candidate
- "Someone else" with 2%
- "Someone else" with 2%
- "Someone else" with 1%; would not vote with 0%
- Includes "Refused"
- "Some other candidate" with 1%; West (B) and would not vote with 0%
- If only Biden, Trump and "Some other candidate" were available
- "Some other candidate" with 3%; would not vote with 0%
- Blankenship (C), "No one" and "Other candidate" with no voters
- With a likely voter turnout model featuring high turnout
- With a likely voter turnout model featuring low turnout
- "Some other candidate" with 2%
- "Refused" with 1%; "Other" with 0%
- Results generated with high Democratic turnout model
- Results generated with high Republican turnout model
- "Another Third Party/Write-in" with 0%
- "Some other candidate" with 2%; would not vote with 0%
- "Some other candidate" with 2%; would not vote with no voters
- "Another Third Party/Write-in" with 1%
- "Someone else/third party" with 2%
- "Another candidate" with 0%
- With only Biden, Trump and "another candidate" as options
- "Another candidate" with 2%
- Blankenship (C) with 1%
- Blankenship (C) with 0%
- With voters who lean towards a given candidate
- "Someone else" and would not vote with 0%
- Includes "Refused"
- "Some other candidate" with 3%; would not vote with 0%
- "Another Third Party/Write-in" with 0%
- "Refused" with 1.4%; "Other" with 0.4%; Blankenship (C) with no voters
- "Some other candidate" with 2%
- "None of these" and "Other" with 0%; Blankenship (C) with no voters
- "Someone else" with 3%; would not vote with 1%; "refused" with 0%
- "Someone else" with 1%; Blankenship (C) with 0.5%
- With voters who lean towards a given candidate
- "Some other candidate" with 3%
- Would not vote with 1%
- Overlapping sample with the previous Morning Consult poll, but more information available regarding sample size
- "Other/not sure" with 4%
- "Another Third Party/Write-in" with 1%
- "No one" with 1%; Blankenship and "Other candidate" with <1%
- With a likely voter turnout model featuring higher turnout than in the 2016 presidential election
- With a likely voter turnout model featuring lower turnout than in the 2016 presidential election
- Blankenship (C) and "Other" with 0%
- Blankenship (C) and would not vote with 1%; "Other" with 0%
- "Some other candidate" with 2%
- "Someone else" with 1%
- "Another third party/write-in" with 1%
- "Other candidate" with 3%
- Including voters who lean towards a given candidate
- Blankenship (C) with 1%
- "Someone else/third party" with 2%; would not vote with 0%
- "Third party candidate" with 3%; would not vote with 1%
- Includes "refused"
- "Some other candidate" with 7%
- "Other" with 3%; would not vote with 2%
- "Another candidate" with 3%; would not vote with 1%
- "Third party/write-in" with 3%
- "Other candidate" with 7%
- "Someone else" with 4%
- "Someone else" with 5%
- The poll does not have a separate listing for this entry, which is instead added into the 'Other' grouping.
- Refused/no answer with 0.2%
- Overlapping sample with the previous SurveyMonkey/Axios poll, but more information available regarding sample size
- "Other candidate" with 4%
- "Other candidate" with 3%
- Overlapping sample with the previous SurveyMonkey/Axios poll, but more information available regarding sample size
- "Some other candidate" with 3%
- "Someone else" with 2%
- "Someone else" with 1%
- "Someone else" with 2%
- With voters who lean towards a given candidate
- "Someone else" with 2%
- "Someone else" with 1%
- "Other" with 1%; would not vote with no voters
- "Some other candidate" with 2%
- "Someone else" with 2%
- "Someone else" with 2%
- "Another candidate" with 1%
- "Someone else" and would not vote with 0%
- Includes "Refused"
- "Someone else" with 1%
- "Someone else/third party" with 1%
- "Other" and would not vote with no voters
- "Other" with 0%; would not vote with no voters
- "Other" and would not vote with 1%
- "Another candidate" with 1%
- Additional data sourced from FiveThirtyEight
- "Someone else" with 5%
- Overlapping sample with the previous Morning Consult poll, but more information available regarding sample size
- "Other" and would not vote with 1%
- With voters who lean towards a given candidate
- "Some other candidate" with 3%
- "Someone else" with 4%
- "Other and Undecided" with 8%
- "Someone else/third party" with 2%; would not vote with 0%
- "Some other candidate" with 2%
- "Other candidates" with 6%
- "Someone else" with 3%; would not vote with 1%
- "Other" with 4%; would not vote with 2%
- Including voters who lean towards a given candidate
- The poll below displays the results for voters who are sure how they will vote. This one incorporates the preferences of those who lean towards one of two candidates.
- Overlapping sample with the previous SurveyMonkey/Axios poll, but more information available regarding sample size
- West (B) with 1%; Pierce (I) and Simmons (I) with 0%
- Pierce (I), Simmons (I), West (B) and "refused" with 1%
- West (B) with 1%; Pierce (I) and Simmons (I) with 0%
- Would not vote with 2%
- "Other candidate" with 5%
- "Neither" with 3%; "refused" with 1%
- Overlapping sample with the previous SurveyMonkey/Axios poll, but more information available regarding sample size
- "Someone else" with 3%
- "Someone else" with 6%
- With voters who lean towards a given candidate
- Would not vote with 0%
- Overlapping sample with the previous SurveyMonkey/Axios poll, but more information available regarding sample size
- With voters who lean towards a given candidate
- "Some other candidate" with 1%
- "Someone else" with 2%
- "Other candidate" and "No one" with 0%
- With a likely voter turnout model featuring high turnout
- With a likely voter turnout model featuring low turnout
- "Other candidate or write-in" with 0%
- West (B) with 2%; "Some other candidate" and would not vote with 0%
- If only Biden, Trump and "some other candidate" were available
- "Some other candidate" with 3%; would not vote with 0%
- Results considering those who lean towards a given candidate among those initially predisposed towards abstention, indecision or a candidate besides Biden or Trump in the response section immediately above
- "Some other candidate" with 2%
- "Someone else" with 1%
- "Someone else" and would not vote with 0%
- Includes "Refused"
- With voters who lean towards a given candidate
- "Someone else" with 2%
- "Not sure/Someone else/Undecided" with 2%
- "None of these" and "Other" with 0%; would not vote with no voters
- "Neither/other" with 4%
- Results generated with high Democratic turnout model
- Results generated with high Republican turnout model
- "Someone else" with 1%
- "Someone else" with 2%
- "Some other candidate" with 1%; West (B) and would not vote with 0%
- If only Biden, Trump and "some other candidate" were available
- "Some other candidate" with 3%; would not vote with 0%
- "Someone else" with 1%
- "Refused" with 1%; "Some other candidate" with 0%
- "Someone else" with 3%
- Includes Undecided
- "Other" with 1%; "None of these" with 0%
- "Neither/other" with 2%
- "Other" with 1%; would not vote with no voters
- "Some other candidate" with 2%
- "Someone else" with 1%
- "Refused" with 3%; "Others" with 1%
- "Some other candidate" with 2%; West (B) with 1%; would not vote with 0%
- If only Biden, Trump and "some other candidate" were available
- "Some other candidate" with 3%; would not vote with 0%
- "Someone else" with 2%
- "Someone else" with 3%
- Results generated with high Democratic turnout model
- Results generated with high Republican turnout model
- "Someone else" with 2%
- "Some other candidate" and would not vote with 1%; West (B) with 0%
- If only Biden, Trump and "some other candidate" were available
- "Some other candidate" with 1%; would not vote with 0%
- "Someone else" with 1%
- "Another candidate" with 0%
- "Another Third Party/Write-in" with 1%
- With voters who lean towards a given candidate
- "Someone else" with 2%
- "Someone else" with 1%
- "Some other candidate" with 2%; would not vote with 0%
- "Other candidate" and "No one" with 0%
- With a likely voter turnout model featuring high turnout
- With a likely voter turnout model featuring low turnout
- "Someone else/third party" with 2%
- "Someone else" and would not vote with 0%
- Includes "Refused"
- "Neither" and "Other" with 0%; would not vote with no voters
- "Someone else" and would not vote with 0%
- Includes "Refused"
- "Other" with 1%; "Prefer not to answer" with 0%
- "Another Third Party/Write-in" with 1%
- "Other" with 1%; would not vote with no voters
- "Other" and would not vote with 1%
- "Another candidate" with 1%
- "Someone else" with 2%
- "Third party candidate" with 1%
- "Someone else" with 2%
- "Some other candidate" with 2%; would not vote with 0%
- "Someone else" with 1%
- "Another Third Party/Write-in" with 0%
- "Neither candidate or other candidate" with 3%
- Would not vote with 1%
- Overlapping sample with the previous Morning Consult poll, but more information available regarding sample size
- "Other/not sure" with 4%
- "Other" and "Refused" with 3%
- "Another Third Party/Write-in" with 1%
- "Someone else" with 1%
- "No one" with 1%; "Other candidate" with no voters
- With a likely voter turnout model featuring higher turnout than in the 2016 presidential election
- With a likely voter turnout model featuring lower turnout than in the 2016 presidential election
- Additional data sourced from FiveThirtyEight; with voters who lean towards a given candidate
- "Some other candidate" with 4%
- With voters who lean towards a given candidate
- "Some other candidate" with 3%
- If only Biden and Trump were candidates
- "Another Third Party/Write-in" with 1%
- "Someone else" with 3%
- "Neither/other" with 3%
- Including voters who lean towards a given candidate
- "Someone else/third party" with 3%
- "Other" with 2%; would not vote with 0%
- "Some other candidate" with 2%
- West (B) and "Another Third Party/Write-In" with 1%
- "Other" with 4%; would not vote with 1%
- "Some other candidate" with 2%
- "Another candidate" with 3%; "No one" with 0%
- With a likely voter turnout model featuring higher turnout than in the 2016 presidential election
- With a likely voter turnout model featuring lower turnout than in the 2016 presidential election
- "Other party candidate" with 6%
- "other" with 1%
- "Another candidate" with 2%; would not vote with 1%
- "Libertarian Party candidate/Green Party candidate" with 3%
- "Third party/write-in" with 2%
- "Other" with 2%; would not vote with 3%
- "Someone else" with 1%; would not vote with 5%
- A third party candidate with 6%; will not vote with 2%
- Includes "refused"
- Overlapping sample with the previous SurveyMonkey/Axios poll, but more information available regarding sample size
- "Refused" and "Third party candidate" with 1%
- Overlapping sample with the previous SurveyMonkey/Axios poll, but more information available regarding sample size
- "Other candidate/write-in" with 0%
- "Refused" with 2%; "Some other candidate" with 1%; Did/would not vote with 0%
- would not vote with 1%; "Someone else" with 0%
- Includes "Refused"
- Standard VI response
- If the only candidates were Biden and Trump
- "Someone else" with 1%
- "Someone else/third party" with 2%
- Overlapping sample with the previous Morning Consult poll, but more information available regarding sample size
- "Someone else" with 0%
- "Someone else" and would not vote with 2%
- Overlapping sample with the previous Morning Consult poll, but more information available regarding sample size and topline numbers
- "Someone else" with 3%
- "Someone else" with 5%
- Generic
- Generic
- Overlapping sample with the previous SurveyMonkey/Axios poll, but more information available regarding sample size
- Overlapping sample with the previous SurveyMonkey/Axios poll, but more information available regarding sample size
- "Someone else" and would not vote with 2%; "refused" with 1%
- Overlapping sample with the previous SurveyMonkey/Axios poll, but more information available regarding sample size
- "Other candidate or write-in" with 0%
- With voters who lean towards a given candidate
- "Someone else" with 2%
- Standard VI response
- "Someone else" with 2%
- Results generated with high Democratic turnout model
- "Someone else" with 2%
- Results generated with high Republican turnout model
- "Someone else" with 2%
- "Another candidate" with no voters
- "Someone else" and would not vote with 1%
- Includes "Refused"
- "Someone else" with 3%
- With voters who lean towards a given candidate
- "Someone else" with 1%
- With voters who lean towards a given candidate
- "Someone else" with 2%
- "Someone else" with 1%
- Standard IV response
- "Another candidate" with 1%
- With only Biden, Trump and "another candidate" as options
- "Another candidate" with 2%
- "Someone else" and would not vote with 0%
- Includes "Refused"
- "Someone else/third party" with 2%
- Overlapping sample with the previous Morning Consult poll, but more information available regarding sample size
- With voters who lean towards a given candidate
- Overlapping sample with the previous Morning Consult poll, but more information available regarding sample size
- "Refused" with 0%
- Overlapping sample with the previous and subsequent Morning Consult polls, but more information available regarding sample size
- "Another party candidate" with 2%
- Overlapping sample with the previous Morning Consult poll, but more information available regarding sample size
- "Someone else" with 2%
- Overlapping sample with the previous and subsequent Morning Consult polls, but more information available regarding sample size
- Not yet released
- "Someone else" with 4%; would not vote with 3%
- Not yet released
- "Someone else/third party" with 4%; would not vote with 0%
- Not yet released
- Not yet released
- "Other" with 4%; would not vote with 1%
- Not yet released
- Not yet released
- "Someone else" and would not vote with 3%
- Overlapping sample with the previous Morning Consult poll, but more information available regarding sample size
- Not yet released
- Not yet released
- Including voters who lean towards a given candidate
- Other with 1%; neither with 2%
- "Neither-other" with 10%
- Would not vote with 3%
- Other with 0%; neither with 2%
- "Someone else" with 9%
- Including voters who lean towards a given candidate
- Overlapping sample with the previous SurveyMonkey/Axios poll, but more information available regarding sample size
- "Someone else" with 5%
- "Third party candidate" with 8%; "other" with 1%
- Other with 5%; would not vote with 3%
- Other with 9%; would not vote with 4%
- "A third-party candidate" with 10%; other with 4%
- Overlapping sample with the previous SurveyMonkey/Axios poll, but more information available regarding sample size
- "Someone else" with 6%"; "None of the above" with 2%
- Overlapping sample with the previous SurveyMonkey/Axios poll, but more information available regarding sample size
- "Other candidate or write-in" with 1%
- "Someone else" with 2%
- "Third party candidate" with 2%
- Includes "Refused"
- "Other", "None of these" and would not vote with 0%
- "Someone else" with 3%
- With voters who lean towards a given candidate
- "Another candidate" with 2%
- "Third party candidate" with 1%
- Includes "Refused"
- "Some other candidate" with 3%
- Additional data sourced from FiveThirtyEight
- Includes "refused"
- Overlapping sample with the previous SurveyMonkey/Axios poll, but more information available regarding sample size
- "Another candidate" with 5%
- Includes "Refused"
- "Another candidate" with 6%
- "A candidate from another party" with 5%
- Overlapping sample with the previous SurveyMonkey/Axios poll, but more information available regarding sample size
- Additional data sourced from FiveThirtyEight
- Overlapping sample with the previous SurveyMonkey/Axios poll, but more information available regarding sample size
- "Someone else" with 1%
- "Someone else" with 1%
- "Some other candidate" with 2%; West (B) and would not vote with 0%
- If only Biden, Trump and "some other candidate" were available
- "Some other candidate" with 2%; would not vote with 0%
- Results considering those who lean towards a given candidate among those initially predisposed towards abstention, indecision or a candidate besides Biden or Trump in the response section immediately above
- "Some other candidate" with 2%
- "Other" and "Refused/would not vote" with 1%
- With voters who lean towards a given candidate
- "Someone else" with 2%
- "None of these" and "Other" with 0%
- "Someone else" with 1%; would not vote with 0%
- Includes "Refused"
- "Some other candidate" with 1%; West (B) and would not vote with 0%
- If only Biden, Trump and "some other candidate" were available
- "Some other candidate" with 2%; would not vote with 0%
- "Someone else" with 1%
- "Refused" with 6%; "None/other" with 1%; Did not vote with 0%
- "None of these" with 1%; "Other" with 0%; would not vote with no voters
- Includes Undecided
- "Other" with 1%; would not vote with no voters
- "Some other candidate" with 3%
- Results generated with high Democratic turnout model
- "Some other candidate" with 3%
- Results generated with high Republican turnout model
- "Some other candidate" with 3%
- "Refused" with 2%; "Other" with 1%
- "Some other candidate" with 2%; West (B) with 1%; would not vote with 0%
- If only Biden, Trump and "some other candidate" were available
- "Some other candidate" with 3%; would not vote with 0%
- "Someone else/third party" with 3%
- "Someone else" with 2%
- "Someone else" with 2%
- "Someone else" and would not vote with 0%
- Includes "Refused"
- "Some other candidate" with 1%; West (B) and would not vote with 0%
- If only Biden, Trump and "some other candidate" were available
- "Some other candidate" with 3%; would not vote with 0%
- "Another candidate" with 1%
- "Another Third Party/Write-in" with 1%
- "Some other candidate" with 2%; would not vote with 0%
- "None/other" with 2% and "refused" with 5%
- "None/other" and "refused" with 1%
- "Another Party Candidate" with 2%
- "Another Third Party/Write-in" with 0%
- "Another Party Candidate" with 2%
- "Another candidate" with 1%
- "Another Third Party/Write-in" with 1%
- "Some other candidate" with 2%; would not vote with 0%
- Overlapping sample with the previous Morning Consult poll, but more information available regarding sampling period
- "Someone else" with 2%
- "None of these" with 1%; "Other" with 0%
- "Neither" with 1%; "Other" and would not vote with 0%
- "Someone else" and would not vote with 1%
- Includes "Refused"
- With voters who lean towards a given candidate
- "Someone else" with 4%
- Would not vote with 1%
- "Other/not sure" with 6%
- "Someone else/third party" with 2%
- "Another Third Party/Write-in" with 0%
- "Refused" with 2%; "None/other" with 0%
- "Someone else" with 3%
- "Other" with 1%
- "Other" and would not vote with 1%
- "Another Party Candidate"
- "Another Third Party/Write-in" and West (B) with 1%
- "Someone else" with 2%
- Overlapping sample with the previous Morning Consult poll, but more information available regarding third party and undecided voters
- "Someone else" with 2%
- "Neither" with 2%; "refused" with 1%
- "Someone else/third party" with 3%
- "Other" with 3%; would not vote with 1%
- West (B) with 2%; "Another Third Party/Write-In" 1%
- "Other candidate" with 2%
- Includes "refused"
- "Other party candidate" with 8%
- "Other" with 2%
- "Neither" with 2%; "refused" with 1%
- "Another candidate" with 3%; would not vote with 2%
- "Libertarian Party candidate/Green Party candidate" with 5%
- "Other" with 4%; would not vote with 2%
- "Third party/write-in" with 3%
- "Neither" with 3%; "Refused" with 1%
- "Neither" with 3%; "refused" with 1%
- "Other" with 5%; would not vote with 1%
- "Neither" with 4%; "Refused" with 0%
- "Someone else" with 1%; would not vote with 3%
- "Neither" with 3%; "Refused" with 1%
- Other with 6%; wouldn't vote with 2%
- Neither with 1%; refused with 1%
- A third party candidate with 6%; would not vote with 2%
- Includes "refused"
- Neither with 4%; refused with 1%
- Neither with 3%; refused with 0%
- "Neither" with 2%; "refused" with 1%
- Overlapping sample with the previous SurveyMonkey/Axios poll, but more information available regarding sample size
- Partisan clients
- Poll sponsored by Tommy Tuberville's campaign.
- The Consumer Energy Alliance is a pro-Keystone XL lobbying group
- Poll sponsored by Doug Jones' campaign
- Poll sponsored by Protect Our Care, a pro-Affordable Care Act organisation
- The Independent Alaska PAC supported Al Gross's campaign for the US Senate race in Alaska prior to this poll's sampling period
- AFSCME endorsed Biden prior to this poll's sampling period
- The Justice Collaborative Project is an affiliate of the Tides Centre, a liberal fiscal sponsorship provider
- The Center for American Greatness is a pro-Trump organization
- This poll's sponsor exclusively supports Democratic candidates
- The American Action Forum is a 501 organisation which usually supports Republican candidates
- Smart and Safe Arizona endorsed Proposition 207 prior to this poll's sampling period
- Poll sponsored by the Defend Students Action Fund.
- The Human Rights Campaign endorsed Biden prior to this poll's sampling period
- Heritage Action is the sister organisation of the Heritage Foundation, which exclusively endorses Republican candidates
- This poll's sponsor is the American Principles Project, a 501(c)(4) organization that supports the Republican Party.
- Poll sponsored by the McSally campaign
- Poll sponsored by a pro-Affordable Care Act organisation
- Compete Everywhere primarily supports Democratic candidates
- Climate Power 2020 was created by the League of Conservation Voters, which endorsed Biden prior to the sampling period
- Poll sponsored by the Defend Students Action Fund.
- The Human Rights Campaign endorsed Biden prior to this poll's sampling period
- The Consumer Energy Alliance is a pro-Keystone XL lobbying group
- Heritage Action is the sister organisation of the Heritage Foundation, which exclusively endorses Republican candidates
- Poll sponsored by the Florida Chamber of Commerce PAC
- Poll sponsored by Ossoff's campaign
- The Human Rights Campaign endorsed Biden prior to this poll's sampling period
- Poll sponsored by Democrat Raphael Warnock's campaign for U.S. Senate
- Matt Lieberman is a Democratic candidate in Georgia's 2020 special Senate election
- Fair Fight Action is the non-profit arm of Fair Fight, founded by Stacey Abrams who endorsed Biden prior to this poll's sampling period
- This poll’s sponsor, DFER, primarily supports Democratic candidates
- This poll's sponsor is the American Principles Project, a 501(c)(4) organization that supports the Republican Party.
- Poll sponsored by Ossoff's campaign
- This poll is sponsored by End Citizens United, a PAC which has endorsed Democratic candidates who are against the landmark Citizens United court ruling
- This poll was sponsored by a Republican-supporting organisation
- Poll conducted for the Speaker of Georgia's House Republican caucus
- Poll sponsored by Doug Collins' campaign
- This poll is sponsored by Karen Tallian's campaign (D)
- The Human Rights Campaign endorsed Biden prior to this poll's sampling period
- This poll's sponsor is the American Principles Project, a 501(c)(4) organization that supports the Republican Party.
- Emily's List is an organisation that supports Democratic female candidates
- Protect Our Care is a pro-Affordable Care Act organisation
- Keep Kansas Great PAC endorsed Marshall prior to this poll's sampling period
- Poll for EMILY's List, a Democratic PAC which seeks to elect pro-choice Democratic women to office
- This poll's sponsor supported the electoral defeat of Mitch McConnell prior to the sampling period
- This poll's sponsor is the American Principles Project, a 501(c)(4) organization that supports the Republican Party.
- Poll sponsored by Amy McGrath's campaign
- U.S. Term Limits is a PAC supporting candidates who support term limits in Congress.
- This poll's sponsor supported the electoral defeat of Mitch McConnell prior to the sampling period
- Poll sponsored by Adrians Perkins' campaign in the 2020 United States Senate election in Louisiana
- Progress Michigan is a non-profit that primarily supports Democratic candidates
- The American Bridge PAC exclusively supports Democratic candidates
- The Restoration PAC is a 501 non-profit which supports Donald Trump's 2020 presidential campaign
- Rust Belt Rising is affiliated with the Democratic Party
- The Committee to Protect Medicare is a PAC with a history of buying ads arguing against the reelection of Trump
- The Human Rights Campaign endorsed Biden prior to this poll's sampling period
- Unite the Country PAC has endorsed Biden's presidential campaign
- This poll's sponsor is the American Principles Project, a 501(c)(4) organization that supports the Republican Party.
- Poll sponsored by Giffords, whose head - Gabby Giffords - had endorsed Biden prior to the sampling period
- Protect Our Care is a pro-Affordable Care Act organisation
- Poll sponsored by Progress Michigan, the Michigan branch of Progress Now, a progressive advocacy organisation
- Poll sponsored by Protect Our Care, a pro-Affordable Care Act organisation
- CAP Action is a political advocacy group that exclusively supports Democratic candidates
- Poll sponsored by Lewis' campaign
- Poll sponsored by Giffords, whose founder, Gabby Giffords, had endorsed Biden prior to the sampling period
- Poll sponsored by Espy's campaign
- Poll sponsored by Galloway's campaign
- Uniting Missouri is a PAC supporting Governor Mike Parson (R) in the 2020 Missouri gubernatorial election.
- Protect Our Care is a pro-Affordable Care Act organisation
- The House Majority PAC exclusively supports Democratic candidates
- This poll's sponsor is the American Principles Project, a 501(c)(4) organization that supports the Republican Party.
- Poll sponsored by Bolz's campaign
- The Congressional Progressive Caucus PAC exclusively supports Democratic candidates
- Poll sponsored by the House Majority PAC which exclusively endorses Democratic candidates
- Poll sponsored by Eastman's campaign
- Poll sponsored by the DCCC
- Sponsored by an anonymous partisan group but not the Biden campaign
- Sponsored by an anonymous partisan group
- Poll sponsored by Ben Ray Luján's campaign for the 2020 United States Senate election in New Mexico
- This poll was sponsored by the Majority Institute, a communications firm which supports the Democratic Party
- Compete Everywhere primarily supports Democratic candidates
- Poll sponsored by Protect Our Care, a pro-Affordable Care Act organisation
- Piedmont Rising is a pro-Affordable Care Act organisation
- The Human Rights Campaign endorsed Biden prior to this poll's sampling period
- The founder of this poll's sponsor had endorsed Biden prior to the sampling period
- This poll’s sponsor, DFER, primarily supports Democratic candidates
- This poll's sponsor is the American Principles Project, a 501(c)(4) organization that supports the Republican Party.
- Poll sponsored by Protect Our Care, a pro-Affordable Care Act organisation
- Poll sponsored by the North Carolina Republican Party
- Poll sponsored by Burgum's campaign
- The Human Rights Campaign endorsed Biden prior to this poll's sampling period
- The Progressive Policy Institute endorsed Biden prior to this poll's sampling period
- Progress Ohio exclusively supports Democratic candidates
- Poll sponsored by Broyles' campaign
- Compete Everywhere primarily supports Democratic candidates
- Climate Power 2020 was created by the League of Conservation Voters, which endorsed Biden prior to the sampling period
- The American Bridge PAC exclusively supports Democratic candidates
- The Human Rights Campaign endorsed Biden prior to this poll's sampling period
- CPEC campaigns exclusively for Democratic candidates
- The Progressive Policy Institute endorsed Biden prior to this poll's sampling period
- Unite the Country PAC endorsed Biden prior to this poll's sampling period
- The League of Conservation Voters and the Sierra Club endorsed Biden prior to this poll's sampling period
- Heritage Action is the sister organisation of the Heritage Foundation, which exclusively endorses Republican candidates
- This poll's sponsor is the American Principles Project, a 501(c)(4) organization that supports the Republican Party.
- Poll sponsored by Protect Our Care, a pro-Affordable Care Act organisation
- The DSCC endorsed Jaime Harrison's campaign for the 2020 US Senate election in South Carolina before this poll's sampling period
- This poll's sponsor, Lindsey Must Go, is a PAC opposing Lindsey Graham
- This poll was sponsored by Harrison's campaign
- Poll sponsored by the Texas arm of the party which nominated Biden prior to this poll's sampling period
- The Blue Texas PAC exclusively supports Democratic candidates
- The Human Rights Campaign endorsed Biden prior to this poll's sampling period
- Poll sponsored by the Texas arm of the party which nominated Biden prior to this poll's sampling period
- Poll sponsored by the Defend Students Action Fund.
- Giffords' founder, Gabby Giffords, endorsed Biden prior to this poll's sampling period
- The Texas Democratic Party exclusively supports Democratic candidates
- Poll sponsored by Chrysta Castañeda's campaign
- Size of "extremely likely to vote" sample not yet released
- This poll's sponsor is the American Principles Project, a 501(c)(4) organization that supports the Republican Party.
- Poll sponsored by Progress Texas, an organisation promoting progressive policies
- Poll sponsored by the Texas Democratic Party
- By the time of this poll, Data for Progress, which has worked with both the Sanders and Warren campaigns, had endorsed Warren
- Poll sponsored by Democracy Toolbox
- Poll sponsored by Milne's campaign in the 2020 Vermont lieutenant gubernatorial election
- Poll conducted by Daniel Gade's campaign
- The Club for Growth is a PAC supporting the Donald Trump 2020 presidential campaign
- This poll’s sponsor, DFER, primarily supports Democratic candidates
- The Human Rights Campaign endorsed Biden prior to this poll's sampling period
- Heritage Action is the sister organisation of the Heritage Foundation, which exclusively endorses Republican candidates
- This poll's sponsor is the American Principles Project, a 501(c)(4) organization that supports the Republican Party.
- Poll sponsored by Protect Our Care, a pro-Affordable Care Act organisation
- CAP Action is a political advocacy group that exclusively supports Democratic candidates