2020 United States presidential election in Nevada
The 2020 United States presidential election in Nevada was held on Tuesday, November 3, 2020, as part of the 2020 United States elections in which all 50 states plus the District of Columbia participated.[1] Nevada voters chose electors to represent them in the Electoral College via a popular vote, pitting the Republican Party's nominee, incumbent President Donald Trump, and running mate Vice President Mike Pence against Democratic Party nominee, former Vice President Joe Biden, and his running mate California Senator Kamala Harris. Nevada has six votes in the Electoral College.[2]
| ||||||||||||||||||||||||||
| Turnout | 77.26% | |||||||||||||||||||||||||
|---|---|---|---|---|---|---|---|---|---|---|---|---|---|---|---|---|---|---|---|---|---|---|---|---|---|---|
| ||||||||||||||||||||||||||
 County Results
| ||||||||||||||||||||||||||
| ||||||||||||||||||||||||||
.jpg.webp)
| Elections in Nevada |
|---|
 |
| None of These Candidates |
Throughout the campaign, polls of the state generally showed a Biden lead, albeit with a sometimes slender margin. Prior to polling day, 13 of the 14 news organizations considered that Nevada was leaning towards Biden.
Though Biden carried Nevada by just a barely smaller margin than Hillary Clinton did when she won the state in 2016, winning by a 2.39% margin over Trump compared to Clinton's 2.42% margin. However, Biden carried the state by 33,596 votes, a 6,394 vote increase from Clinton's 27,202 vote margin. Most counties in the state of Nevada are rural, and voted heavily for Trump. However, Biden won the two most populous counties, Clark and Washoe, which make up almost 89% of Nevada's population and thus effectively decided the election. Biden also won Washoe County by a wider margin than Clinton.[3] The state's three largest cities are also located in these counties: Las Vegas and Henderson in the former, and Reno in the latter. His strength in these areas was likely due to high presence of minority and union voters: Biden's strength came from heavy turnout among culinary unions in populous Clark County, anchored by Las Vegas. Biden had the backing of Culinary Union Local 226, based on right-to-work standards.[4] Additionally, Biden was able to win about 43% and 34% of votes in the tourism-heavy Lake Tahoe areas of Carson City and Douglas County respectively, sealing his victory in the state.
Caucuses
Canceled Republican caucuses
On September 7, 2019, the Nevada Republican Party became one of several state GOP parties to officially cancel their respective primaries and caucuses.[5] Donald Trump's re-election campaign and GOP officials have cited the fact that Republicans canceled several state primaries when George H. W. Bush and George W. Bush sought a second term in 1992 and 2004, respectively; and Democrats scrapped some of their primaries when Bill Clinton and Barack Obama were seeking reelection in 1996 and 2012, respectively.[6][7] In August 2019, the Associated Press quoted the state party spokesman, Keith Schipper, who stated it "isn't about any kind of conspiracy theory about protecting the president ... He's going to be the nominee ... This is about protecting resources to make sure that the president wins in Nevada and that Republicans up and down the ballot win in 2020."[8]
In lieu of conducting their caucuses, the state party's governing central committee instead formally held an Alternative Presidential Preference Poll on February 22, 2020,[9] voting by acclamation to officially bind all 25 of its national pledged delegates to Trump.[10][11]
Democratic caucuses
%252C_2020.svg.png.webp)
- Sanders—30–40%
- Sanders—40–50%
- Sanders—60–70%
- Sanders—70–80%
- Buttigieg—<30%
- Buttigieg—30–40%
- Buttigieg—40–50%
%252C_2020.svg.png.webp)
- Sanders—30–40%
- Sanders—40–50%
- Sanders—50–60%
- Sanders—70–80%
- Buttigieg—<30%
- Buttigieg—30–40%
- Buttigieg—40–50%
- Steyer—<30%
%252C_2020.svg.png.webp)
- Sanders—30–40%
- Sanders—40–50%
Bernie Sanders won the Nevada caucuses, with Joe Biden coming in second and Pete Buttigieg in third.[12]
| Candidate | First alignment |
Final alignment[lower-alpha 1] |
County convention delegates[lower-alpha 2] |
Pledged national convention delegates[lower-alpha 3][17] | |||
|---|---|---|---|---|---|---|---|
| Votes | % | Votes | % | Number | % | ||
| Bernie Sanders | 35,652 | 34.0 | 41,075 | 40.5 | 6,788 | 46.8 | 24 |
| Joe Biden | 18,424 | 17.6 | 19,179 | 18.9 | 2,927 | 20.2 | 9 |
| Pete Buttigieg | 16,102 | 15.4 | 17,598 | 17.3 | 2,073 | 14.3 | 3 |
| Elizabeth Warren | 13,438 | 12.8 | 11,703 | 11.5 | 1,406 | 9.7 | |
| Tom Steyer | 9,503 | 9.1 | 4,120 | 4.1 | 682 | 4.7 | |
| Amy Klobuchar | 10,100 | 9.6 | 7,376 | 7.3 | 603 | 4.2 | |
| Tulsi Gabbard | 353 | 0.3 | 32 | 0.0 | 4 | 0.0 | |
| Andrew Yang (withdrawn) | 612 | 0.6 | 49 | 0.0 | 1 | 0.0 | |
| Michael Bennet (withdrawn) | 140 | 0.1 | 36 | 0.0 | 0 | 0.0 | |
| Deval Patrick (withdrawn) | 86 | 0.1 | 8 | 0.0 | 0 | 0.0 | |
| John Delaney (withdrawn) | 1 | 0.0 | 0 | 0.0 | 0 | 0.0 | |
| Uncommitted | 472 | 0.4 | 367 | 0.4 | 7 | 0.0 | |
| Total | 104,883 | 100% | 101,543 | 100% | 14,491 | 100% | 36 |
General election
Predictions
| Source | Ranking | As of |
|---|---|---|
| The Cook Political Report[18] | Lean D | November 3, 2020 |
| Inside Elections[19] | Likely D | November 3, 2020 |
| Sabato's Crystal Ball[20] | Lean D | November 3, 2020 |
| Politico[21] | Lean D | November 3, 2020 |
| RCP[22] | Tossup | November 3, 2020 |
| Niskanen[23] | Safe D | November 3, 2020 |
| CNN[24] | Lean D | November 3, 2020 |
| The Economist[25] | Likely D | November 3, 2020 |
| CBS News[26] | Lean D | November 3, 2020 |
| 270towin[27] | Lean D | November 3, 2020 |
| ABC News[28] | Lean D | November 3, 2020 |
| NPR[29] | Lean D | November 3, 2020 |
| NBC News[30] | Lean D | November 3, 2020 |
| 538[31] | Likely D | November 3, 2020 |
Graphical summary
Aggregate polls
| Source of poll aggregation |
Dates administered |
Dates updated |
Joe Biden Democratic |
Donald Trump Republican |
Other/ Undecided [lower-alpha 4] |
Margin |
|---|---|---|---|---|---|---|
| 270 to Win | October 16–31, 2020 | November 1, 2020 | 49.4% | 44.4% | 6.2% | Biden +5.0 |
| Real Clear Politics | October 6 – 31, 2020 | November 1, 2020 | 48.6% | 45.0% | 6.4% | Biden +3.6 |
| FiveThirtyEight | until October 31, 2020 | November 1, 2020 | 49.4% | 44.5% | 6.1% | Biden +4.9 |
| Average | 49.1% | 44.6% | 6.3% | Biden +4.5 | ||
Polls
| Poll source | Date(s) administered |
Sample size[lower-alpha 5] |
Margin of error |
Donald Trump Republican |
Joe Biden Democratic |
Jo Jorgensen Libertarian |
Other | Undecided |
|---|---|---|---|---|---|---|---|---|
| Trafalgar Group | Oct 31 – Nov 2, 2020 | 1,024 (LV) | ± 2.98% | 49% | 48% | 1% | 1%[lower-alpha 6] | 1% |
| SurveyMonkey/Axios | Oct 20 – Nov 2, 2020 | 2,366 (LV) | ± 3% | 49%[lower-alpha 7] | 49% | - | – | – |
| Data for Progress | Oct 27 – Nov 1, 2020 | 1,442 (LV) | ± 2.6% | 44% | 51% | 3% | 2%[lower-alpha 8] | – |
| Emerson College | Oct 29–31, 2020 | 720 (LV) | ± 3.6% | 47% | 49% | - | 4%[lower-alpha 9] | – |
| Trafalgar Group | Oct 28–29, 2020 | 1,024 (LV) | ± 2.98% | 47% | 49% | 2% | 1%[lower-alpha 10] | 1% |
| Gravis Marketing | Oct 27–28, 2020 | 688 (LV) | ± 3.7% | 44% | 50% | – | – | 6% |
| SurveyMonkey/Axios | Oct 1–28, 2020 | 3,333 (LV) | – | 49% | 50% | - | – | – |
| Siena College/NYT Upshot | Oct 23–26, 2020 | 809 (LV) | ± 3.8% | 43% | 49% | 3% | 2%[lower-alpha 11] | 4%[lower-alpha 12] |
| BUSR/University of Nevada | Oct 16–21, Oct 23, 2020 |
809 (LV) | ± 4% | 41% | 50% | – | – | – |
| Civiqs/Daily Kos | Oct 17–20, 2020 | 712 (LV) | ± 5.3% | 43% | 52% | - | 3%[lower-alpha 13] | 1% |
| WPA Intelligence/Las Vegas Review-Journal/AARP | Oct 7–11, 2020 | 512 (LV) | ± 4.4% | 42% | 44% | 3% | 5%[lower-alpha 14] | 6% |
| YouGov/CBS | Oct 6–9, 2020 | 1,036 (LV) | ± 4.1% | 46% | 52% | - | 2%[lower-alpha 15] | 0% |
| Siena College/NYT Upshot | Oct 2–6, 2020 | 660 (LV) | ± 4.3% | 42% | 48% | 3% | 1%[lower-alpha 16] | 6%[lower-alpha 17] |
| SurveyMonkey/Axios | Sep 1–30, 2020 | 1,239 (LV) | – | 47% | 51% | - | - | 2% |
| Pulse Opinion Research/Rasmussen Reports/American Greatness PAC[upper-alpha 1] | Sep 23–25, 2020 | 750 (LV) | – | 48% | 49% | - | 2%[lower-alpha 18] | 1% |
| Qualtrics/University of Nevada/BUSR | Sep 10–25, 2020 | 641 (LV) | ± 4% | 41% | 46% | - | 7%[lower-alpha 19] | 6% |
| Fox News | Sep 20–23, 2020 | 810 (LV) | ± 3% | 41% | 52% | 3% | 2%[lower-alpha 20] | 2% |
| 911 (RV) | ± 3% | 40% | 50% | 3% | 3%[lower-alpha 21] | 4% | ||
| ALG Research/The Nevada Independent (D)[upper-alpha 2] | Sep 15–21, 2020 | 800 (LV) | ± 3.5% | 43% | 47% | – | – | – |
| Siena College/NYT Upshot | Sep 8–10, 2020 | 462 (LV) | ± 5.3% | 42% | 46% | 3% | 1%[lower-alpha 22] | 7%[lower-alpha 23] |
| SurveyMonkey/Axios | Aug 1–31, 2020 | 998 (LV) | – | 49% | 50% | - | – | 1% |
| Qualtrics/University of Nevada/BUSR | Aug 20–30, 2020 | 682 (LV) | ± 4% | 39% | 44% | – | 5%[lower-alpha 24] | 12% |
| SurveyMonkey/Axios | Jul 1–31, 2020 | 1,021 (LV) | – | 52% | 47% | - | - | 2% |
| SurveyMonkey/Axios | Jun 8–30, 2020 | 609 (LV) | – | 49% | 50% | - | - | 1% |
| ALG Research/The Nevada Independent (D)[upper-alpha 3] | Apr 27–30, 2020 | 763 (LV) | ± 3.6% | 45% | 49% | – | – | – |
| AtlasIntel | Feb 19–21, 2020 | 1,100 (RV) | ± 3.0% | 41% | 44% | – | 15% | – |
| FOX News | Jan 5–8, 2020 | 1,505 (RV) | ± 2.5% | 39% | 47% | – | 9%[lower-alpha 25] | 4% |
| FOX News | Nov 10–13, 2019 | 1,506 (RV) | ± 2.5% | 40% | 47% | – | 9%[lower-alpha 26] | 4% |
| Emerson College | Oct 31 – Nov 2, 2019 | 1,089 (RV) | ± 2.9% | 51% | 49% | – | – | – |
| Gravis Marketing | Aug 14–16, 2019 | 926 (RV) | ± 3.2% | 43% | 49% | – | – | 8% |
| Emerson College | Mar 28–30, 2019 | 719 (RV) | ± 3.6% | 48% | 52% | – | – | – |
Former candidates | |||||||||||||||||||||||||||||||||||||||||||||||||||||||||||||||||||||||||||||||||||||||||||||||||||||||||||||||||||||||||||||||||||||||||||||||||||||||||||||||||||||||||||||||||||||||||||||||||||||||||||||||||
|---|---|---|---|---|---|---|---|---|---|---|---|---|---|---|---|---|---|---|---|---|---|---|---|---|---|---|---|---|---|---|---|---|---|---|---|---|---|---|---|---|---|---|---|---|---|---|---|---|---|---|---|---|---|---|---|---|---|---|---|---|---|---|---|---|---|---|---|---|---|---|---|---|---|---|---|---|---|---|---|---|---|---|---|---|---|---|---|---|---|---|---|---|---|---|---|---|---|---|---|---|---|---|---|---|---|---|---|---|---|---|---|---|---|---|---|---|---|---|---|---|---|---|---|---|---|---|---|---|---|---|---|---|---|---|---|---|---|---|---|---|---|---|---|---|---|---|---|---|---|---|---|---|---|---|---|---|---|---|---|---|---|---|---|---|---|---|---|---|---|---|---|---|---|---|---|---|---|---|---|---|---|---|---|---|---|---|---|---|---|---|---|---|---|---|---|---|---|---|---|---|---|---|---|---|---|---|---|---|---|
|
Hypothetical polling | ||||||||||||||||
|---|---|---|---|---|---|---|---|---|---|---|---|---|---|---|---|---|
|
Results
| Party | Candidate | Votes | % | ±% | |
|---|---|---|---|---|---|
| Democratic | Joe Biden Kamala Harris |
703,486 | 50.06% | +2.14% | |
| Republican | Donald Trump Mike Pence |
669,890 | 47.67% | +2.17% | |
| Libertarian | Jo Jorgensen Spike Cohen |
14,783 | 1.05% | -2.24% | |
| None of these candidates | 14,079 | 1.00% | -1.54% | ||
| Independent American | Don Blankenship William Mohr |
3,138 | 0.22% | n/a | |
| Total votes | 1,405,376 | 100.00% | |||
By county
| Joseph R. Biden
Democratic |
Donald John Trump
Republican |
Various candidates
Various parties |
|||||
|---|---|---|---|---|---|---|---|
| County | % | # | % | # | % | # | Total |
| Carson City | 42.82% | 12,735 | 54.18% | 16,113 | 3.00% | 891 | 29,739 |
| Churchill | 23.67% | 3,051 | 72.71% | 9,372 | 3.62% | 467 | 12,890 |
| Clark | 53.66% | 521,852 | 44.31% | 430,930 | 2.03% | 19,728 | 972,510 |
| Douglas | 33.91% | 11,571 | 63.38% | 21,630 | 2.71% | 924 | 34,125 |
| Elko | 20.74% | 4,557 | 76.21% | 16,741 | 3.05% | 669 | 21,967 |
| Esmeralda | 15.20% | 74 | 82.14% | 400 | 2.67% | 13 | 487 |
| Eureka | 10.32% | 105 | 88.00% | 895 | 1.67% | 17 | 1,017 |
| Humboldt | 21.73% | 1,689 | 75.63% | 5,877 | 2.64% | 205 | 7,771 |
| Lander | 17.94% | 496 | 79.49% | 2,198 | 2.57% | 71 | 2,765 |
| Lincoln | 13.49% | 330 | 84.51% | 2,067 | 2.00% | 49 | 2,446 |
| Lyon | 28.02% | 8,473 | 69.16% | 20,914 | 2.81% | 851 | 30,238 |
| Mineral | 35.50% | 829 | 60.94% | 1,423 | 3.55% | 83 | 2,335 |
| Nye | 28.72% | 7,288 | 69.07% | 17,528 | 6.01% | 562 | 25,378 |
| Pershing | 23.58% | 547 | 74.61% | 1,731 | 1.81% | 42 | 2,320 |
| Storey | 31.35% | 902 | 66.32% | 1,908 | 2.33% | 67 | 2,877 |
| Washoe | 50.82% | 128,128 | 46.31% | 116,760 | 2.88% | 7,254 | 252,142 |
| White Pine | 19.66% | 859 | 77.89% | 3,403 | 2.45% | 107 | 4,369 |
By congressional district
| District | Trump | Biden | Representative |
|---|---|---|---|
| 1st | 36% | 62% | Dina Titus |
| 2nd | 54% | 44% | Mark Amodei |
| 3rd | 48.9% | 49.1% | Susie Lee |
| 4th | 47% | 51% | Steven Horsford |
Edison exit polling
| 2020 presidential election in Nevada by demographic subgroup (Edison exit polling)[34] | |||
|---|---|---|---|
| Demographic subgroup | Biden | Trump | % of total vote |
| Total vote | 50 | 48 | 98 |
| Ideology | |||
| Liberals | 89 | 9 | 26 |
| Moderates | 61 | 37 | 37 |
| Conservatives | 12 | 85 | 38 |
| Party | |||
| Democrats | 95 | 5 | 35 |
| Republicans | 5 | 94 | 35 |
| Independents | 50 | 44 | 30 |
| Gender | |||
| Men | 46 | 51 | 48 |
| Women | 54 | 44 | 52 |
| Race/ethnicity | |||
| White | 43 | 56 | 65 |
| Black | 80 | 18 | 7 |
| Latino | 61 | 35 | 17 |
| Asian | 64 | 35 | 5 |
| Other | 42 | 54 | 5 |
| Age | |||
| 18–24 years old | 69 | 26 | 9 |
| 25–29 years old | 52 | 45 | 5 |
| 30–39 years old | 59 | 39 | 17 |
| 40–49 years old | 49 | 48 | 14 |
| 50–64 years old | 41 | 57 | 24 |
| 65 and older | 46 | 53 | 30 |
| Sexual orientation | |||
| LGBT | 80 | 16 | 7 |
| Heterosexual | 47 | 51 | 93 |
| First time voter | |||
| Yes | 55 | 43 | 10 |
| No | 50 | 48 | 90 |
| Education | |||
| High school or less | 49 | 48 | 19 |
| Some college education | 46 | 52 | 35 |
| Associate's degree | 52 | 46 | 14 |
| Bachelor's degree | 48 | 48 | 20 |
| Postgraduate degree | 60 | 38 | 12 |
| Income | |||
| Under $30,000 | 63 | 35 | 17 |
| $30,000–49,999 | 50 | 44 | 20 |
| $50,000–99,999 | 50 | 49 | 33 |
| $100,000–199,999 | 41 | 57 | 24 |
| Over $200,000 | 52 | 47 | 6 |
| Union households | |||
| Yes | 58 | 39 | 19 |
| No | 48 | 50 | 81 |
| Military service | |||
| Veterans | 29 | 70 | 17 |
| Non-veterans | 54 | 44 | 83 |
| Issue regarded as most important | |||
| Racial inequality | 90 | 8 | 14 |
| Coronavirus | 85 | 12 | 22 |
| Economy | 11 | 87 | 36 |
| Crime and safety | 11 | 88 | 10 |
| Health care | 84 | 14 | 11 |
| Region | |||
| Washoe County | 51 | 47 | 18 |
| Clark County | 54 | 44 | 69 |
| Rest of the state | 30 | 68 | 13 |
| Area type | |||
| Urban | 52 | 46 | 71 |
| Suburban | 58 | 41 | 16 |
| Rural | 30 | 68 | 13 |
| Family's financial situation today | |||
| Better than four years ago | 14 | 84 | 35 |
| Worse than four years ago | 85 | 11 | 25 |
| About the same | 60 | 38 | 39 |
Analysis
Given the outcome of the election in other states, Nevada became a crucial swing state to determine whether Joe Biden or Donald Trump would win the 2020 presidential election. With Biden's win, this would mark the fourth presidential election in a row that Nevada has voted Democratic, although this is the first time since the beginning of the Democratic winning streak in Nevada that the state was more Republican than the nation, the last time being 2004, when incumbent George W. Bush carried the state by 2.6% and won the national popular vote by 2.4%.
The COVID-19 pandemic in particular had a strong effect on Nevada, as the pandemic negatively affected gambling and tourism, which the state's economy relies on. 22% of voters regarded the pandemic as the most important issue of the election, and these voters broke for Biden by 73 points.
Most counties in the state of Nevada are rural, and have voted Republican since 1980. As a whole, the rural counties outside of Las Vegas and Reno made up much of Trump's total. The state's two most populous counties, Clark County and Washoe County, which contain over 89% of the state's population, broke for Biden. Outside of Clark and Reno, Biden's strongest performances would be in the Lake Tahoe areas of Carson City and Douglas County; while these areas are more rural and Republican-leaning, they are also reliant on both the gambling and tourism industries. Biden hit nearly 43% in Carson City, and received 33% of the vote in Douglas County—this totaled to more than 24,000 votes, effectively clinching the state for Biden.
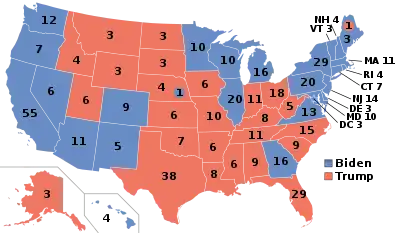
Nevada received facetious attention because of the delay in its finalization of results compared to most other battleground states. 3 days before the state was called, the electoral map showed Biden at 264 electoral votes while having a narrow lead in Nevada, with Trump having a lead in the remaining uncalled swing states. Had the state been called for Biden sooner, its 6 electors would've increased his electoral vote count exactly to the required 270 to win the presidency. The delay in Nevada's results became something of a meme before the state was projected for Biden on November 7.[35]
Latino voters
Latinos were critical to Biden's victory in Nevada, particularly Latinos of Mexican heritage.[36] Latino membership in the Culinary Workers Union was a key driver of Democratic dominance in the state, with over 60,000 (mostly Latino) members who work in the Las Vegas casinos, hotel and service industry and associated tourism.[37]
Aftermath
On November 5, the Nevada Republican Party alleged "at least 3,062 instances of voter fraud". Republican lawyers released a list of over 3,000 people who allegedly did not live in Clark County, Nevada, when they voted. However, these were not proven to be illegal votes, because Nevada (a) allows for people who moved states 30 days before the election to vote in Nevada's election, and (b) allows people studying in colleges in another state to vote in Nevada's election. Additionally, the list featured military members who were overseas and voted by mail.[38]
On November 17, representatives of the Trump campaign asked a judge to nullify Biden's 33,596-vote margin, and simply declare Trump the winner and his electors elected.[39] However, on November 24, the Nevada Supreme Court certified Biden as the winner of the state.[40]
See also
Notes
- Vote count after votes for candidates who did not get at least 15% of the vote in that precinct are reallocated to the voter's second choice.
- County convention delegates (CCDs) are used to calculate how many pledged national convention delegates each candidate win statewide and in the state's four congressional districts.
- The number of pledged national convention delegates is determined by the number of CCDs won, however, a candidate must get at least 15% of the total vote to get any delegates. However, if a candidate wins a congressional district, they get a delegate even if they didn’t reach 15% of the vote. Each precinct has a certain number of CCDs and allocates them based on how many caucus goers there are for each candidate at that precinct.[16]
- Calculated by taking the difference of 100% and all other candidates combined.
- Key:
A – all adults
RV – registered voters
LV – likely voters
V – unclear - "Someone else" with 1%
- Overlapping sample with the previous SurveyMonkey/Axios poll, but more information available regarding sample size
- "Other candidate or write-in" with 2%; Undecided with 0%
- "Someone else" with 4%
- "Someone else" with 1%
- "Someone else" and would not vote with 1%
- Includes "Refused"
- "Someone else" with 3%
- "None of these candidates" with 4%; Blankenship (C) with 1%
- "Other third party" with 2%
- "Someone else" with 1%; would not vote with 0%
- Includes "Refused"
- "Some other candidate" with 2%
- "Another candidate" with 4%; "None of the candidates" with 3%
- "Other" with 2%; would not vote with no voters
- "Other" with 2%; would not vote with 1%
- "Someone else" with 1%; would not vote and Hawkins (G) with 0%
- Includes "Refused"
- "Someone else" with 5%
- Other with 5%; wouldn't vote with 4%
- Other with 5%; wouldn't vote with 4%
- Other with 5%; wouldn't vote with 3%
- Other with 6%; wouldn't vote with 3%
- Other with 6%; wouldn't vote with 4%
- Other with 6%; wouldn't vote with 4%
- Other with 8%; wouldn't vote with 4%
- Other with 5%; wouldn't vote with 4%
- Partisan clients
- The Center for American Greatness is a pro-Trump organization
- Sponsored by an anonymous partisan group but not the Biden campaign
- Sponsored by an anonymous partisan group
References
- Kelly, Ben (August 13, 2018). "US elections key dates: When are the 2018 midterms and the 2020 presidential campaign?". The Independent. Retrieved January 3, 2019.
- "Distribution of Electoral Votes". National Archives and Records Administration. Retrieved January 3, 2019.
- "County Population Totals: 2010-2019". The United States Census Bureau. Retrieved November 15, 2020.
- "Unions, progressives push for Latino Biden votes". Culinary Union Local 226. Retrieved November 9, 2020.
- Kinnard, Meg (September 7, 2019). "Nevada, SC, Kansas GOP drop presidential nomination votes". AP NEWS.
- Karni, Annie (September 6, 2019). "GOP plans to drop presidential primaries in 4 states to impede Trump challengers". Boston Globe. MSN. Retrieved September 7, 2019.
- Steakin, Will; Karson, Kendall (September 6, 2019). "GOP considers canceling at least 3 GOP primaries and caucuses, Trump challengers outraged". ABC News. Retrieved September 7, 2019.
- Price, Michelle (August 2, 2019). "Nevada GOP could let Trump bypass its nominating caucuses". Associated Press.
- Michelle Price (December 13, 2019). "Nevada GOP to vote Feb. 22 on endorsing Trump for president". Associated Press. Retrieved December 23, 2019.
- "Nevada GOP awards all 25 delegates to Trump". Associated Press. PBS Newshour. February 22, 2020.
- "The Nevada GOP Binds its Delegates to President Trump". Nevada Republican Party. February 22, 2020.
- "Nevada Caucus Results 2020". Politico. February 23, 2020. Retrieved February 23, 2020.
- https://nevadacaucusresults.com/
- "Nevada". CNN. February 22, 2020. Retrieved February 23, 2020.
- "Nevada Caucus 2020: Live Results Updates". The New York Times. February 22, 2020. Retrieved February 22, 2020.
- "Nevada Democratic Delegation 2020". The Green Papers. March 31, 2019. Retrieved April 12, 2019.
- "Nevada Caucus Results 2020 | Live Election Map | Voting by County & District". Politico.com. Retrieved March 2, 2020.
- "2020 POTUS Race ratings" (PDF). The Cook Political Report. Retrieved May 21, 2019.
- "POTUS Ratings | Inside Elections". insideelections.com. Retrieved May 21, 2019.
- "Larry J. Sabato's Crystal Ball » 2020 President". crystalball.centerforpolitics.org. Retrieved May 21, 2019.
- "2020 Election Forecast". Politico. November 19, 2019.
- "Battle for White House". RCP. April 19, 2019.
- 2020 Bitecofer Model Electoral College Predictions, Niskanen Center, March 24, 2020, retrieved: April 19, 2020
- David Chalian; Terence Burlij. "Road to 270: CNN's debut Electoral College map for 2020". CNN. Retrieved June 16, 2020.
- "Forecasting the US elections". The Economist. Retrieved July 7, 2020.
- "2020 Election Battleground Tracker". CBS News. July 12, 2020. Retrieved July 13, 2020.
- "2020 Presidential Election Interactive Map". 270 to Win.
- "ABC News Race Ratings". CBS News. July 24, 2020. Retrieved July 24, 2020.
- "2020 Electoral Map Ratings: Trump Slides, Biden Advantage Expands Over 270 Votes". NPR.org. Retrieved August 3, 2020.
- "Biden dominates the electoral map, but here's how the race could tighten". NBC News. Retrieved August 6, 2020.
- "2020 Election Forecast". FiveThirtyEight. Retrieved August 14, 2020.
- "Official List of Candidates". Nevada Secretary of State. Retrieved September 17, 2020.
- "U.S Presidential - Nevada General Election 2020". silverstateelection.nv.gov.
- "Nevada 2020 President exit polls". www.cnn.com. Retrieved December 14, 2020.
- "CNN Announces the date of publication of crucial results for Nevada". Cnn.com. Retrieved November 5, 2020.
- "Polls show how Latino voters helped drive Biden win in Nevada, though Trump gained ground since 2016". thenevadaindependent.com. Retrieved December 14, 2020.
- "Let It Go", Work Like You're Showing Off!, Hoboken, NJ, USA: John Wiley & Sons, Inc., pp. 17–23, November 8, 2011, ISBN 978-1-118-25616-9, retrieved December 14, 2020
- Valverde, Miriam (November 6, 2020). "Republicans in Nevada found "at least 3,062 instances of voter fraud. ... Thousands of individuals have been identified who appear to have violated the law by casting ballots after they moved from NV."". Politifact. Retrieved November 11, 2020.
- Wolfe, Jan (November 17, 2020). "As options dwindle, Trump allies ask court to halt Biden's win in Nevada". Reuters. Retrieved November 20, 2020.
President Donald Trump's campaign on Tuesday announced a lawsuit to halt President-elect Joe Biden’s victory in Nevada
- Durkee, Alison (November 24, 2020). "Nevada Certifies Election Results, Making Biden's Victory Official". Forbes.
Further reading
- Summary: State Laws on Presidential Electors (PDF), Washington DC: National Association of Secretaries of State, August 2020,
Nevada
External links
- Government Documents Round Table of the American Library Association, "Nevada", Voting & Elections Toolkits
- "Nevada: Election Tools, Deadlines, Dates, Rules, and Links", Vote.org, Oakland, CA
- "League of Women Voters of Nevada". (State affiliate of the U.S. League of Women Voters)
- Nevada at Ballotpedia