2020 United States presidential election in Colorado
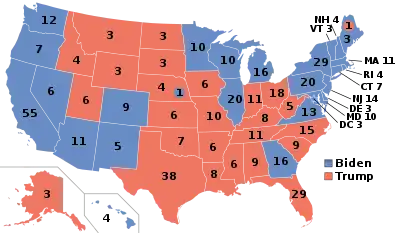
The 2020 United States presidential election in Colorado was held on Tuesday, November 3, 2020, as part of the 2020 United States presidential election in which all 50 states plus the District of Columbia participated.[1] Colorado voters chose electors to represent them in the Electoral College via a popular vote, pitting the Republican Party's nominee, incumbent President Donald Trump, and running mate Vice President Mike Pence against Democratic Party nominee, former Vice President Joe Biden, and his running mate California Senator Kamala Harris. Colorado has nine electoral votes in the Electoral College.[2]
| ||||||||||||||||||||||||||
| Turnout | 86.87% | |||||||||||||||||||||||||
|---|---|---|---|---|---|---|---|---|---|---|---|---|---|---|---|---|---|---|---|---|---|---|---|---|---|---|
| ||||||||||||||||||||||||||
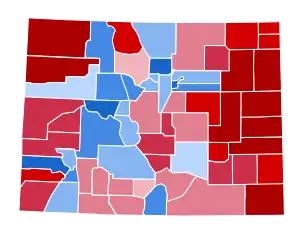 County Results
| ||||||||||||||||||||||||||
| ||||||||||||||||||||||||||
.jpg.webp)
| Elections in Colorado |
|---|
 |
The Democratic National Committee (DNC) proposed Denver as a finalist to host the 2020 Democratic National Convention, but the city declined, citing conflicts.[3] The DNC ultimately decided to hold the convention in Milwaukee, Wisconsin.
Prior to the election, all 14 news organizations considered Colorado a state Biden would win, or a likely blue state. On the day of the election, Biden won Colorado with over 55% of the vote, and by a victory margin of 13.5%, the strongest Democratic performance since Lyndon B. Johnson in 1964, and the first time since 1984 that the margin was in the double digits. It was also the first time since the 1964 election that Colorado voted more Democratic than New Mexico, its neighbor to the south. In this election, Colorado weighed in as 9.1% more Democratic than the nation as a whole. The results solidified Colorado as a Democratic stronghold, rather than the Democratic-leaning battleground state it had been for the past three election cycles.[4] Biden's win also marks the first time in presidential election history that the state has voted for the Democratic Party in four presidential elections in a row since statehood since it voted for Barack Obama in 2008 and in 2012 as well as Hillary Clinton in 2016. Per exit polls by the Associated Press, changing demographics made Colorado more favorable to Democrats, with Latinos backing Biden with 68%, including Latinos of Mexican heritage with 75%. Biden also carried whites with 53%. 69% of voters favored increasing federal government spending on green and renewable energy, and they favored Biden by 76%–23%.[5]
Biden narrowly flipped Pueblo County, which had been reliably Democratic before narrowly backing Trump in 2016. Biden also flipped Chaffee County, which backed Barack Obama in 2012, and became the first Democrat to win Garfield County since 1992. Additionally, Biden became the first Democrat to win more than 40% in the populous Republican stronghold of El Paso County since 1964.[6] Nevertheless, Biden became the first Democrat since Woodrow Wilson in 1912 to win the White House without carrying Las Animas County.[7]
Trump however did flip Alamosa County, which had not voted Republican since 2004.
Primary elections
The primary elections were held on Super Tuesday, March 3, 2020.
Republican primary
The Republican primary was due to be canceled until Robert Ardini, a retired advertising executive, decided to submit his name for the ballot. Several others subsequently joined him.
| Candidate | Votes | % | Estimated delegates[10] |
|---|---|---|---|
| Donald Trump | 628,876 | 92.26 | 37 |
| Bill Weld | 25,698 | 3.77 | |
| Joe Walsh (withdrawn) | 13,072 | 1.92 | |
| Matthew John Matern | 7,239 | 1.06 | |
| Robert Ardini | 3,388 | 0.50 | |
| Zoltan Istvan | 3,350 | 0.49 | |
| Total | 681,623 | 100% | 37 |
Democratic primary
The results were certified on March 30.[11] The race has been called for Bernie Sanders[12] who won a plurality of votes and delegates.
| Candidate | Votes | % | Delegates[15][16] |
|---|---|---|---|
| Bernie Sanders | 355,293 | 37.00 | 29 |
| Joe Biden | 236,565 | 24.64 | 21 |
| Michael Bloomberg | 177,727 | 18.51 | 9 |
| Elizabeth Warren | 168,695 | 17.57 | 8 |
| Tulsi Gabbard | 10,037 | 1.05 | |
| Andrew Yang (withdrawn) | 3,988 | 0.42 | |
| Tom Steyer (withdrawn†) | 3,323 | 0.35 | |
| Cory Booker (withdrawn) | 1,276 | 0.13 | |
| Roque De La Fuente III | 1,136 | 0.12 | |
| Marianne Williamson (withdrawn†) | 1,086 | 0.11 | |
| Rita Krichevsky | 445 | 0.05 | |
| Robby Wells | 330 | 0.03 | |
| Deval Patrick (withdrawn) | 227 | 0.02 | |
| Total | 960,128 | 100% | 67 |
Libertarian nominee
- Jo Jorgensen, Psychology Senior Lecturer at Clemson University
General election
Predictions
| Source | Ranking | As of |
|---|---|---|
| The Cook Political Report[17] | Likely D | November 3, 2020 |
| Inside Elections[18] | Solid D | November 3, 2020 |
| Sabato's Crystal Ball[19] | Likely D | November 3, 2020 |
| Politico[20] | Likely D | November 3, 2020 |
| RCP[21] | Lean D | November 3, 2020 |
| Niskanen[22] | Safe D | November 3, 2020 |
| CNN[23] | Lean D | November 3, 2020 |
| The Economist[24] | Safe D | November 3, 2020 |
| CBS News[25] | Likely D | November 3, 2020 |
| 270towin[26] | Likely D | November 3, 2020 |
| ABC News[27] | Solid D | November 3, 2020 |
| NPR[28] | Likely D | November 3, 2020 |
| NBC News[29] | Likely D | November 3, 2020 |
| 538[30] | Solid D | November 3, 2020 |
Graphical summary
Aggregate polls
| Source of poll aggregation |
Dates administered |
Dates updated |
Joe Biden Democratic |
Donald Trump Republican |
Other/ Undecided [lower-alpha 2] |
Margin |
|---|---|---|---|---|---|---|
| 270 to Win | October 5–20, 2020 | October 26, 2020 | 52.2% | 40.2% | 7.6% | Biden +12.0 |
| FiveThirtyEight | until November 1, 2020 | November 1, 2020 | 53.3% | 41.4% | 5.3% | Biden +11.9 |
| Average | 52.8% | 40.8% | 6.4% | Biden +12.0 | ||
Polls
| Poll source | Date(s) administered |
Sample size[lower-alpha 3] |
Margin of error |
Donald Trump Republican |
Joe Biden Democratic |
Jo Jorgensen Libertarian |
Howie Hawkins Green |
Other | Undecided |
|---|---|---|---|---|---|---|---|---|---|
| SurveyMonkey/Axios | Oct 20 – Nov 2, 2020 | 2,991 (LV) | ± 2.5% | 44%[lower-alpha 4] | 55% | - | - | – | – |
| Keating Research/Onsight Public Affairs/Colorado Sun | Oct 29 – Nov 1, 2020 | 502 (LV)[lower-alpha 5] | ± 4.4% | 41% | 53% | - | - | – | – |
| Data for Progress | Oct 27 – Nov 1, 2020 | 709 (LV) | ± 3.7% | 42% | 54% | 3% | 1% | 0%[lower-alpha 6] | – |
| Swayable | Oct 23 – Nov 1, 2020 | 455 (LV) | ± 6% | 41% | 55% | 3% | 1% | – | – |
| Morning Consult | Oct 22–31, 2020 | 727 (LV) | ± 4% | 41% | 54% | - | - | – | – |
| SurveyMonkey/Axios | Oct 1–28, 2020 | 5,925 (LV) | – | 40% | 59% | - | - | – | – |
| Morning Consult | Oct 11–20, 2020 | 788 (LV) | ± 3.5% | 39% | 55% | - | - | – | – |
| RBI Strategies | Oct 12–16, 2020 | 502 (LV) | ± 4.4% | 38% | 55% | 3% | 1% | 1%[lower-alpha 7] | 1% |
| RMG Research/PoliticalIQ | Oct 9–15, 2020 | 800 (LV) | ± 3.5% | 43% | 51% | - | - | 1%[lower-alpha 8] | 3% |
| Civiqs/Daily Kos | Oct 11–14, 2020 | 1,013 (LV) | ± 3.6% | 42% | 53% | - | - | 3%[lower-alpha 9] | 1% |
| Keating Research/OnSight Public Affairs/Melanson | Oct 8–13, 2020 | 519 (LV) | ± 4.3% | 39% | 54% | - | - | 3%[lower-alpha 10] | 4% |
| Morning Consult | Oct 2–11, 2020 | 837 (LV) | ± 3.4% | 40% | 54% | - | - | – | – |
| YouGov/University of Colorado | Oct 5–9, 2020 | 800 (LV) | ± 4.64% | 38% | 47% | - | - | 3% | 11% |
| SurveyUSA/9News/Colorado Politics | Oct 1–6, 2020 | 1,021 (LV) | ± 3.9% | 40% | 50% | - | - | 5%[lower-alpha 11] | 4% |
| SurveyMonkey/Axios | Sep 1–30, 2020 | 2,717 (LV) | – | 41% | 57% | - | - | – | 2% |
| Morning Consult | Aug 29 – Sep 7, 2020 | 657 (LV) | ± (2%–4%) | 43%[lower-alpha 12] | 49% | - | - | – | – |
| Fabrizio Ward/Hart Research Associates/AARP | Aug 30 – Sep 5, 2020 | 800 (LV) | ± 3.5% | 40% | 50% | - | - | 2%[lower-alpha 13] | 8% |
| Global Strategy Group/Progress Colorado[upper-alpha 1] | Aug 28 – Sep 1, 2020 | 800 (LV) | ± 3.5% | 39% | 50% | 4% | 1% | 1%[lower-alpha 14] | 4% |
| SurveyMonkey/Axios | Aug 1–31, 2020 | 2,385 (LV) | – | 41% | 57% | - | - | – | 2% |
| Morning Consult | Aug 21–30, 2020 | 638 (LV) | ± 4% | 41%[lower-alpha 15] | 51% | - | - | – | – |
| Morning Consult | Aug 16–25, 2020 | ~600 (LV) | ± 4.0% | 42% | 51% | - | - | – | – |
| Morning Consult | Aug 7–16, 2020 | 601 (LV) | ± 4% | 41%[lower-alpha 16] | 51% | - | - | – | – |
| Morning Consult | Aug 6–15, 2020 | ~600 (LV) | ± 4.0% | 41% | 51% | - | - | – | – |
| Morning Consult | Jul 7 – Aug 5, 2020 | ~600 (LV) | ± 4.0% | 40% | 52% | - | - | – | – |
| SurveyMonkey/Axios | Jul 1–31, 2020 | 2,337 (LV) | – | 40% | 58% | - | - | – | 2% |
| Morning Consult | Jul 17–26, 2020 | 616 (LV) | ± 4.0% | 39%[lower-alpha 17] | 52% | - | - | – | – |
| Morning Consult | Jul 13–22, 2020 | ~600 (LV) | ± 4.0% | 41% | 51% | - | - | – | – |
| Public Policy Polling/AFSCME[upper-alpha 2] | Jul 23–24, 2020 | 891 (V) | – | 41% | 54% | - | - | – | 5% |
| Public Policy Polling/End Citizens United | Jun 29–30, 2020 | 840 (V) | ± 3.4% | 39% | 56% | - | - | – | 5% |
| SurveyMonkey/Axios | Jun 8–30, 2020 | 1,088 (LV) | – | 42% | 57% | - | - | – | 2% |
| Morning Consult | May 17–26, 2020 | 572 (LV) | – | 42% | 50% | - | - | – | – |
| Global Strategy Group (D) | May 7–11, 2020 | 700 (RV) | ± 3.5% | 40% | 53% | - | - | – | 7% |
| Keating Research/OnSight Public Affairs/Melanson/Colorado Politics | May 1–3, 2020 | 600 (LV) | ± 4% | 36% | 55% | - | - | 3%[lower-alpha 18] | 6% |
| Montana State University Bozeman | Apr 10–19, 2020 | 379 (LV) | – | 35% | 53% | - | - | 3% | 8% |
| Climate Nexus | Feb 11–15, 2020 | 485 (RV) | ± 4.5% | 43% | 46% | - | - | – | 11% |
| Emerson College | Aug 16–19, 2019 | 1,000 (RV) | ± 3.0% | 45% | 55% | - | - | – | – |
| Fabrizio Ward/AARP | Jul 29–31, 2019 | 600 (LV) | ± 4.0% | 42% | 51% | - | - | 1%[lower-alpha 19] | 5% |
Former candidates | |||||||||||||||||||||||||||||||||||||||||||||||||||||||||||||||||||||||||||||||||||||||||||||||||||||||||
|---|---|---|---|---|---|---|---|---|---|---|---|---|---|---|---|---|---|---|---|---|---|---|---|---|---|---|---|---|---|---|---|---|---|---|---|---|---|---|---|---|---|---|---|---|---|---|---|---|---|---|---|---|---|---|---|---|---|---|---|---|---|---|---|---|---|---|---|---|---|---|---|---|---|---|---|---|---|---|---|---|---|---|---|---|---|---|---|---|---|---|---|---|---|---|---|---|---|---|---|---|---|---|---|---|---|
|
Hypothetical polling | ||||||||||||||||||||||||||||||||||||||||
|---|---|---|---|---|---|---|---|---|---|---|---|---|---|---|---|---|---|---|---|---|---|---|---|---|---|---|---|---|---|---|---|---|---|---|---|---|---|---|---|---|
|
Results
| Party | Candidate | Votes | % | ±% | |
|---|---|---|---|---|---|
| Democratic | Joe Biden Kamala Harris |
1,804,352 | 55.40% | +7.28% | |
| Republican | Donald Trump Mike Pence |
1,364,607 | 41.90% | -1.41% | |
| Libertarian | Jo Jorgensen Spike Cohen |
52,460 | 1.61% | -3.56% | |
| Green | Howie Hawkins Angela Walker |
8,986 | 0.28% | -1.09% | |
| Independent | Kanye West Michelle Tidball |
8,089 | 0.25% | N/A | |
| Constitution | Don Blankenship William Mohr |
5,061 | 0.16% | -0.26% | |
| Unity | Bill Hammons Eric Bodenstab |
2,730 | 0.08% | N/A | |
| American Solidarity | Brian Carroll Amar Patel |
2,515 | 0.08% | +0.05% | |
| Independent | Mark Charles Adrian Wallace |
2,011 | 0.06% | N/A | |
| Socialism and Liberation | Gloria La Riva Sunil Freeman |
1,035 | 0.03% | +0.01% | |
| Independent American | Kyle Koptike Nathan Sorenson |
762 | 0.02% | -0.02% | |
| Alliance | Rocky De La Fuente Darcy Richardson |
636 | 0.02% | -0.02% | |
| Independent | Joe McHugh Elizabeth Storm |
614 | 0.02% | N/A | |
| Independent | Brock Pierce Karla Ballard |
572 | 0.02% | N/A | |
| Prohibition | Phil Collins Billy Joe Parker |
568 | 0.02% | +0.01% | |
| Independent | Princess Khadijah Jacob-Fambro Khadijah Jacob Sr. |
495 | 0.02% | N/A | |
| Progressive | Dario Hunter Dawn Neptune Adams |
379 | 0.01% | N/A | |
| Approval Voting | Blake Huber Frank Atwood |
355 | 0.01% | N/A | |
| Socialist Workers | Alyson Kennedy Malcolm Jarrett |
354 | 0.01% | -0.01% | |
| Socialist Equality | Joseph Kishore Norissa Santa Cruz |
196 | 0.01% | N/A | |
| Independent | Jordan "Cancer" Scott Jennifer Tepool |
175 | 0.01% | N/A | |
| Independent | Thomas Hoefling Andy Prior |
24 | 0.00% | N/A | |
| Independent | Todd Cella Timothy Cella |
4 | 0.00% | N/A | |
| Total votes | 3,256,980 | 100.00% | |||
Results by county
| County | Biden | Trump | Others | Total | |||
|---|---|---|---|---|---|---|---|
| Votes | % | Votes | % | Votes | % | ||
| Adams | 134,202 | 56.69% | 95,657 | 40.41% | 6,876 | 2.90% | 236,735 |
| Alamosa | 3,759 | 48.14% | 3,813 | 48.83% | 236 | 3.03% | 7,808 |
| Arapahoe | 213,607 | 61.00% | 127,323 | 36.36% | 9,253 | 2.64% | 350,183 |
| Archuleta | 3,738 | 40.88% | 5,189 | 56.75% | 217 | 2.37% | 9,144 |
| Baca | 317 | 14.25% | 1,867 | 83.91% | 41 | 1.84% | 2,225 |
| Bent | 732 | 32.19% | 1,503 | 66.09% | 39 | 1.72% | 2,274 |
| Boulder | 159,089 | 77.19% | 42,501 | 20.62% | 4,521 | 2.19% | 206,111 |
| Broomfield | 29,077 | 62.35% | 16,295 | 34.94% | 1,260 | 2.71% | 46,632 |
| Chaffee | 7,160 | 52.20% | 6,222 | 45.36% | 335 | 2.44% | 13,717 |
| Cheyenne | 131 | 11.53% | 993 | 87.41% | 12 | 1.06% | 1,076 |
| Clear Creek | 3,604 | 55.04% | 2,754 | 42.06% | 190 | 2.90% | 6,548 |
| Conejos | 1,959 | 45.21% | 2,286 | 52.76% | 88 | 2.03% | 4,333 |
| Costilla | 1,311 | 62.61% | 741 | 35.39% | 42 | 2.00% | 2,094 |
| Crowley | 437 | 24.97% | 1,271 | 72.63% | 42 | 2.40% | 1,750 |
| Custer | 1,112 | 30.60% | 2,474 | 68.08% | 48 | 1.32% | 3,634 |
| Delta | 5,887 | 30.39% | 13,081 | 67.53% | 402 | 2.08% | 19,370 |
| Denver | 313,293 | 79.55% | 71,618 | 18.19% | 8,916 | 2.26% | 393,827 |
| Dolores | 341 | 23.53% | 1,089 | 75.16% | 19 | 1.31% | 1,449 |
| Douglas | 104,653 | 45.19% | 121,270 | 52.36% | 5,676 | 2.45% | 231,599 |
| Eagle | 18,588 | 63.79% | 9,892 | 33.95% | 660 | 2.26% | 29,140 |
| El Paso | 161,941 | 42.75% | 202,828 | 53.54% | 14,080 | 3.71% | 378,849 |
| Elbert | 4,490 | 23.65% | 14,027 | 73.89% | 466 | 2.46% | 18,983 |
| Fremont | 7,369 | 28.83% | 17,517 | 68.54% | 671 | 2.63% | 25,557 |
| Garfield | 15,427 | 49.92% | 14,717 | 47.62% | 760 | 2.46% | 30,904 |
| Gilpin | 2,223 | 53.11% | 1,833 | 43.79% | 130 | 3.10% | 4,186 |
| Grand | 4,710 | 47.72% | 4,883 | 49.47% | 277 | 2.81% | 9,870 |
| Gunnison | 6,976 | 64.08% | 3,599 | 33.06% | 312 | 2.86% | 10,887 |
| Hinsdale | 255 | 40.35% | 353 | 55.85% | 24 | 3.80% | 632 |
| Huerfano | 2,076 | 47.12% | 2,203 | 50.00% | 127 | 2.88% | 4,406 |
| Jackson | 175 | 19.98% | 681 | 77.74% | 20 | 2.28% | 876 |
| Jefferson | 218,396 | 57.88% | 148,417 | 39.33% | 10,544 | 2.79% | 377,357 |
| Kiowa | 98 | 10.85% | 795 | 88.04% | 10 | 1.11% | 903 |
| Kit Carson | 662 | 17.10% | 3,144 | 81.22% | 65 | 1.68% | 3,871 |
| La Plata | 20,548 | 57.61% | 14,233 | 39.91% | 886 | 2.48% | 35,667 |
| Lake | 2,303 | 58.14% | 1,497 | 37.79% | 161 | 4.07% | 3,961 |
| Larimer | 126,120 | 56.22% | 91,489 | 40.78% | 6,729 | 3.00% | 224,338 |
| Las Animas | 3,497 | 43.93% | 4,284 | 53.81% | 180 | 2.26% | 7,961 |
| Lincoln | 470 | 17.73% | 2,135 | 80.54% | 46 | 1.73% | 2,651 |
| Logan | 2,218 | 21.06% | 8,087 | 76.79% | 227 | 2.15% | 10,532 |
| Mesa | 31,536 | 34.80% | 56,894 | 62.78% | 2,192 | 2.42% | 90,622 |
| Mineral | 317 | 41.93% | 427 | 56.48% | 12 | 1.59% | 756 |
| Moffat | 1,203 | 17.12% | 5,670 | 80.70% | 153 | 2.18% | 7,026 |
| Montezuma | 5,836 | 37.65% | 9,306 | 60.04% | 358 | 2.31% | 15,500 |
| Montrose | 7,687 | 30.84% | 16,770 | 67.29% | 465 | 1.87% | 24,922 |
| Morgan | 3,876 | 28.20% | 9,593 | 69.80% | 275 | 2.00% | 13,744 |
| Otero | 3,605 | 37.65% | 5,756 | 60.11% | 215 | 2.24% | 9,576 |
| Ouray | 2,365 | 58.83% | 1,577 | 39.23% | 78 | 1.94% | 4,020 |
| Park | 4,903 | 39.89% | 6,991 | 56.88% | 396 | 3.23% | 12,290 |
| Phillips | 486 | 19.56% | 1,958 | 78.79% | 41 | 1.65% | 2,485 |
| Pitkin | 8,989 | 75.18% | 2,780 | 23.25% | 188 | 1.57% | 11,957 |
| Prowers | 1,458 | 26.22% | 4,008 | 72.07% | 95 | 1.71% | 5,561 |
| Pueblo | 43,772 | 49.57% | 42,252 | 47.85% | 2,275 | 2.58% | 88,299 |
| Rio Blanco | 561 | 15.20% | 3,061 | 82.93% | 69 | 1.87% | 3,691 |
| Rio Grande | 2,495 | 39.57% | 3,660 | 58.05% | 150 | 2.38% | 6,305 |
| Routt | 10,582 | 62.70% | 5,925 | 35.11% | 369 | 2.19% | 16,876 |
| Saguache | 1,884 | 55.59% | 1,413 | 41.69% | 92 | 2.72% | 3,389 |
| San Juan | 342 | 60.85% | 202 | 35.94% | 18 | 3.21% | 562 |
| San Miguel | 3,924 | 76.24% | 1,136 | 22.07% | 87 | 1.69% | 5,147 |
| Sedgwick | 301 | 20.82% | 1,121 | 77.52% | 24 | 1.66% | 1,446 |
| Summit | 12,631 | 68.35% | 5,322 | 28.80% | 526 | 2.85% | 18,489 |
| Teller | 5,278 | 31.16% | 11,241 | 66.36% | 420 | 2.48% | 16,939 |
| Washington | 369 | 12.27% | 2,595 | 86.27% | 44 | 1.46% | 3,008 |
| Weld | 66,060 | 39.56% | 96,145 | 57.58% | 4,763 | 2.86% | 166,968 |
| Yuma | 785 | 15.76% | 4,107 | 82.45% | 89 | 1.79% | 4,981 |
| Total | 1,804,352 | 55.40% | 1,364,607 | 41.90% | 87,993 | 2.70% | 3,256,952 |
Counties that flipped from Republican to Democratic
By congressional district
Biden won 4 out of the 7 congressional districts in Colorado.
| District | Trump | Biden | Representative |
|---|---|---|---|
| 1st | 22% | 76% | Diana DeGette |
| 2nd | 34% | 64% | Joe Neguse |
| 3rd | 52% | 46% | Scott Tipton |
| Lauren Boebert | |||
| 4th | 57% | 41% | Ken Buck |
| 5th | 55% | 42% | Doug Lamborn |
| 6th | 39% | 58% | Jason Crow |
| 7th | 37% | 60% | Ed Perlmutter |
Notes
- Michael Bennet, Pete Buttigieg, John Delaney and Amy Klobuchar officially withdrew. Thus all votes cast for them were not counted.[14]
- Calculated by taking the difference of 100% and all other candidates combined.
- Key:
A – all adults
RV – registered voters
LV – likely voters
V – unclear - Overlapping sample with the previous SurveyMonkey/Axios poll, but more information available regarding sample size
- Additional data sourced from FiveThirtyEight
- "Other candidate or write-in" with 0%
- "Someone else" with 3%
- "Some other candidate" with 1%
- "Someone else" with 3%
- "Other candidate" with 3%
- "Some other candidate" with 5%
- Overlapping sample with the previous Morning Consult poll, but more information available regarding sample size
- Would not vote with 2%
- West (B) with 1%
- Overlapping sample with the previous Morning Consult poll, but more information available regarding sample size
- Overlapping sample with the previous and subsequent Morning Consult polls, but more information available regarding sample size
- Overlapping sample with the previous Morning Consult poll, but more information available regarding sample size
- "Other candidate" with 3%
- Would not vote/would not vote for president with 1%
- Partisan clients
- Poll sponsored by a pro-Affordable Care Act organisation
- AFSCME endorsed Biden prior to this poll's sampling period
See also
References
- Kelly, Ben (August 13, 2018). "US elections key dates: When are the 2018 midterms and the 2020 presidential campaign?". The Independent. Retrieved January 3, 2019.
- "Distribution of Electoral Votes". National Archives and Records Administration. Retrieved January 3, 2019.
- "City of Milwaukee 1 of 3 finalists to host 2020 Democratic National Convention". FOX6Now.com. June 20, 2018. Retrieved July 1, 2018.
- "'Purple' Colorado could go blue in 2020 election as younger voters flock to state, experts say". FOX TV Digital Team. September 8, 2020. Retrieved November 9, 2020.
- "Colorado Voter Surveys: How Different Groups Voted". The New York Times. November 3, 2020. ISSN 0362-4331. Retrieved November 9, 2020.
- "2020 Presidential General Election Results - El Paso County, CO". Dave Leip's Election Atlas. September 8, 2020. Retrieved February 4, 2021.
- "County winners, 1836-2016". Google Docs. Retrieved November 15, 2020.
- "2020 Presidential Primary Candidate List". Secretary of State of Colorado. Retrieved January 9, 2020.
- "2020 Presidential Primary Results by County". Colorado Secretary of State. Colorado Secretary of State. March 30, 2020. Archived from the original on April 17, 2020. Retrieved April 17, 2020.
- "Colorado Republican Delegation 2020". The Green Papers. Retrieved March 11, 2020.
- "2020 State Abstract Certificate and Results" (PDF). Colorado Secretary of State. Colorado Secretary of State. March 30, 2020. Archived (PDF) from the original on April 17, 2020. Retrieved April 17, 2020.
- "Colorado Election Results 2020". NBC News. Retrieved March 5, 2020.
- "2020 Presidential Primary Results by County". Colorado Secretary of State. Colorado Secretary of State. March 30, 2020. Archived from the original on April 17, 2020. Retrieved April 17, 2020.
- "Election Night Reporting". results.enr.clarityelections.com. Colorado Secretary of State. March 30, 2020. Archived from the original on April 17, 2020. Retrieved April 17, 2020.
- "State Convention Results – Colorado Caucus 2020". Colorado Democratic Party. Retrieved May 3, 2020.
- "Congressional District Assembly/Convention Results – Colorado Caucus 2020". Colorado Democratic Party. Retrieved May 3, 2020.
- "2020 POTUS Race ratings" (PDF). The Cook Political Report. Retrieved May 21, 2019.
- "POTUS Ratings | Inside Elections". insideelections.com. Retrieved May 21, 2019.
- "Larry J. Sabato's Crystal Ball » 2020 President". crystalball.centerforpolitics.org. Retrieved May 21, 2019.
- "2020 Election Forecast". Politico. November 19, 2019.
- "Battle for White House". RCP. April 19, 2019.
- 2020 Bitecofer Model Electoral College Predictions, Niskanen Center, March 24, 2020, retrieved: April 19, 2020.
- David Chalian; Terence Burlij. "Road to 270: CNN's debut Electoral College map for 2020". CNN. Retrieved June 16, 2020.
- "Forecasting the US elections". The Economist. Retrieved July 7, 2020.
- "2020 Election Battleground Tracker". CBS News. July 12, 2020. Retrieved July 13, 2020.
- "2020 Presidential Election Interactive Map". 270 to Win.
- "ABC News Race Ratings". CBS News. July 24, 2020. Retrieved July 24, 2020.
- "2020 Electoral Map Ratings: Trump Slides, Biden Advantage Expands Over 270 Votes". NPR.org. Retrieved August 3, 2020.
- "Biden dominates the electoral map, but here's how the race could tighten". NBC News. Retrieved August 6, 2020.
- "2020 Election Forecast". FiveThirtyEight. Retrieved September 23, 2020.
- "Colorado Election Results". Colorado Secretary of State. Retrieved November 30, 2020.
Further reading
- Summary: State Laws on Presidential Electors (PDF), Washington DC: National Association of Secretaries of State, August 2020,
Colorado
External links
- "League of Women Voters of Colorado". (State affiliate of the U.S. League of Women Voters)
- League of Women Voters, "Voting in my state: Colorado", Vote411.org