2020 United States presidential election in Arizona
The 2020 United States presidential election in Arizona was held on Tuesday, November 3, 2020, as part of the 2020 United States presidential election, in which all 50 states and the District of Columbia participated.[1] Arizona voters chose 11 electors[2] to represent them in the Electoral College via a popular vote pitting incumbent Republican President Donald Trump and his running mate, incumbent Vice President Mike Pence, against Democratic challenger and former Vice President Joe Biden and his running mate, United States Senator Kamala Harris of California. The Libertarian, Green, Socialism and Liberation, and Constitution nominees were also on the ballot, as was an Independent candidate.
| ||||||||||||||||||||||||||
| Turnout | 79.90% (of registered voters) | |||||||||||||||||||||||||
|---|---|---|---|---|---|---|---|---|---|---|---|---|---|---|---|---|---|---|---|---|---|---|---|---|---|---|
| ||||||||||||||||||||||||||
 County results
| ||||||||||||||||||||||||||
| ||||||||||||||||||||||||||
.jpg.webp)
| Elections in Arizona |
|---|
 |
Trump carried the Arizona in 2016 by 3.50%, and it was considered a vital battleground in this election. The state's bitterly competitive nature was attributed to diversification of Maricopa County, a traditionally Republican stronghold that holds 61.62% of the state's population.[3][4] Maricopa County was seen as vital to either candidate's chances in the state – only one presidential candidate has ever won the state without carrying it.[5] The county is home to Phoenix (the state capital and largest city), Mesa, Chandler, Scottsdale, Glendale, Tempe, and several other major cities. Biden's lead was credited to educated, white suburbanites, formerly Republican voting blocs that have shifted continuously towards the left in recent years.[6] High turnout among Hispanic/Latino and Native American voters was also seen as vital. Polls of the state throughout the campaign generally showed a Biden lead, albeit by a slender margin. Prior to election day, 11 of the 16 news organizations making election predictions considered that Arizona was leaning towards Biden; the other five considered it a toss-up.
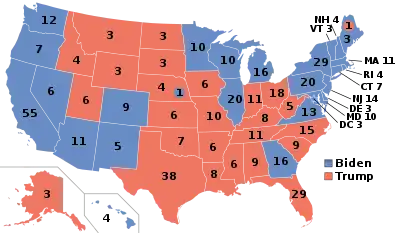
Biden ultimately won the state by a mere 10,457 votes over Trump, a 0.30% margin, marking the first time since Bill Clinton won it in 1996, and only the second time since Harry S. Truman's 1948 victory, that a Democratic presidential nominee won Arizona. Arizona was the second-closest state in 2020, the only closer state being Georgia, marking the first time since 1948 that the Democratic nominee won both Sun Belt states (though Clinton won each state in separate elections).
Per exit polls by the Associated Press,[7] Biden won 59% of Latino voters, including 65% of Latinos of Mexican heritage, who made up the vast majority of the Hispanic electorate. Hispanic and Latino voters comprised 18% of the electorate, up from 15% in 2016[8] and 16% in 2008.[9] He won 58% of independents and was even able to notch 9% of Republicans and 10% of conservatives. That support allowed Biden to narrowly flip Maricopa County, making him the first Democrat since Truman in 1948 to do so. He held his deficit among suburban voters to 51-48 despite Republicans having won them by double digits in 2016, 2012, and 2008. Biden won college-educated voters 53-46, a 17 point swing from 2016 when Trump won them by 10 percentage points. Additionally, Biden performed relatively well for a Democratic candidate among the state's Latter-day Saint voters, carrying 18% of their vote.[10] Biden had touted his endorsement from Cindy McCain and leaned into his friendship with the late Senator John McCain in advertising.[11] Trump disparaged him on several instances at rallies while campaigning and during his presidency, even after McCain's death, and refused to attend his funeral,[12] which some credited as the finishing blow to his performance among Arizona's moderate voter base.[13] Pushing Biden over the top was a strong performance among Hispanic and Latino voters and a massive hike in turnout among the state's expansive Native American reservations, most significantly the Navajo Nation.
Primary elections
Canceled Republican primary
On September 9, 2019, the Arizona Republican Party became one of several state Republican parties to officially cancel their respective primaries and caucuses.[14] Donald Trump's re-election campaign and GOP officials have cited the fact that Republicans canceled several state primaries when George H. W. Bush and George W. Bush sought a second term in 1992 and 2004, respectively; and Democrats scrapped some of their primaries when Bill Clinton and Barack Obama were seeking reelection in 1996 and 2012, respectively.[15][16][17]
Of the 57 total delegates, 3 were allocated to each of the state's 9 congressional districts, 10 to at-large delegates, and another 3 to pledged party leaders and elected officials (PLEO delegates). 17 bonus delegates were also allocated.
The state party still formally conducted the higher meetings in their walking subcaucus-type delegate selection system. The legislative district and county conventions were held from February 8 to April 11 to select delegates to the Arizona State Republican Convention. At the Arizona State Republican Convention, which took place on May 9, the state party formally binded all 57 of its national pledged delegates to Trump. A May 15 email from the Arizona GOP stated that "every one of our ... delegates ... elected pledged to support Donald Trump and Mike Pence as the Republican Party's 2020 nominees for President and Vice President!"[15]
The 54 pledged delegates Arizona sent to the national convention were joined by 3 pledged PLEO delegates, consisting of the National Committeeman, National Committeewoman, and chairman of the Arizona Republican Party.
Democratic primary
The Arizona Democratic primary took place on March 17, 2020, on the same date as the Democratic primaries in Florida and Illinois. Former Vice President Joe Biden won the primary with 43.70% of the vote and 38 delegates, running ahead of Senator Bernie Sanders from Vermont, who received 32.68% of the vote and 29 delegates. No other candidates received any delegates and the only other candidates to receive more than 1% of the vote were Senator Elizabeth Warren from Massachusetts, with 5.79%, and former South Bend, Indiana Mayor Pete Buttigieg, with 4.05%. Both Warren and Buttigieg withdrew prior to the contest. The other candidates on the ballot comprised a collective 1.23% of the vote.[18]
Biden won 13 of 15 counties in the state of Arizona, with Sanders winning Coconino (home to Flagstaff) and Yuma (home to its eponymous city) counties.
The official vote totals reported by the Arizona Secretary of State added up to 86.72%, as the remaining 13.28% of the vote was composed of candidates whose individual vote totals were not reported.[18]
.svg.png.webp)
- Biden—40–50%
- Biden—50–60%
- Sanders—30–40%
- Sanders—40–50%
| Candidate | Votes | % | Delegates[20] |
|---|---|---|---|
| Joe Biden | 268,029 | 43.70 | 38 |
| Bernie Sanders | 200,456 | 32.68 | 29 |
| Elizabeth Warren (withdrawn†) | 35,537 | 5.79 | 0 |
| Pete Buttigieg (withdrawn†) | 24,868 | 4.05 | 0 |
| Tulsi Gabbard | 3,014 | 0.49 | 0 |
| Andrew Yang (withdrawn) | 1,921 | 0.31 | 0 |
| Julian Castro (withdrawn) | 754 | 0.12 | 0 |
| Marianne Williamson (withdrawn) | 668 | 0.11 | 0 |
| Roque De La Fuente III | 628 | 0.10 | 0 |
| Deval Patrick (withdrawn) | 242 | 0.04 | 0 |
| Henry Hewes | 208 | 0.03 | 0 |
| Michael A. Ellinger | 184 | 0.03 | 0 |
| Total | 536,509[lower-alpha 1] | 86.72%[lower-alpha 2] | 67 |
†Candidate withdrew after early voting started.
.jpg.webp)
General election
Campaign
Arizona was a heavily contested state throughout the election. Once a reliably Republican state, it has trended more Democratic in recent years, with Trump winning it by just 3.5% in 2016. Compared to past Republicans, Trump's performance was historically weak: Mitt Romney won it with a 9.03% margin in 2012 over Barack Obama,[22] John McCain by 8.48% in 2008 also against Obama,[23] and George W. Bush by 10.45% in 2004 against John Kerry.[24] Arizona was one of just ten states to swing more Democratic in 2016, and its 5.5 percentage point swing was the fourth largest in the country.[25] The swing mirrored a nationwide pattern where suburban voters, formerly the principle Republican voting base, swung deep into the Democratic column. Arizona's leftward swing was also credited to a rapidly growing Hispanic population.
The Democratic advantage in the state was pronounced further in the 2018 elections. Democrat Kyrsten Sinema won the open Senate seat against Trump loyalist[26] and Representative Martha McSally by a margin of 55,900 votes (2.4%),[27] flipping the state blue for the first time since 1988. Sinema carried Maricopa County, which holds the majority of Arizona citizens, by 60,256 votes.[28] McSally would later be appointed to Arizona's other Senate seat on January 3, 2019 after the death of John McCain. Democrats also won a 5–4 majority in Arizona's House of Representatives delegation.
Both candidates spent massive amounts of money on advertising, though Biden outspent Trump 2–1.[29]
Trump visited Arizona significantly more than his opponent, holding 4 rallies in just one week, compared to Biden, who only visited the state once.[30][31] Biden favored small, masked gathering to limit the spread of COVID-19, which ravaged the state's large Navajo communities,[32] whereas Trump favored large rallies with thousands of people in attendance, oftentimes without masks and contrary to the advice of health officials.[33]
.jpg.webp)
At his rallies, Trump campaigned with the Republican Governor of Arizona, Doug Ducey, as well as Republican Senator Martha McSally, in a bid to help her win reelection against Democrat Mark Kelly in the 2020 United States Senate special election. Ducey suffered from low approval ratings due to his handling of the ongoing COVID-19 pandemic – his approval fell from 50% to 29% before the pandemic[34] to a 35–42 deficit in an October 2, 2020 poll.[35] Ducey was booed at a Trump rally in Tucson, with Trump supporters shouting "open up and open our state".[36]
Predictions
| Source | Ranking | As of |
|---|---|---|
| The Cook Political Report[37] | Lean D (flip) | November 3, 2020 |
| Inside Elections[38] | Tilt D (flip) | November 3, 2020 |
| Sabato's Crystal Ball[39] | Lean D (flip) | November 3, 2020 |
| Politico[40] | Tossup | November 3, 2020 |
| RCP[41] | Tossup | November 3, 2020 |
| Niskanen[42] | Likely D (flip) | November 3, 2020 |
| CNN[43] | Tossup | November 3, 2020 |
| The Economist[44] | Lean D (flip) | November 3, 2020 |
| CBS News[45][lower-alpha 3] | Tossup | November 3, 2020 |
| 270towin[46] | Tossup | November 3, 2020 |
| ABC News[47] | Lean D (flip) | November 3, 2020 |
| NPR[48][lower-alpha 4] | Tossup | November 3, 2020 |
| NBC News[49] | Tossup | November 3, 2020 |
| 538[50] | Lean D (flip) | November 3, 2020 |
Polling
- Graphical summary
Aggregate polls
| Source of poll aggregation |
Dates administered |
Dates updated |
Joe Biden Democratic |
Donald Trump Republican |
Other/ Undecided [lower-alpha 5] |
Margin |
|---|---|---|---|---|---|---|
| 270 to Win | October 22 – November 2, 2020 | November 3, 2020 | 48.0% | 45.8% | 6.2% | Biden +2.2 |
| Real Clear Politics | October 25 – November 1, 2020 | November 3, 2020 | 47.9% | 47.0% | 5.1% | Biden +0.9 |
| FiveThirtyEight | until November 2, 2020 | November 3, 2020 | 48.7% | 46.1% | 5.2% | Biden +2.6 |
| Average | 48.2% | 46.3% | 5.5% | Biden +1.9 | ||
2020 polls
| Poll source | Date(s) administered |
Sample size[lower-alpha 6] |
Margin of error |
Donald Trump Republican |
Joe Biden Democratic |
Jo Jorgensen Libertarian |
Howie Hawkins Green |
Other | Undecided |
|---|---|---|---|---|---|---|---|---|---|
| Ipsos/Reuters | Oct 27 – Nov 2 | 610 (LV) | ± 4.5% | 47%[lower-alpha 7] | 50% | 1% | 0% | 2%[lower-alpha 8] | – |
| 47%[lower-alpha 9] | 49% | - | - | 2%[lower-alpha 10] | 1% | ||||
| 48%[lower-alpha 11] | 50% | - | - | 2%[lower-alpha 12] | – | ||||
| SurveyMonkey/Axios | Oct 20 – Nov 2 | 4,278 (LV) | ± 2.5% | 46%[lower-alpha 13] | 52% | - | - | – | – |
| Change Research/CNBC | Oct 29 – Nov 1 | 409 (LV) | ± 4.85% | 47% | 50% | 2% | - | – | 1% |
| Marist College/NBC | Oct 29 – Nov 1 | 717 (LV) | ± 4.5% | 48% | 48% | - | - | 3% | 1% |
| Swayable | Oct 27 – Nov 1 | 360 (LV) | ± 7.1% | 46% | 51% | 4% | - | – | – |
| Data for Progress | Oct 27 – Nov 1 | 1,195 (LV) | ± 2.8% | 47% | 50% | 2% | 1% | 0%[lower-alpha 14] | – |
| AtlasIntel | Oct 30–31 | 641 (LV) | ± 4% | 50.4% | 48.1% | - | - | 1.5%[lower-alpha 15] | – |
| Emerson College | Oct 29–31 | 732 (LV) | ± 3.6% | 46% | 48% | - | - | 6%[lower-alpha 16] | – |
| Morning Consult | Oct 22–31 | 1,059 (LV) | ± 3% | 46% | 48% | - | - | – | – |
| Data Orbital | Oct 28–30 | 550 (LV) | ± 4.2% | 45.3% | 45.9% | 3% | - | 6%[lower-alpha 17] | 5% |
| Siena College/NYT Upshot | Oct 26–30 | 1,253 (LV) | ± 3% | 43% | 49% | 3% | - | 1%[lower-alpha 18] | 5%[lower-alpha 19] |
| Grand Canyon Battleground Poll | Oct 25–30 | 910 (LV) | ± 3.1% | 48% | 45% | 3% | - | 4% | |
| CNN/SSRS | Oct 23–30 | 892 (LV) | ± 4.0% | 46% | 50% | 3% | - | 1%[lower-alpha 20] | 1% |
| Pulse Opinion Research/Rasmussen Reports | Oct 27–29 | 800 (LV) | ± 3.5% | 49% | 45% | - | - | 3%[lower-alpha 21] | – |
| Redfield & Wilton Strategies | Oct 26–29 | 889 (LV) | – | 46% | 50% | 2% | 0% | 1% | 2% |
| Gravis Marketing | Oct 26–28 | 704 (LV) | ± 3.7% | 44% | 48% | - | - | – | 8% |
| Trafalgar Group | Oct 25–28 | 1,002 (LV) | ± 3% | 49% | 46.5% | 2.1% | - | 1.7%[lower-alpha 22] | 0.7% |
| SurveyMonkey/Axios | Oct 1–28 | 5,687 (LV) | – | 46% | 52% | - | - | – | – |
| Ipsos/Reuters | Oct 21–27 | 714 (LV) | ± 4.2% | 47%[lower-alpha 7] | 47% | 2% | 0% | 3%[lower-alpha 23] | – |
| 46%[lower-alpha 24] | 48% | - | - | 3%[lower-alpha 25] | 2% | ||||
| Swayable | Oct 23–26 | 304 (LV) | ± 7.2% | 44% | 52% | 3% | - | – | – |
| Justice Collaborative Project[upper-alpha 1] | Oct 22–25 | 874 (LV) | ± 3.1% | 43% | 49% | - | - | – | 5% |
| OH Predictive Insights | Oct 22–25 | 716 (LV) | ± 3.7% | 46% | 49% | 3% | - | 1%[lower-alpha 26] | 1% |
| Univision/University of Houston/Latino Decisions/North Star Opinion Research |
Oct 17–25 | 725 (RV) | ± 3.64% | 45% | 50% | - | - | 2%[lower-alpha 27] | 3% |
| Patinkin Research Strategies/Arizona Research Consortium (D) | Oct 21–24 | 729 (LV) | ± 3.6% | 45% | 52% | - | - | 2% | 1% |
| Y2 Analytics/Salt Lake Tribune | Oct 15–24 | 700 (LV) | ± 3.7% | 47% | 50% | - | - | – | – |
| Susquehanna Polling & Research Inc./Center for American Greatness[upper-alpha 2] | Oct 19–22 | 504 (LV) | ± 4.4% | 46%[lower-alpha 28] | 46% | 4% | - | 2%[lower-alpha 29] | 1% |
| Ipsos/Reuters | Oct 14–21 | 658 (LV) | ± 4.4% | 46%[lower-alpha 7] | 50% | 1% | - | 2%[lower-alpha 30] | – |
| 46%[lower-alpha 31] | 49% | - | - | 3%[lower-alpha 32] | 2% | ||||
| Morning Consult | Oct 11–20 | 1,066 (LV) | ± 3% | 48% | 47% | - | - | – | – |
| Pulse Opinion Research/Rasmussen Reports | Oct 18–19 | 800 (LV) | ± 3.5% | 46% | 48% | - | - | 3%[lower-alpha 33] | 3% |
| Change Research/CNBC | Oct 16–19 | 232 (LV)[lower-alpha 34] | – | 45% | 51% | - | - | – | – |
| RMG Research/PoliticalIQ | Oct 14–19 | 800 (LV) | ± 3.5% | 46%[lower-alpha 7] | 47% | - | - | 3%[lower-alpha 35] | 5% |
| 44%[lower-alpha 36] | 49% | - | - | 3%[lower-alpha 37] | 5% | ||||
| 47%[lower-alpha 38] | 45% | - | - | 3%[lower-alpha 39] | 5% | ||||
| Data Orbital | Oct 16–18 | 550 (LV) | ± 4.18% | 42% | 47% | 3% | - | 5%[lower-alpha 40] | 2% |
| YouGov/CBS | Oct 13–16 | 1,074 (LV) | ± 4.1% | 45% | 49% | - | - | 3%[lower-alpha 41] | 3% |
| Ipsos/Reuters | Oct 7–14 | 667 (LV) | ± 4.3% | 47%[lower-alpha 7] | 49% | 1% | 0% | 2%[lower-alpha 42] | – |
| 46%[lower-alpha 43] | 50% | - | - | 2%[lower-alpha 44] | 3% | ||||
| Monmouth University | Oct 11–13 | 502 (RV) | ± 4.4% | 44% | 50% | 2% | - | 1%[lower-alpha 45] | 4% |
| 502 (LV) | 44%[lower-alpha 46] | 51% | - | - | 2% | – | |||
| 47%[lower-alpha 47] | 49% | - | - | 1% | – | ||||
| Redfield & Wilton Strategies | Oct 10–13 | 750 (LV) | – | 45%[lower-alpha 34] | 48% | 1% | 0% | – | – |
| Morning Consult | Oct 2–11 | 1,144 (LV) | ± 2.9% | 46% | 49% | - | - | – | – |
| Redfield & Wilton Strategies | Oct 9–10 | 720 (LV) | – | 46%[lower-alpha 34] | 48% | 1% | 0% | – | – |
| Trafalgar Group | Oct 6–8 | 1,087 (LV) | ± 2.89% | 48% | 44% | 2% | - | 2%[lower-alpha 48] | 5% |
| OH Predictive Insights | Oct 4–8 | 608 (LV) | ± 3.97% | 45%[lower-alpha 7] | 49% | 4% | - | 0%[lower-alpha 49] | 3% |
| 47%[lower-alpha 50] | 50% | - | - | 0%[lower-alpha 51] | 3% | ||||
| Redfield and Wilton Strategies | Oct 4–7 | 727 (LV) | ± 3.63% | 43% | 49% | 1% | 1% | 1%[lower-alpha 52] | 6% |
| Ipsos/Reuters | Sep 29 – Oct 7 | 633 (LV) | ± 4.3% | 46% | 48% | - | - | 2%[lower-alpha 53] | 4% |
| Latino Decisions/Democrats for Education Reform[upper-alpha 3] | Sep 28 – Oct 6 | 600 (LV) | ± 4% | 45% | 48% | - | - | – | 5% |
| Basswood Research/American Action Forum[upper-alpha 4] | Oct 3–5 | 800 (LV) | ± 3.5% | 48% | 48% | 2% | - | – | 3% |
| Data Orbital | Oct 3–5 | 550 (LV) | ± 4.18% | 43% | 48% | 3% | - | 3%[lower-alpha 54] | 4% |
| HighGround Inc. | Sep 28 – Oct 5 | 400 (LV) | ± 4.9% | 45% | 46% | - | - | 4%[lower-alpha 55] | 5% |
| Change Research/CNBC | Oct 2–4 | 296 (LV) | – | 45% | 51% | - | - | – | – |
| Siena College/NYT Upshot | Oct 1–3 | 655 (LV) | ± 4.2% | 41% | 49% | 3% | – | 1%[lower-alpha 56] | 6%[lower-alpha 57] |
| Patinkin Research Strategies/Arizona Research Consortium (D) | Oct 1–3 | 604 (LV) | ± 3.8% | 46% | 50% | - | - | 3% | 1% |
| Targoz Market Research/PollSmart | Sep 23 – Oct 2 | 1,045 (LV) | ± 3.03% | 46% | 45% | - | - | 10% | – |
| Suffolk University | Sep 26–30 | 500 (LV) | ± 4.4% | 46% | 50% | 1% | - | 1%[lower-alpha 58] | 2% |
| SurveyMonkey/Axios | Sep 1–30 | 7,100 (LV) | – | 47% | 51% | - | - | – | 2% |
| Strategies 360/Smart and Safe Arizona[upper-alpha 5] | Sep 24–29 | 800 (LV) | ± 3.5% | 45% | 49% | - | - | 2%[lower-alpha 59] | 4% |
| Susquehanna Polling & Research Inc/Center for American Greatness[upper-alpha 2] | Sep 25–28 | 500 (LV) | ± 4.3% | 47% | 47% | - | - | – | – |
| Data for Progress (D) | Sep 23–28 | 808 (LV) | ± 3.4% | 45%[lower-alpha 7] | 49% | 1% | 0% | – | 4% |
| 46%[lower-alpha 60] | 50% | - | - | – | 4% | ||||
| Redfield & Wilton Strategies | Sep 23–26 | 871 (LV) | ± 3.32% | 44% | 47% | 1% | 1% | 1%[lower-alpha 61] | 6% |
| Data For Progress[upper-alpha 6] | Sep 15–22 | 481 (LV) | ± 4.4% | 46% | 45% | - | - | – | 10% |
| Change Research/CNBC | Sep 18–20 | 262 (LV) | – | 43% | 49% | - | - | – | – |
| ABC/Washington Post | Sep 15–20 | 579 (LV) | ± 4.5% | 49% | 48% | - | - | 2%[lower-alpha 62] | 1% |
| Hart Research Associates/Human Rights Campaign[upper-alpha 7] | Sep 17–19 | 400 (LV) | ± 4.9% | 42% | 53% | - | - | – | – |
| Data Orbital | Sep 14–17 | 550 (LV) | – | 47% | 49% | - | - | – | – |
| Ipsos/Reuters | Sep 11–17 | 565 (LV) | ± 4.7% | 46% | 47% | - | - | 2%[lower-alpha 63] | 5% |
| Redfield & Wilton Strategies | Sep 12–16 | 855 (LV) | ± 3.35% | 42% | 47% | 1% | 0% | 1%[lower-alpha 64] | 8% |
| Monmouth University | Sep 11–15 | 420 (RV) | ± 4.8% | 44% | 48% | 4% | - | 1%[lower-alpha 65] | 3% |
| 420 (LV) | 46%[lower-alpha 66] | 48% | - | - | 3% | 3% | |||
| 47%[lower-alpha 67] | 47% | - | - | 3% | 3% | ||||
| Siena College/NYT Upshot | Sep 10–15 | 653 (LV) | ± 4.1% | 40% | 49% | 4% | - | 1%[lower-alpha 68] | 6%[lower-alpha 69] |
| Patinkin Research Strategies/Arizona Research Consortium (D) | Sep 10–13 | 679 (LV) | ± 3.8% | 46% | 49% | - | - | 4% | 2% |
| Kaiser Family Foundation/Cook Political Report | Aug 29 – Sep 13 | 1,298 (RV) | ± 3% | 40% | 45% | - | - | 4%[lower-alpha 70] | 11% |
| Gravis Marketing | Sep 10–11 | 684 (LV) | ± 3.8% | 48% | 50% | - | - | – | 2% |
| YouGov/CBS | Sep 9–11 | 1,106 (LV) | ± 3.9% | 44% | 47% | - | - | 3%[lower-alpha 71] | 6% |
| OH Predictive Insights | Sep 8–10 | 600 (LV) | ± 4% | 42% | 52% | - | - | – | 5% |
| Benenson Strategy Group/GS Strategy Group/AARP | Aug 28 – Sep 8 | 1,600 (LV) | ± 2.5% | 47% | 48% | - | - | 1%[lower-alpha 72] | 4% |
| Morning Consult | Aug 29 – Sep 7 | 901 (LV) | ± (2%–4%) | 46%[lower-alpha 73] | 49% | - | - | – | – |
| Change Research/CNBC | Sep 4–6 | 470 (LV) | – | 45% | 49% | - | - | 6%[lower-alpha 74] | – |
| Redfield & Wilton Strategies | Aug 30 – Sep 4 | 830 (LV) | ± 3.4% | 43% | 48% | 0% | 1% | 0%[lower-alpha 75] | 6% |
| FOX News | Aug 29 – Sep 1 | 772 (LV) | ± 3.5% | 40% | 49% | 3% | - | 1%[lower-alpha 76] | 6% |
| 858 (RV) | ± 3.0% | 39% | 49% | 3% | - | 3%[lower-alpha 77] | 6% | ||
| Basswood Research/American Action Forum[upper-alpha 4] | Aug 29–31, 2020 | 800 (LV) | ± 3.5% | 48%[lower-alpha 7] | 47% | 1%[lower-alpha 78] | 2% | – | 2% |
| 49%[lower-alpha 79] | 48% | - | - | – | 3% | ||||
| SurveyMonkey/Axios | Aug 1–31 | 6,456 (LV) | – | 52% | 47% | - | - | – | 2% |
| Morning Consult | Aug 21–30 | 943 (LV) | ± 3.0% | 42% | 52% | - | - | – | – |
| Change Research/CNBC | Aug 21–23 | 344 (LV) | – | 47% | 49% | - | - | – | – |
| Redfield and Wilton Strategies | Aug 16–18 | 856 (LV) | ± 3.4% | 38% | 47% | 1% | 1% | 3%[lower-alpha 80] | 10% |
| Morning Consult | Aug 7–16 | 947 (LV) | ± (2%–4%) | 47% | 45% | - | - | – | – |
| Emerson College | Aug 8–10 | 661 (LV) | ± 3.8% | 47%[lower-alpha 81] | 53% | - | - | – | – |
| Change Research/CNBC | Aug 7–9 | 428 (LV) | – | 44% | 45% | - | - | – | – |
| Trafalgar Group | Aug 5–8 | 1,013 (LV) | ± 2.9% | 46% | 45% | 3% | - | 1%[lower-alpha 82] | 4% |
| OH Predictive Insights | Aug 3–4 | 603 (LV) | ± 4.0% | 45% | 49% | - | - | – | – |
| OnMessage Inc./Heritage Action[upper-alpha 8] | Aug 2–4 | 400 (LV) | ± 4.9% | 51% | 48% | - | - | – | 2% |
| Data for Progress | Jul 24 – Aug 2 | 1,215 (LV) | – | 43%[lower-alpha 7] | 45% | 2% | 1% | – | 10% |
| 44%[lower-alpha 83] | 47% | - | - | – | 8% | ||||
| SurveyMonkey/Axios | Jul 1–31 | 4,995 (LV) | – | 51% | 47% | - | - | – | 2% |
| Change Research/CNBC | Jul 24–26 | 365 (LV) | – | 45% | 47% | - | - | – | – |
| Morning Consult | Jul 17–26 | 908 (LV) | ± 3.3% | 42%[lower-alpha 84] | 49% | - | - | – | – |
| Morning Consult | Jul 16–25 | – (LV)[lower-alpha 85] | – | 43% | 49% | - | - | – | – |
| CNN/SSRS | Jul 18–24 | 873 (RV) | ± 3.8% | 45% | 49% | - | - | 4%[lower-alpha 86] | 2% |
| Redfield & Wilton Strategies | Jul 19–23 | 858 (LV) | – | 38% | 46% | 2% | 1% | 3%[lower-alpha 87] | 11% |
| NBC News/Marist College | Jul 14–22 | 826 (RV) | ± 4.1% | 45% | 50% | - | - | 1% | 3% |
| Public Policy Polling/AFSCME[upper-alpha 9] | Jul 17–18 | 960 (RV) | – | 45% | 49% | - | - | – | 6% |
| Spry Strategies/American Principles Project[upper-alpha 10] | Jul 11–16 | 700 (LV) | ± 3.7% | 45% | 49% | - | - | – | 6% |
| Morning Consult | Jul 6–15 | – (LV)[lower-alpha 88] | – | 45% | 47% | - | - | – | – |
| Change Research/CNBC | Jul 10–12 | 345 (LV) | – | 45% | 51% | - | - | – | – |
| YouGov/CBS | Jul 7–10 | 1,087 (LV) | ± 3.8% | 46% | 46% | - | - | 4%[lower-alpha 89] | 4% |
| OH Predictive Insights | Jul 6–7 | 600 (LV) | ± 4.0% | 44% | 49% | - | - | 0%[lower-alpha 90] | 7% |
| Morning Consult | Jun 26 – Jul 5 | – (LV)[lower-alpha 91] | – | 42% | 48% | - | - | – | – |
| SurveyMonkey/Axios | Jun 8–30 | 2,365 (LV) | – | 52% | 46% | - | - | – | 2% |
| Data Orbital | Jun 27–29 | 600 (LV) | ± 4.0% | 45% | 47% | - | - | 3.3%[lower-alpha 92] | 4.2% |
| Morning Consult | Jun 16–25 | – (LV)[lower-alpha 93] | – | 43% | 47% | - | - | – | – |
| Change Research/CNBC | Jun 26–28 | 311 (LV)[lower-alpha 34] | – | 44% | 51% | - | - | – | – |
| Gravis Marketing/OANN | Jun 27 | 527 (LV) | ± 4.3% | 49% | 45% | - | - | – | 7% |
| Redfield & Wilton Strategies | Jun 14–17 | 865 (LV) | ± 3.3% | 39% | 43% | 2% | 1% | 2%[lower-alpha 94] | 13% |
| Siena College/NYT Upshot | Jun 8–16 | 650 (RV) | ± 4.3% | 41% | 48% | - | - | 4%[lower-alpha 95] | 8% |
| Civiqs/Daily Kos | Jun 13–15 | 1,368 (RV) | ± 2.9% | 45% | 49% | - | - | 5%[lower-alpha 96] | 1% |
| Morning Consult | Jun 6–15 | – (LV)[lower-alpha 97] | – | 44% | 47% | - | - | – | – |
| Change Research/CNBC | Jun 12–14 | 201 (LV)[lower-alpha 34] | – | 44% | 45% | - | - | 5%[lower-alpha 98] | – |
| Morning Consult | May 27 – Jun 5 | – (LV)[lower-alpha 99] | – | 47% | 45% | - | - | – | – |
| FOX News | May 30 – Jun 2 | 1,002 (RV) | ± 3% | 42% | 46% | - | - | 6%[lower-alpha 100] | 5% |
| Change Research/CNBC | May 29–31 | 329 (LV)[lower-alpha 34] | – | 45% | 44% | - | - | 9% | 2% |
| Morning Consult | May 17–26 | 784 (LV) | – | 47%[lower-alpha 101] | 45% | - | - | – | – |
| Morning Consult | May 16–25 | – (LV)[lower-alpha 102] | – | 46% | 46% | - | - | – | – |
| HighGround Inc. | May 18–22 | 400 (LV) | ± 4.9% | 45% | 47% | - | - | 4%[lower-alpha 103] | 4%[lower-alpha 104] |
| Redfield & Wilton Strategies | May 10–14 | 946 (LV) | ± 3.2% | 41% | 45% | - | - | 3%[lower-alpha 105] | 10% |
| OH Predictive Insights | May 9–11 | 600 (LV) | ± 4% | 43% | 50% | - | - | 1%[lower-alpha 106] | 6% |
| Morning Consult | May 6–15 | – (LV)[lower-alpha 107] | – | 47% | 45% | - | - | – | – |
| GBAO Strategies/PLUS Paid Family Leave | Apr 13–16 | 500 (LV) | – | 46% | 47% | - | - | 2% | 5% |
| OH Predictive Insights | Apr 7–8 | 600 (LV) | ± 4.0% | 43% | 52% | - | - | – | – |
| NBC News/Wall Street Journal/Marist College | Mar 10–15 | 2,523 (RV) | ± 2.7% | 46% | 47% | - | - | 1% | 5% |
| Monmouth University | Mar 11–14 | 847 (RV) | ± 3.4% | 43% | 46% | - | - | 2% | 6% |
| Univision | Mar 6–11 | 1,036 (RV) | ± 3.0% | 42% | 50% | - | - | – | 8% |
| OH Predictive Insights | Mar 3–4 | 600 (LV) | ± 4.0% | 43% | 49% | - | - | – | 8% |
| Public Policy Polling | Mar 2–3 | 666 (V) | – | 46% | 47% | - | - | – | 6% |
| Climate Nexus | Feb 11–15 | 539 (RV) | ± 4.3% | 46% | 42% | - | - | – | 13% |
| Fabrizio, Lee & Associates/Team McSally/Politico[upper-alpha 11] | Jan 22–24 | 1,000 (LV) | ± 3.1% | 50% | 45% | - | - | – | 6% |
| Public Policy Polling | Jan 2–4 | 760 (V) | – | 46% | 46% | - | - | – | 8% |
2019 polls
| Poll source | Date(s) administered |
Sample size[lower-alpha 108] |
Margin of error |
Donald Trump Republican |
Joe Biden Democratic |
Other | Undecided |
|---|---|---|---|---|---|---|---|
| OH Predictive Insights | Dec 3–4 | 628 (LV) | ± 3.91% | 46% | 44% | 0%[lower-alpha 109] | 10% |
| Emerson College | Oct 25–28 | 901 (RV) | ± 3.2% | 50% | 50% | – | – |
| Siena College/NYT Upshot | Oct 13–23 | 652 (LV) | ± 4.4% | 46% | 49% | – | – |
| Bendixen & Amandi International | Sep 9–12 | 520 (RV) | ± 4.3% | 43% | 42% | 12% | 3% |
| OH Predictive Insights | Aug 13–14 | 600 (LV) | ± 4.0% | 43% | 45% | – | 12% |
| Fabrizio Ward LLC | Jul 29–31 | 600 (LV) | ± 4.0% | 50% | 45% | – | 4% |
| OH Predictive Insights | May 1–2 | 600 (LV) | ± 4.0% | 44% | 49% | – | 7% |
| OH Predictive Insights | Feb 12–13 | 600 (LV) | ± 4.0% | 46% | 46% | – | 7% |
Former candidates | ||||||||||||||||||||||||||||||||||||||||||||||||||||||||||||||||||||||||||||||||||||||||||||||||||||||||||||||||||||||||||||||||||||||||||||||||||||||||||||||||||||||||||||||||||||||||||||||||||||||||||||||||||||||||||||||||||||||||||||||||||||||||||||||||||||||||||||||||||||||||||||||||||||||||||||||||||||||||||||||||||||||||||||||||||||
|---|---|---|---|---|---|---|---|---|---|---|---|---|---|---|---|---|---|---|---|---|---|---|---|---|---|---|---|---|---|---|---|---|---|---|---|---|---|---|---|---|---|---|---|---|---|---|---|---|---|---|---|---|---|---|---|---|---|---|---|---|---|---|---|---|---|---|---|---|---|---|---|---|---|---|---|---|---|---|---|---|---|---|---|---|---|---|---|---|---|---|---|---|---|---|---|---|---|---|---|---|---|---|---|---|---|---|---|---|---|---|---|---|---|---|---|---|---|---|---|---|---|---|---|---|---|---|---|---|---|---|---|---|---|---|---|---|---|---|---|---|---|---|---|---|---|---|---|---|---|---|---|---|---|---|---|---|---|---|---|---|---|---|---|---|---|---|---|---|---|---|---|---|---|---|---|---|---|---|---|---|---|---|---|---|---|---|---|---|---|---|---|---|---|---|---|---|---|---|---|---|---|---|---|---|---|---|---|---|---|---|---|---|---|---|---|---|---|---|---|---|---|---|---|---|---|---|---|---|---|---|---|---|---|---|---|---|---|---|---|---|---|---|---|---|---|---|---|---|---|---|---|---|---|---|---|---|---|---|---|---|---|---|---|---|---|---|---|---|---|---|---|---|---|---|---|---|---|---|---|---|---|---|---|---|---|---|---|---|---|---|---|---|---|---|---|---|---|---|---|---|---|---|---|---|---|---|---|---|---|---|---|---|---|---|---|---|---|---|---|---|---|---|---|---|---|---|---|---|---|---|---|---|---|---|---|---|---|---|---|---|
|
Donald Trump vs. Michael Bloomberg
Donald Trump vs. Pete Buttigieg
Donald Trump vs. Kamala Harris
Donald Trump vs. Amy Klobuchar
Donald Trump vs. Beto O'Rourke
Donald Trump vs. Bernie Sanders
Donald Trump vs. Elizabeth Warren
|
Hypothetical polling | |||||||||||||||||||||
|---|---|---|---|---|---|---|---|---|---|---|---|---|---|---|---|---|---|---|---|---|---|
|
Donald Trump vs. Generic Democrat
|
Fundraising
According to the Federal Election Commission, in 2019 and 2020, Joe Biden and his interest groups raised $9,284,978.20,[51] Donald Trump and his interest groups raised $15,506,263.10,[52] and Jo Jorgensen raised $29,078.65[53] from Arizona-based contributors.
Candidate ballot access
- Joe Biden / Kamala Harris, Democratic
- Donald Trump / Mike Pence, Republican
- Jo Jorgensen / Jeremy "Spike" Cohen, Libertarian
Independent candidates who wished to run were required to submit a nomination petition and financial disclosure form between 120 and 90 days before the primary election. A valid nomination petition required signatures from 3% of unaffiliated registered voters in Arizona as of March 1, 2020. However, the signatories may be of any political party or unaffiliated as long as they have not already signed a petition for a candidate registered in a political party who intends to run in the same election. Petitions may be physical or electronic; in 2012, Arizona introduced E-Qual, an online nominating petition platform.[54]
In-addition, write-in candidates were required to file a nomination paper (including the candidate's name and signature; residence and post office address; age and date of birth; and the length of time the candidate has lived in Arizona) and financial disclosure form by 5:00 p.m. on the 40th day before the election in which the candidate is running – in this case, September 24 – for their votes to be counted. Sore-loser laws prevent candidates who lost a primary election from running in the general election as a write-in candidate. Write-in candidates also may not run if they didn't receive enough signatures to attain ballot access while filing for the primary election or if the candidate did not receive enough signatures to gain ballot access in the general election.[54] The following candidates were given write-in access:[55]
- Howie Hawkins / Angela Nicole Walker, Green
- Jade Simmons / Claudeliah Roze, Independent
- Gloria La Riva / Sunil Freeman, Socialism and Liberation
- Daniel Clyde Cummings / Ryan Huber, Constitution
- President R. Boddie / Eric Stoneham, Independent
Electoral slates
Technically the voters of Arizona cast their ballots for electors, or representatives to the Electoral College, rather than directly for President and Vice President. Arizona is allocated 11 electors because it has 9 congressional districts and 2 senators. All candidates who appear on the ballot or qualify to receive write-in votes must submit a list of 11 electors who pledge to vote for their candidate and their running mate. Whoever wins the most votes in the state is awarded all 11 electoral votes. Their chosen electors then vote for president and vice president. Although electors are pledge to their candidate and running mate, they are not obligated to vote for them. An elector who votes for someone other than their candidate is known as a faithless elector. In the state of Arizona, a faithless elector's vote is voided and replaced, but the faithless elector is not penalized.[56][57]
The electors of each state and the District of Columbia met on December 15, 2020, to cast their votes for president and vice president. All 11 pledged electors cast their votes for President-elect former Vice President Joe Biden and Senator Kamala Harris from California. The Electoral College itself never meets as one body. Instead, the electors from each state and the District of Columbia met in their respective capitols. The electoral vote was tabulated and certified by Congress in a joint session on January 6, 2021 per the Electoral Count Act.
These electors were nominated by each party in order to vote in the Electoral College should their candidate win the state:[58]
| Joe Biden and Kamala Harris Democratic Party |
Donald Trump and Mike Pence Republican Party |
Jo Jorgensen and Spike Cohen Libertarian Party |
Howie Hawkins and Angela Walker Green Party |
Jade Simmons and Claudeliah J. Roze Independent |
Gloria La Riva and Sunil Freeman Socialism and Liberation |
Daniel Clyde Cummings and Ryan Huber Constitution Party |
President R. Boddie and Eric Stoneham Independent |
|---|---|---|---|---|---|---|---|
| Steve Gallardo Luis Alberto Heredia Constance Jackson Sandra D. Kennedy Stephen Roe Lewis James McLaughlin Jonathan Nez Ned Norris Regina Romero Felecia Rotellini Fred Yamashita |
Tyler Bowyer Nancy Cottle Jake Hoffman Anthony T. Kern James Lamon Robert Montgomery Samuel I. Moorhead Loraine B. Pellegrino Greg Safsten Kelli Ward Michael Ward |
Timothy Benjamin Howard Blitz Jeffery T. Daniels Alejandro Flores Barry Hess Michael Kielsky Doug Marks Robert A. Pepiton II Brandon Slayton Scott Steward Jonathan Winder |
Cara Bissell Celeste M. Castorena Cesario C. Castorena Angela Dixon Antonio Macías Linda Macías Betty J. McMurrin Elisa Olea Eduardo Quintana Richard Scott Angel Torres |
Celeslie L. Boyer Sydney Curtis Maryann Ehmann Valerie Grapentine Jared Korth JoAnna Langston Erica Martin Kia McMurray Dennis McMurray Jr. Brittany Sanchez Veronica Scheier |
Jake Beeson Jaymie Beeson Becca Hansen Jacob Hansen Karen Huber Ryan Huber Deric Powell Kristin Powell Chad Prior Diana Prior Luis Ruiz |
La Deysha Black Donshadre Dukes Travis Froman Maria Guevara Maria Elena Lechaga Omar Leyva Ema Maldonado Rebecca Martinez Lynette Tucci Stephanie Valenzuela Andrea Varela |
Results
| Party | Candidate | Votes | % | ±% | |
|---|---|---|---|---|---|
| Democratic | Joe Biden Kamala Harris |
1,672,143 | 49.36% | +4.78% | |
| Republican | Donald Trump Mike Pence |
1,661,686 | 49.06% | +0.98% | |
| Libertarian | Jo Jorgensen Spike Cohen |
51,465 | 1.52% | -2.56% | |
| Green | Howie Hawkins (write-in) Angela Walker (write-in) |
1,557 | 0.05% | -1.27% | |
| Independent | Jade Simmons (write-in) Claudeliah Roze (write-in) |
236 | 0.01% | N/A | |
| Socialism and Liberation | Gloria La Riva (write-in) Sunil Freeman (write-in) |
190 | 0.01% | N/A | |
| Constitution | Daniel Clyde Cummings[lower-alpha 114] (write-in) Ryan Huber (write-in) |
36 | 0.00% | -0.04% | |
| Independent | President R. Boddie (write-in) Eric Stoneham (write-in) |
13 | 0.00% | N/A | |
| Total votes | 3,387,326 | 100.00% | |||
By county
Note: The percentages in this table are not the same as the totals above. This is because the table below includes write-in votes with the candidates unreported by the Arizona Secretary of State.
| County | Joe Biden Democratic |
Donald Trump Republican |
Jo Jorgensen Libertarian |
Other | Margin | Total votes cast | |||||
|---|---|---|---|---|---|---|---|---|---|---|---|
| # | % | # | % | # | % | # | % | # | % | ||
| Apache | 23,293 | 66.05% | 11,442 | 32.44% | 437 | 1.24% | 96 | 0.27% | 11,851 | 33.61% | 35,268 |
| Cochise | 23,732 | 39.12% | 35,557 | 58.61% | 1,153 | 1.90% | 223 | 0.36% | -11,825 | -19.49% | 60,665 |
| Coconino | 44,698 | 60.70% | 27,052 | 36.74% | 1,522 | 2.07% | 360 | 0.48% | 17,646 | 23.96% | 73,632 |
| Gila | 8,943 | 32.24% | 18,377 | 66.26% | 342 | 1.23% | 73 | 0.26% | -9,434 | -34.02% | 27,735 |
| Graham | 4,034 | 26.84% | 10,749 | 71.52% | 212 | 1.41% | 34 | 0.23% | -6,715 | -44.68% | 15,029 |
| Greenlee | 1,182 | 31.98% | 2,433 | 65.83% | 70 | 1.89% | 11 | 0.30% | -1,251 | -33.85% | 3,696 |
| La Paz | 2,236 | 29.93% | 5,129 | 68.64% | 93 | 1.24% | 14 | 0.19% | -2,893 | -38.71% | 7,472 |
| Maricopa | 1,040,774 | 50.13% | 995,665 | 47.96% | 31,705 | 1.53% | 7,942 | 0.38% | 45,109 | 2.17% | 2,076,086 |
| Mohave | 24,831 | 23.67% | 78,535 | 74.88% | 1,302 | 1.24% | 215 | 0.20% | -53,704 | -51.21% | 104,883 |
| Navajo | 23,383 | 45.03% | 27,657 | 53.26% | 727 | 1.40% | 163 | 0.31% | -4,274 | -8.23% | 51,930 |
| Pima | 304,981 | 58.41% | 207,758 | 39.79% | 7,658 | 1.47% | 1,777 | 0.34% | 97,223 | 18.62% | 522,174 |
| Pinal | 75,106 | 40.48% | 107,077 | 57.72% | 2,791 | 1.50% | 551 | 0.29% | -31,971 | -17.24% | 185,525 |
| Santa Cruz | 13,138 | 67.10% | 6,194 | 31.63% | 224 | 1.14% | 25 | 0.13% | 6,944 | 35.47% | 19,581 |
| Yavapai | 49,602 | 34.53% | 91,527 | 63.72% | 2,092 | 1.46% | 419 | 0.29% | -41,925 | -29.19% | 143,640 |
| Yuma | 32,210 | 45.97% | 36,534 | 52.14% | 1,137 | 1.62% | 191 | 0.27% | -4,324 | -6.17% | 70,072 |
| Totals | 1,672,143 | 49.22% | 1,661,686 | 48.91% | 51,465 | 1.51% | 12,094 | 0.35% | 10,457 | 0.30% | 3,397,388 |
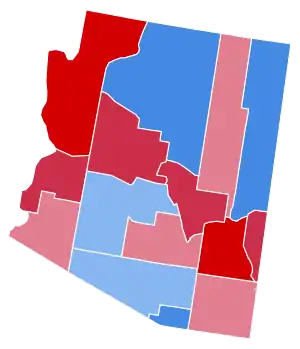
By congressional district
Biden won 5 out of 9 congressional districts in Arizona.[61] The presidential results matched the congressional results, where Democrats held an identical 5–4 majority. Biden flipped the 1st district, which includes Casa Grande, Flagstaff, and Navajo Nation and voted for Donald Trump in 2016 by a 47.7%–46.6% margin against Hillary Clinton. Trump easily won the 4th district, which takes in Prescott and most of the rural, northwestern portion of the state. He also carried the 5th, 6th, and 8th districts, all suburban, college-educated districts where Republican dominance has been slipping in recent years. Notably, the 6th district, despite being represented by a Republican in Congress for all but two years in its history, was won by Trump with a mere 4.1% margin of victory.[28]
Along with the 1st district, Biden carried the 7th and 9th districts, both of which encompass liberal bastions of inner Phoenix and parts of the cities of Glendale and Tempe, respectively. The 2nd and 3rd districts, both border districts dominated by Tucson and large Hispanic populations,[62][63] also voted for Biden.
Results below are percentages from Daily Kos, which does not list exact vote totals per district. Incomplete vote totals are available from the 1st,[64] 2nd,[65] 3rd,[66] and 4th[67] districts at Dave Leip's Atlas of U.S. Presidential Elections.
| District | Joe Biden Democratic |
Donald Trump Republican |
Representative |
|---|---|---|---|
| 1st | 50.1% | 48.4% | Tom O'Halleran |
| 2nd | 54.5% | 43.9% | Ann Kirkpatrick |
| 3rd | 62.8% | 35.7% | Raúl Grijalva |
| 4th | 30.6% | 68.0% | Paul Gosar |
| 5th | 41.9% | 56.4% | Andy Biggs |
| 6th | 47.3% | 51.4% | David Schweikert |
| 7th | 73.7% | 24.7% | Ruben Gallego |
| 8th | 41.4% | 57.3% | Debbie Lesko |
| 9th | 60.8% | 37.3% | Greg Stanton |
Early call
Fox News called Arizona for Biden at 11:20 p.m. EST on November 3, election day, with 73% of projected vote counted.[68] The Associated Press did so at 2:51 a.m. EST on November 4.[69][70] Fox News received push-back from the Trump campaign and no other network called Arizona on election night.[71][72][73][74] Fox News decision desk director Arnon Mishkin defended the Arizona call at 12:30 a.m., saying that Fox News was "four standard deviations from being wrong"[71] and that Trump was "not going to be able to take over and win enough votes to eliminate that seven-point lead that [Biden] has."[75] Biden and other Democratic candidates began election night with a wide lead in the state, and at the time Fox News called Arizona for Biden, he led by 210,259 votes (53.9% to 44.9%).[76] The reporting in Arizona was the reverse of a 'red mirage' and 'blue shift' effect seen nationwide, where the counting of election day votes before early and absentee votes gave Republicans across the country an early lead. Votes cast on election day typically leaned heavily Republican while those cast early and absentee ballots leaned heavily Democratic, partially due to the skepticism of mail in voting mostly from Trump and fellow Republicans.[77] However, Arizona and several other Sun Belt states had the opposite effect. Early votes and absentee votes cast before the election were pre-counted and released shortly after 10:00 p.m. EST, when polls closed. Election day votes, as well as a few absentee votes, were released on election night and trickled in throughout the rest of the week. FiveThirtyEight correctly predicted that close races "might have to wait for those last few ballots before knowing who won."[78] Despite Biden's lead dropping throughout the week, it became clear that Trump's margin among election day votes would not be enough to overtake Biden's lead: Trump needed 59% of the outstanding vote to win,[79][80] but continuously won around only 53% of the votes released in several ballot dumps after election day.[81]
On November 11, Decision Desk HQ, along with several other outlets, projected that Biden would carry the state.[82] On November 12, ABC News, NBC News, CNN and The New York Times all projected Biden to carry the state shortly after 11:00 p.m. Eastern.[83][84][85]
Objection
On January 6, as a joint session of Congress began to certify the election for President-elect Joe Biden and Vice President-elect Kamala Harris, there was an objection to Arizona's 11 electoral votes, brought forward by Representative Paul Gosar of Arizona's 4th congressional district and Senator Ted Cruz of Texas, and signed by 67 other Senators and Representatives.[86] Debates began over the objection in the U.S. Senate and House of Representatives, but were abruptly cut short after threats by pro-Trump demonstrators in that escalated into a full blown storming of the Capitol, forcing the building to be locked down and Congress to be evacuated. After the Capitol was secured at 5:40 p.m.[87] and Congress reconvened, the objection failed 6-93 in the Senate, and 121-303 in the House.[88] The riot reportedly dissuaded several Republican Senators and Representatives from objecting to the Electoral College results.[89]
Lawsuits
Overvotes lawsuit
The Trump campaign, the Republican National Committee and the Arizona Republican Party filed a lawsuit that alleges that "overvotes" were "incorrectly rejected". A representative for Maricopa County stated that only "180 potential overvotes" are at stake in the case.[90] The Trump campaign requested that their evidence be kept secret from the public, but the judge refused to allow the secrecy.[91] The Trump campaign also stated that they had video footage from within a polling area; however, such footage would be illegal if taken within 75 feet of a polling area with voters present. On November 10, 2020, Associate Presiding Civil Judge Daniel Kiley accepted a request from Snell & Wilmer, the law firm which was representing the Trump campaign and its allies, to withdraw from the Arizona lawsuit.[92][93] On November 11, 2020, Arizona Attorney General Mark Brnovich rejected Trump's voter fraud claim during an interview with Fox Business and stated that Biden would win the state of Arizona.[94][95] On November 13, the Trump campaign dropped their lawsuit, after it became evident that the number of votes potentially to be contested would not overcome Biden's margin of victory in the state.[96]
Analysis
Biden became the first Democrat to win Arizona since Bill Clinton's victory in the 1996 United States presidential election, and only the second time since Harry S. Truman in 1948. He is also the first Democrat to win Maricopa County since Truman,[97] with a victory margin of 2.17%, or 45,109 votes.[98] Maricopa County is by far the largest county in Arizona; it is the state capital and largest city, Phoenix, as well as several other major cities including Glendale and Tempe, representing over 61.62% percent of Arizona's population.[3] Any chance Biden had of carrying the state depended on doing reasonably well in Maricopa; Clinton won Arizona mainly by holding his deficit in Maricopa to single digits. Clinton is the only candidate to ever win the state without carrying Maricopa.[5] Ultimately, Biden's lead in Maricopa was over four times his statewide margin of 10,457 votes. Biden also became the first Democrat to break 47% of the vote since Lyndon B. Johnson did so in 1964. Biden's statewide winning margin of 0.3% remained out of range for a recount, since Arizona Revised Statutes does not have provisions for candidate- or voter-requested recounts and an automatic recount will only be performed if the margin is lower than 0.1%.[99]
Arizona was seen as a potential Democratic flip throughout the year, as the state's increasing Hispanic population as well as an influx of retirees and younger college-educated voters were becoming increasingly friendly to the Democratic Party; further signaling the state's blue shift were Arizona's midterm elections, where the Democrats flipped a U.S. Senate seat for the first time since 1988 and won three other statewide races as well as gaining a 5–4 majority in the state's House of Representatives delegation and nearly winning the state legislature.[28]
Some Republicans, such as U.S. Representative from Florida Matt Gaetz, have come to attribute Trump's loss to the unpopularity of Governor Doug Ducey and Senator Martha McSally,[100] who lost to Democrat Mark Kelly in the simultaneous Senate special election by a much larger margin of 78,806 votes (2.35%).[101]
College-educated and moderate voters
Exit polls from the Associated Press[7] indicated that Biden carried college-educated white voters 50–48, which make up 28% of Arizona's electorate. He also carried college-educated voters overall by 53–48 and lost suburban voters by only 51–48. Suburban backlash against Trump and the Republican Party was indicated as far back as 2016, when Arizona shifted 5.5 percentage points to the left even as 40 other states shifted to the right.[25] Among other states that shifted to the left were California, Georgia, Kansas, Texas, and Virginia, all of which states where the primary Republican voting base used to be in the vast suburbs and exurbs outside of major cities.[102] Past Republicans had done very well in the white, heavily educated Phoenix suburbs: Mitt Romney won college-educated voters in Arizona 58–40 in 2012, John McCain by 55–43 in 2008, and George W. Bush by 54–46 in 2004. They also carried suburban voters by twenty points.[9] Perhaps the greatest sign of the suburban revolt was in Arizona's 6th congressional district – the most educated district in Arizona,[28] it has been represented by Republicans for all but two years of its existence, and Bush, Romney, and McCain all won upwards of 60% of the vote in their respective elections.[103][61] This time around, Trump won it by a mere four points.

John McCain and moderate Republicans
Romney, McCain, and Bush were all seen as much more moderate than the Trump wing of the party – several of their former staffers outright endorsed Biden, stating "Given the incumbent president’s lack of competent leadership, his efforts to aggravate rather than bridge divisions among Americans, and his failure to uphold American values, we believe the election of former Vice President Biden is clearly in the national interest."[104] Trump frequently disparaged moderate Republicans, reinvigorating the term RINO ("Republican in name only") to refer to members of the Republican Party who refused to support Trump's efforts to challenge the election results or even Trump's campaign at all.[105] Several of their former presidential staffers endorsed Biden leading up to election day.[104] Trump and his family had criticized the moderate wing of the party on several occasions,[106] which was seen as divide that could prove mortal for the Republican Party in Arizona.[107] On February 29, 2020, Trump called Romney a "low life" after he voted to convict Trump on abuse of power in 2020,[108] which made Romney the only Senator in history to vote to convict a president of his own party. Perhaps the most fatal blow to the Trump campaign was his unabashed criticism of the late Senator McCain, who represented Arizona from 1987 to 2018. Several sources told The Atlantic that Trump told his aides that McCain was "a fucking loser" in response to McCain receiving half-staff flag honors following his death of brain cancer in 2018.[109] He previously disparaged McCain on other occasions, stating "I don't like losers" in reference to him losing the 2008 election, "I like people that weren't captured" in reference to his being a prisoner of war in the Vietnam War,[110] and criticizing him on his deciding vote against the American Health Care Act of 2017, a "skinny repeal" of Obamacare.[111] These incidents culminated in Cindy McCain, John McCain's widow, endorsing Biden on September 22, 2020, tweeting that "There's only one candidate in this race who stands up for our values" in reference to the vice president.[112] Democratic advertising often referenced Biden's longtime friendship with McCain[11][113] in order to appeal to moderate voters.[114]
Most analysts referenced Trump's attack on the moderate wing of the Republican Party (especially McCain) as an extreme disadvantage in the state of Arizona which had already been growing more unfavorable for Republicans.[13][115][116] An article from Politico argued that the Trump campaign "did more damage to the Republican Party in Arizona than almost anywhere else."[117]
Hispanic and Latino voters
Pushing Biden over the edge was the Latino vote, who made up 19% of the electorate, higher than in previous years. Though Democrats have historically won ethnic and racial minorities by large margins,[118] the Arizona Republican Party has had an especially strained relationship with the Latino community going back to 2010 in the wake of the controversial Arizona SB 1070 law, which was seen as, by some, unfairly targeting the Latino community.[7] Historically, Democrats' biggest margins have been in heavily minority counties including two on the southern border, Pima, the second most populous county and home to Tucson, as well as Santa Cruz. A 2020 survey from the Pew Research Center[119] found that the most important issue among Hispanic voters was to "establish [a] way for most immigrants in the U.S. illegally to stay legally," with 54% responding that it was very important and 29% that it was somewhat important. 42% also responded that "improv[ing] security of country's borders" was also a very important issue, and 34% that it was somewhat important. During the campaign, Biden campaigned on ending construction of Trump's Mexican border wall, dramatically increase the refugee cap from Trump's historically low 15,000 cap, and rolling out an easier pathway to citizenship for undocumented and prospective immigrants,[120] including a proposed bill introduced after his inauguration that would unveil up a pathway to citizenship for all 11 million estimated undocumented immigrants.[121] Meanwhile, Trump enacted several immigration restrictions on asylum seekers, refugees, and prospective legal and illegal immigrants, and some pundits credited Trump's victory in 2016 to immigration fearmongering.[122]
While Biden did carry the Hispanic/Latino vote by a large 59-40 margin,[7] this was eleven points weaker than Hillary Clinton's 61-31 win in 2016 among Latinos, in spite of her loss statewide.[123] Santa Cruz County, where 83.46% of the population is Hispanic or Latino,[124] swung 12 points more Republican than in 2016, while Yuma County (63.76% Hispanic or Latino)[125] swung 5.1 points more Republican.[126] Nonetheless, these swings were cancelled out by a massive increase in turnout and a significant increase in the number of Hispanic voters.[127][128]
Native American voters
An increase in indigenous voting was also considered vital to Biden's victory – turnout in the northeast of the state surged compared to 2016.[129] Biden easily won Apache County, dominated by the Navajo and Fort Apache reservations; and Coconino County, encompassing the Havasupai Nation and parts of the Navajo, Hopi, and Hualapai nations. Anywhere from 60 to 90% of the Navajo Nation's 67,000 registered voters voted for Biden.[130] In Pima County, Biden won the precincts encompassing the Tohono O'odham, San Xavier, and Pascua Yaqui reservations, often with over 90% of the vote.[131] The Navajo is the largest Native American reservation in the country .[132]
.jpg.webp)
Aftermath
On November 24, 2020, Governor Doug Ducey acknowledged that Biden won the state.[133]
On January 24, 2021, the Arizona GOP voted to censure Cindy McCain, Jeff Flake, and Doug Ducey, all of whom vehemently denied conspiracy theories from the Trump campaign arguing that the results in Arizona were fraudulent and invalid.[134][135] Between January 6 and January 20, the Arizona Secretary of State office reported that over 8,000 Republicans changed their party registration to Democrat, Libertarian, or unaffiliated, which was attributed to said actions by Trump and the Arizona GOP.[136][137]
See also
Notes
- Partisan clients
- The Justice Collaborative Project is an affiliate of the Tides Centre, a liberal fiscal sponsorship provider
- The Center for American Greatness is a pro-Trump organization
- This poll's sponsor exclusively supports Democratic candidates
- The American Action Forum is a 501 organisation which usually supports Republican candidates
- Smart and Safe Arizona endorsed Proposition 207 prior to this poll's sampling period
- Poll sponsored by the Defend Students Action Fund.
- The Human Rights Campaign endorsed Biden prior to this poll's sampling period
- Heritage Action is the sister organisation of the Heritage Foundation, which exclusively endorses Republican candidates
- AFSCME endorsed Biden prior to this poll's sampling period
- This poll's sponsor is the American Principles Project, a 501(c)(4) organization that supports the Republican Party.
- Poll sponsored by the McSally campaign
- Poll sponsored by 314 Action
- Voter samples and additional candidates
- Total of candidates officially reported, of 613,355 ballots cast.
- Percentages reported by the Arizona Secretary of State do not add up to 100. This may be due to the fact that candidates who formally withdrew (Bennet, Bloomberg, Booker, Delaney, Klobuchar, and Steyer[21]) do not have their vote totals officially reported.[19]
- CBS News' presidential election ratings uniquely do not contain a category for Safe/Solid races.
- NPR's presidential election ratings uniquely do not contain a category for Safe/Solid races.
- Calculated by taking the difference of 100% and all other candidates combined.
- Key:
A – all adults
RV – registered voters
LV – likely voters
V – unclear - Standard VI response
- "Some other candidate" and West (B) with 1%; would not vote with 0%
- If only Biden, Trump and "some other candidate" were available
- "Some other candidate" with 2%; would not vote with 0%
- Results considering those who lean towards a given candidate among those initially predisposed towards abstention, indecision or a candidate besides Biden or Trump in the response section immediately above
- "Some other candidate" with 2%
- Overlapping sample with the previous SurveyMonkey/Axios poll, but more information available regarding sample size
- "Other candidate or write-in" with 0%
- "Other" with 1.5%
- "Someone else" with 6%
- "Refused" with 5%; "Other" with 1%
- "Someone else" with 1%; would not vote with 0%
- Includes "Refused"
- "None of these" with 1%; "Other" with no voters
- "Some other candidate" with 3%
- "Someone else" with 1.7%
- "Some other candidate" with 2%; West (B) with 1%; would not vote with 0%
- If only Biden, Trump and "some other candidate" were available
- "Some other candidate" with 3%; would not vote with 0%
- "Refused" with 1%
- "Someone else" with 2%
- With voters who lean towards a given candidate
- "Other" with 1%; "Refused" with 0%
- "Some other candidate" with 2%; West (B) and would not vote with 0%
- If only Biden, Trump and "some other candidate" were available
- "Some other candidate" with 3%; would not vote with 0%
- "Some other candidate" with 3%
- Additional data sourced from FiveThirtyEight
- "Some other candidate" with 3%
- Results generated with high Democratic turnout model
- "Some other candidate" with 3%
- Results generated with high Republican turnout model
- "Some other candidate" with 3%
- "Refused" with 4%; "Other" with 1%
- "Someone else/third party" with 3%
- "Some other candidate" and would not vote with 1%; West (B) with 0%
- If only Biden, Trump and "some other candidate" were available
- "Some other candidate" with 2%; would not vote with 0%
- "Other candidate" with 1%; "No one" with no voters
- With a likely voter turnout model featuring high turnout
- With a likely voter turnout model featuring low turnout
- "Someone else" with 2%
- "Refused" with 0%
- If the only candidates were Biden and Trump
- "Refused" with 0%
- "Another Third Party/Write-in" with 1%
- "Some other candidate" with 2%; would not vote with 0%
- "Refused" with 3%
- "Some other candidate" with 3%; "Refused" with 2%
- "Someone else" with 1%; would not vote with 0%
- Includes "Refused"
- "Refused" with 1%
- "Another candidate" with 2%
- If the only candidates were Biden and Trump
- "Another Third Party/Write-in" with 1%
- "Neither" with 2%; "other" with 0%; would not vote with no voters
- "Some other candidate" with 2%; would not vote with 0%
- "Another Third Party/Write-in" with 1%
- "No one" with 1%; "Other candidate" with 0%
- With a likely voter turnout model featuring higher turnout than in the 2016 presidential election
- With a likely voter turnout model featuring lower turnout than in the 2016 presidential election
- "Someone else" with 1%; would not vote with 0%
- Includes "Refused"
- "Someone else" with 2%; would not vote with 1%; "Refused" with 0%
- "Someone else/third party" with 3%
- Would not vote with 1%
- Overlapping sample with the previous Morning Consult poll, but more information available regarding sample size
- "Other/not sure" with 6%
- West (B) and "Another Third Party/Write-in" with 0%
- "Other" with 1%
- "Other" with 2%; would not vote with 1%
- Listed as Jacob Hornberger (L)
- If the only candidates were Biden and Trump
- West (B) with 2%; "Another third party/write-in" with 1%
- Including voters who lean towards a given candidate
- "Another Party Candidate" with 1%
- If the only candidates were Biden and Trump
- Overlapping sample with the previous Morning Consult poll, but more information available regarding sample size
- Not yet released
- "Other" with 1%; "Neither" 3%
- West (B) with 2%; "Another Third Party/Write-In" with 1%
- Not yet released
- "Someone else/third party" with 4%; would not vote with 0%
- "Refused" with 0%
- Not yet released
- "Other" with 3.1%; "refused" with 0.2%
- Not yet released
- "other" with 2%
- "Another candidate" and would not vote with 2%
- "Someone else" with 5%
- Not yet released
- "Libertarian Party candidate/Green Party candidate" with 5%
- Not yet released
- "Other" with 5%; would not vote with 1%
- Overlapping sample with the previous Morning Consult poll, but more information available regarding sample size
- Not yet released
- "Some other candidate" with 4.3%
- Includes "refused"
- "Third party/write-in" with 3%
- "Refused" with 1%
- Not yet released
- Key:
A – all adults
RV – registered voters
LV – likely voters
V – unclear - Refused with 0%
- Refused with 0%
- Refused with 0%
- Refused with 1%
- Refused with 1%
- The Constitution Party did not have ballot access in Arizona. Daniel Clyde Cummings and Ryan Huber registered as write-in candidates representing the party instead of the national ticket led by Don Blankenship and William Mohr.
References
- Kelly, Ben (August 13, 2018). "US elections key dates: When are the 2018 midterms and the 2020 presidential campaign?". The Independent. Archived from the original on January 3, 2019. Retrieved January 3, 2019.
- "Distribution of Electoral Votes". National Archives and Records Administration. Archived from the original on January 9, 2019. Retrieved January 3, 2019.
- "County Population Totals: 2010-2019". United States Census Bureau. Retrieved February 1, 2021.
- Collins, Keith; Fessenden, Ford; Gamio, Lazaro; Harris, Rich; Keefe, John; Lu, Denise; Lutz, Eleanor; Walker, Schoenfeld, Amy; Watkins, Derek (November 10, 2020). "Phoenix's Blue Wave Pushes Arizona Toward Biden". The New York Times. ISSN 0362-4331. Retrieved February 1, 2021.
- Kestenbaum, Lawrence. "The Political Graveyard: Maricopa County, Ariz". The Political Graveyard. Retrieved February 2, 2021.
- Sargent, Greg (November 30, 2020). "Opinion: Joe Biden just officially won Arizona. That's a big deal for Democrats". The Washington Post. Retrieved February 1, 2021.
- "Arizona Voter Surveys: How Different Groups Voted". The New York Times. November 3, 2020. ISSN 0362-4331. Retrieved November 9, 2020.
- "2016 election results: Arizona Exit polls". CNN. November 11, 2016. Retrieved February 1, 2021.
- "President Exit Polls - Election 2012". The New York Times. ISSN 0362-4331. Retrieved February 1, 2021.
- Walch, Tad (November 5, 2020). "ChurchBeat: What we know about Latter-day Saint votes in Utah, Arizona". Deseret News. Retrieved November 30, 2020.
- Martin, Jonathan (September 23, 2020). "Cindy McCain Endorses Biden, Citing Trump's Disparagement of Troops". The New York Times. ISSN 0362-4331. Retrieved November 9, 2020.
- Jacobson, Louis (September 4, 2020). "Yes, Donald Trump did call John McCain a 'loser'". PolitiFact. Retrieved February 1, 2021.
- Brook, Benedict (November 14, 2020). "Six word insult that saw Trump lose vital state of Arizona". news.com.au. Retrieved February 1, 2021.
- Stone, Kevin (September 9, 2019). "Arizona GOP won't hold 2020 presidential preference election". KTAR. Archived from the original on September 16, 2019. Retrieved September 11, 2019.
- "Arizona Republican Delegation 2020". The Green Papers. Archived from the original on February 9, 2020. Retrieved February 20, 2020.
- Karni, Annie (September 6, 2019). "GOP plans to drop presidential primaries in 4 states to impede Trump challengers". The Boston Globe. MSN. Archived from the original on January 1, 2020. Retrieved September 7, 2019.
- Steakin, Will; Karson, Kendall (September 6, 2019). "GOP considers canceling at least 3 GOP primaries and caucuses, Trump challengers outraged". ABC News. Archived from the original on June 5, 2020. Retrieved September 7, 2019.
- "State of Arizona Official Canvass: 2020 Presidential Preference Election - Mar 17, 2020" (PDF). Arizona Secretary of State. Retrieved February 1, 2021.
- "State of Arizona Official Canvass: 2020 Presidential Preference Election - Mar 17, 2020" (PDF). Arizona Secretary of State. March 30, 2020. Retrieved October 14, 2020.
- "2020 Presidential Primaries, Caucuses, and Conventions: Arizona Democrat". The Green Papers. Retrieved July 4, 2020.
- "Running for Federal Office, Arizona Secretary of State". azsos.gov. Arizona Secretary of State. Retrieved March 20, 2020.
- "2012 Presidential General Election Results - Arizona". Dave Leip's Atlas of U.S. Presidential Elections. Retrieved February 1, 2021.
- "2008 Presidential General Election Results - Arizona". Dave Leip's Atlas of U.S. Presidential Elections. Retrieved February 1, 2021.
- "2004 Presidential General Election Results - Arizona". Dave Leip's Atlas of U.S. Presidential Elections. Retrieved February 1, 2021.
- "USA Election Map". map.jacksonjude.com. Retrieved February 1, 2021.
- Bycoffe, Aaron (January 13, 2021). "Tracking Congress In The Age Of Trump". FiveThirtyEight. Retrieved February 1, 2021.
- "State of Arizona Official Canvass: 2018 General Election - Nov 06, 2018" (PDF). Arizona Secretary of State. November 30, 2018. Archived (PDF) from the original on December 7, 2018. Retrieved February 1, 2021.
- Savicki, Drew (October 5, 2020). "The Road to 270: Arizona". 270toWin. Retrieved February 1, 2021.
- Samore, Peter (November 3, 2020). "Political advertising spending in 2020 breaks records in Arizona". KTAR.
- "Trump campaign in Arizona push with 4 visits this week". AP NEWS. September 16, 2020.
- Hansen, Ronald J.; Oxford, Andrew. "Joe Biden and Kamala Harris meet tribal leaders, rally supporters in joint visit to Phoenix". The Arizona Republic.
- Klar, Rebecca (May 11, 2020). "Navajo Nation reports more coronavirus cases per capita than any US state". The Hill. Retrieved February 1, 2021.
- Giles, Ben; Hernandez, Rocio (October 29, 2020). "Arizona Gov. Ducey Attends Trump Rallies Against State Health Director's Advice". KJZZ.
- "Governor Rankings". Morning Consult. Retrieved February 1, 2021.
- Polletta, Maria (October 2, 2020). "Arizona voters give Ducey low marks for job performance in Suffolk University/USA TODAY poll". The Arizona Republic. Retrieved February 1, 2021.
- "Trump Tucson rally draws over a thousand, supporters talk COVID-19". KGUN. October 20, 2020.
- "2020 POTUS Race ratings" (PDF). The Cook Political Report. Archived from the original on March 23, 2020. Retrieved May 21, 2019.
- "POTUS Ratings | Inside Elections". insideelections.com. Archived from the original on May 27, 2020. Retrieved May 21, 2019.
- "Larry J. Sabato's Crystal Ball » 2020 President". crystalball.centerforpolitics.org. Archived from the original on April 4, 2020. Retrieved May 21, 2019.
- "2020 Election Forecast". Politico. November 19, 2019. Archived from the original on June 14, 2020. Retrieved April 8, 2020.
- "Battle for White House". RCP. April 19, 2019. Archived from the original on May 3, 2020. Retrieved April 27, 2020.
- 2020 Bitecofer Model Electoral College Predictions Archived April 23, 2020, at the Wayback Machine, Niskanen Center, March 24, 2020, retrieved: April 19, 2020.
- David Chalian; Terence Burlij. "Road to 270: CNN's debut Electoral College map for 2020". CNN. Archived from the original on June 16, 2020. Retrieved September 24, 2020.
- "Forecasting the US elections". The Economist. Archived from the original on June 28, 2020. Retrieved July 7, 2020.
- "2020 Election Battleground Tracker". CBS News. July 12, 2020. Archived from the original on September 24, 2020. Retrieved September 24, 2020.
- "2020 Presidential Election Interactive Map". 270 to Win. Retrieved January 15, 2020.
- "ABC News Race Ratings". CBS News. July 24, 2020. Archived from the original on July 24, 2020. Retrieved July 24, 2020.
- "2020 Electoral Map Ratings: Trump Slides, Biden Advantage Expands Over 270 Votes". NPR.org. Archived from the original on August 4, 2020. Retrieved August 3, 2020.
- "Biden dominates the electoral map, but here's how the race could tighten". NBC News. Archived from the original on August 7, 2020. Retrieved August 6, 2020.
- "2020 Election Forecast". FiveThirtyEight. Archived from the original on August 12, 2020. Retrieved September 24, 2020.
- "BIDEN, JOSEPH R JR - Candidate overview". Federal Election Commission. Retrieved December 9, 2020.
- "TRUMP, DONALD J. - Candidate overview". Federal Election Commission. Retrieved December 9, 2020.
- "JORGENSEN, JO - Candidate overview". Federal Election Commission. Retrieved December 9, 2020.
- "Ballot access requirements for political candidates in Arizona". Ballotpedia. Retrieved February 2, 2021.
- "Arizona 2020 General Election". The Green Papers. Retrieved February 2, 2021.
- "Faithless Elector State Laws". FairVote. July 7, 2020. Retrieved February 3, 2021.
- "Arizona Revised Statutes Title 16. Elections and Electors § 16-212". FindLaw. Retrieved February 3, 2021.
- "Arizona Certificate of Ascertainment 2020" (PDF). National Archives and Records Administration. November 30, 2020. Retrieved February 3, 2021.
- "Arizona 2020 General Election". Green Papers. Archived from the original on August 21, 2020. Retrieved September 17, 2020.
- "State of Arizona Official Canvass" (PDF). Arizona Secretary of State. November 2020.
- Nir, David (November 19, 2020). "Daily Kos Elections' presidential results by congressional district for 2020, 2016, and 2012". Daily Kos. Retrieved February 2, 2021.
- "My Congressional District - Arizona - Congressional District 2". United States Census Bureau. Powered by the American Community Survey and County Business Patterns. Retrieved February 2, 2021.CS1 maint: others (link)
- "My Congressional District - Arizona - Congressional District 3". United States Census Bureau. Powered by the American Community Survey and County Business Patterns. Retrieved February 2, 2021.CS1 maint: others (link)
- "2020 Presidential General Election Results - Arizona - CD1". Dave Leip's Atlas of U.S. Presidential Elections. Retrieved February 2, 2021.
- "2020 Presidential General Election Results - Arizona - CD2". Dave Leip's Atlas of U.S. Presidential Elections. Retrieved February 2, 2021.
- "2020 Presidential General Election Results - Arizona - CD3". Dave Leip's Atlas of U.S. Presidential Elections. Retrieved February 2, 2021.
- "2020 Presidential General Election Results - Arizona - CD4". Dave Leip's Atlas of U.S. Presidential Elections. Retrieved February 2, 2021.
- Karni, Annie; Haberman, Maggie (November 4, 2020). "Fox's Arizona call for Joe Biden flipped the mood at Trump campaign headquarters". Chicago Tribune.
- "BREAKING: Joe Biden wins Arizona. #APracecall at 12:51 a.m. MST. #Election2020". Twitter. November 4, 2020. Retrieved February 2, 2021.
- Slodysko, Brian (November 4, 2020). "EXPLAINER: Why AP called Arizona for Biden". Associated Press. Retrieved November 5, 2020.
- Stratford, Michael (November 4, 2020). "Fox News defends calling Arizona for Biden after pushback from Trump team". Politico.
- Goodykoontz, Bill (November 4, 2020). "Fox News second-guessed calling Arizona for Biden. It was 100% election night's best moment". The Arizona Republic.
- Romero, Simon (November 5, 2020). "Trump Supporters Protest at Maricopa County Vote-Counting Site". The New York Times. ISSN 0362-4331. Retrieved February 3, 2021.
- Izadi, Elahe (November 5, 2020). "Who won Arizona? Why the call still differs by media organization". The Washington Post.
- Peters, Justin (November 4, 2020). "Fox News' Arizona Call Drove Fox News Crazy". Slate. Retrieved November 30, 2020.
- Montanaro, Domenico (November 19, 2020). "AP Explains Calling Arizona For Biden Early, Before It Got Very Close". NPR. Retrieved February 2, 2021.
- Kilgore, Ed (September 1, 2020). "An Election Night 'Red Mirage' Is a Nightmare for Democrats". Intelligencer. MSN. Retrieved February 2, 2021.
- Rakich, Nathaniel; Mejía, Elena (October 30, 2020). "When To Expect Election Results In Every State". FiveThirtyEight. Illustrations by David Huang. Retrieved February 2, 2021.
- "FiveThirtyEight on Twitter: "We just got more than 70,000 votes in Maricopa County, Arizona, and Trump won them just 53% to 44%. We estimate there are about 171,000 ballots left to be counted in Arizona. If so, Trump would need to win 59% of them to overtake Biden."". Twitter. November 6, 2020. Retrieved February 2, 2021.
- "Nearly 70,000 ballots in Arizona could change state of presidential race". Today Show. MSN. November 7, 2020. Retrieved February 2, 2021.
- Sandler, Rachel (November 6, 2020). "Trump Whittles Biden's Lead In Arizona To Less Than 30,000 Votes". Forbes. Retrieved February 2, 2021.
- @decisiondeskhq (November 12, 2020). "Decision Desk HQ Projects Biden (D) Has Won The State Of AZ And Its 11 Electoral Votes Race Called At 10:29 PM EST All Results:" (Tweet). Retrieved November 12, 2020 – via Twitter.
- "Maddow Blog on Twitter: "NBC News projects Joe Biden the winner of Arizona's 11 electoral votes."". Twitter. November 12, 2020.
- "CNN on Twitter: "CNN PROJECTION: President-elect Joe Biden wins Arizona, widening his electoral vote lead over Donald Trum #CNNElection"". Twitter. November 12, 2020.
- "Mike Baker on Twitter: "The New York Times and CNN have both called Arizona for Biden, bringing his total to 290 electoral votes. Georgia and North Carolina remain."". Twitter. November 12, 2020.
- "Objection to counting Arizona electoral votes" (PDF). CNN. January 6, 2020.
- Wagner, Meg; Macaya, Melissa; Hayes, Mike; Mahtani, Melissa; Rocha, Veronica; Alfonso, Fernado III (January 6, 2021). "Rioters breach Capitol as Congress certifies Biden's win". CNN. Archived from the original on January 6, 2021. Retrieved February 2, 2021.
- "Roll Call 10 Roll Call 10, MOTION, 117th Congress, 1st Session". Office of the Clerk, U.S. House of Representatives. January 6, 2021. Retrieved February 2, 2021.
- Parks, Miles (January 6, 2021). "Some Republican Senators Walk Back Objections To Election Results". NPR. Retrieved February 2, 2021.
- Polletta, Maria; Oxford, Andrew (November 9, 2020). "Republican challenge to Maricopa County election involves fewer than 200 ballots, attorneys say". Arizona Republic. Retrieved November 11, 2020.
- Polletta, Maria (November 10, 2020). "Judge rejects Trump team's request for secret evidence in lawsuit over Maricopa County votes". Arizona Republic. Retrieved November 12, 2020.
- Thomas, David (November 11, 2020). "Snell & Wilmer withdraws from election lawsuit as Trump contests Arizona results". Reuters. Retrieved November 12, 2020.
- Sherman, Jon; Vallejo, Justin (November 12, 202). "US election results – live: Trump's law firm pulls out in Arizona, amid claims president knows fight is over". The Independent. Retrieved November 12, 2020.
- "Joe Biden will win Arizona: AG Mark Brnovich". Fox Business. November 11, 2020. Retrieved November 12, 2020.
- Mangan, Dan (November 11, 2020). "'Very, highly unlikely' Trump wins Arizona, no evidence of fraud, Republican state attorney general says". CNBC. Retrieved November 13, 2020.
- Scannell, Kara (November 13, 2020). "Trump campaign drops Arizona lawsuit requesting review of ballots". CNN.
- EST, Brendan Cole On 11/13/20 at 4:45 AM (November 13, 2020). "Joe Biden becomes first Democrat to win Arizona's Maricopa County since Truman". Newsweek.
- "Arizona Election Results". November 3, 2020 – via NYTimes.com.
- "2019 Arizona Revised Statutes :: Title 16 - Elections and Electors :: § 16-661 Automatic recount; requirements; exemption". Justia Law. Retrieved December 14, 2020.
- "Matt Gaetz on Twitter: "Imagine how AZ would look today without a deeply unpopular Republican Governor and a Martha McSally who was such an enduring drag on the ticket that she handed not one but two senate seats to the Democrats."". Twitter. November 4, 2020. Retrieved February 5, 2021.
- "State of Arizona Official Canvass" (PDF). Arizona Secretary of State. November 2020.
- Garrison, Joey (November 13, 2020). "Trump baselessly claims voter fraud in cities, but suburbs actually lost him the election". USA Today. Retrieved February 4, 2021.
- "Presidential Results by Congressional District, 2000-2008". Swing State Project. Retrieved February 4, 2021.
- Cohen, Max; Choi, Matthew (August 27, 2020). "Bush, McCain and Romney presidential staffers unite behind effort to elect Joe Biden". Politico. Retrieved February 1, 2021.
- Goldiner, Dave (December 5, 2020). "Trump targets 25 'RINO's' in Congress who admit he lost election". New York Daily News. Retrieved February 4, 2021.
- Luscombe, Richard (January 16, 2012). "'It's not their party any more': Trump leaves Republicans deeply fractured". The Guardian. Retrieved February 1, 2021.
- Ortega, Bob (December 19, 2020). "Arizona Republicans worry party infighting could harm them in future elections". CNN. Retrieved February 1, 2021.
- Crowley, James (February 29, 2020). "Donald Trump calls Mitt Romney a "low life," criticizes him for not sticking with Republicans on impeachment vote". Newsweek. Retrieved February 1, 2021.
- Choi, David; Sheth, Sonam (September 3, 2020). "Report says Trump called John McCain a 'f---ing loser' and said 'we're not going to support that loser's funeral'". Business Insider. MSN. Retrieved February 1, 2021.
- Evon, Dan (September 4, 2020). "Did Trump Call McCain a Loser?". Snopes. Retrieved February 1, 2021.
- Merica, Dan (November 13, 2020). "Biden carries Arizona, flipping a longtime Republican stronghold". CNN. Retrieved February 1, 2021.
- Siese, April (September 23, 2020). "Cindy McCain endorses Joe Biden: "There's only one candidate in this race who stands up for our values"". CBS News. Retrieved February 1, 2021.
- Sanchez, Yvonne Wingett (August 18, 2020). "Cindy McCain talks about John McCain's friendship with Joe Biden in Democratic National Convention video". The Arizona Republic. Retrieved February 1, 2021.
- Cunningham, Meg (September 22, 2020). "Democrats in Arizona appealing to moderates as state's demographics continue to change". ABC News. Retrieved February 5, 2021.
- Bennett, Brian; Berenson, Tessa (November 7, 2020). "How Donald Trump Lost The Election". Time. Retrieved February 4, 2021.
Trump lost Arizona, according to the Associated Press, after feuding with the state’s favorite son, the late Republican Senator John McCain.
- Ismail, Aymann (January 25, 2021). "How a Local Reporter Saw Arizona Falling Apart for Trump". Slate. Retrieved February 4, 2021.
- Siders, David; Arkin, James (January 16, 2021). "Trump blows up the Arizona GOP on his way out". Politico. Retrieved February 4, 2021.
- "Why don't Latinos vote?". The Economist. November 5, 2018. ISSN 0013-0613. Retrieved February 5, 2021.
If Hispanic voting does increase, Democrats have much to gain. The Economist’s weekly survey with YouGov, a polling firm, finds that two-thirds of Latinos support Democratic candidates in the mid-terms.
- Gonzalez-Barrera, Ana; Krogstad, Jens Manual; Noe-Bustamante, Noe (February 11, 2020). "Path to legal status for the unauthorized is top immigration policy goal for Hispanics in U.S." Pew Research Center. Retrieved February 5, 2021.
- Miroff, Nick; Sacchetti, Maria; Hauslohner, Abigail; Hernández, Arelis R. (December 2, 2020). "Biden's policies on immigration". The Washington Post. Retrieved February 5, 2021.
- Jordan, Miriam (January 27, 2021). "The Reality Behind Biden's Plan to Legalize 11 Million Immigrants". The New York Times. ISSN 0362-4331. Retrieved February 5, 2021.
- Menendez, Alicia (February 3, 2021). "Trump won on immigration fears. Don't give him a second chance". MSNBC. NBC. Retrieved February 5, 2021.
- "2016 election results: Arizona Exit polls". CNN. November 11, 2016. Retrieved February 5, 2021.
- "2019 ACS Demographic and Housing 5-Year Estimates". United States Census Bureau. Archived from the original on February 5, 2021. Retrieved February 5, 2021.
- "2019 ACS Demographic and Housing 5-Year Estimates". United States Census Bureau. Archived from the original on February 5, 2021. Retrieved February 5, 2021.
- "Presidential Election Results: Biden Wins". The New York Times. ISSN 0362-4331. Retrieved February 5, 2021.
- Montanaro, Domenico; Jin, Connie Hanzhang (November 18, 2020). "How Biden Won: Ramping Up The Base And Expanding Margins In The Suburbs". NPR. Retrieved November 27, 2020.
- Soto, Liliana (November 10, 2020). "Democrat or Republican, the power of the Latino vote in Arizona is here to stay". KNXV. Retrieved November 27, 2020.
- Fonseca, Felicia; Kastanis, Angeliki (November 19, 2020). "Native American votes helped secure Biden's win in Arizona". Associated Press. Retrieved November 27, 2020.
- Sabetta, Lauren (November 30, 2020). "How the Navajo Nation helped Joe Biden win Arizona". Chicago Monitor. Retrieved February 5, 2021.
- Park, Alice; Smart, Charlie; Taylor, Rumsey; Watkins, Miles (February 2, 2021). "An Extremely Detailed Map of the 2020 Election". The New York Times. ISSN 0362-4331. Retrieved February 5, 2021.
- "U.S. Census website". United States Census Bureau. Retrieved February 5, 2021.
- Polletta, Maria (November 24, 2020). "Gov. Doug Ducey: 'Joe Biden did win Arizona'". USA Today.
- Cillizza, Chris (December 1, 2020). "How Doug Ducey totally shut down the President's voter fraud claims". CNN. MSN. Retrieved February 4, 2021.
- Braine, Theresa (January 11, 2021). "Meghan McCain slams Arizona county GOP for censuring her mother over Biden support". New York Daily News. MSN. Retrieved February 4, 2021.
- Lah, Kyung (January 24, 2021). "Arizona GOP censures Cindy McCain, Jeff Flake and Doug Ducey, signaling a fractured party in a key swing state". CNN. MSN. Retrieved February 4, 2021.
- Greenwood, Max (January 26, 2021). "State-level Republicans wracked by division after Trump's loss". The Hill. Retrieved February 4, 2021.
Further reading
- Summary: State Laws on Presidential Electors (PDF), Washington DC: National Association of Secretaries of State, August 2020,
Arizona
- "Democrats eye Arizona, Georgia and Texas as potentially winnable", Theguardian.com, UK, September 5, 2020
- David Wasserman (October 6, 2020), "The 10 Bellwether Counties That Show How Trump Is in Serious Trouble", Nytimes.com. (describes bellwether Maricopa County, Arizona)
- Samara Klar; Christopher Weber (October 15, 2020), "Why Would a Republican Vote Biden? Ask Arizonans", New York Times
- Jazmine Ulloa (October 18, 2020), "In Arizona, the pandemic's economic pain could help Biden flip a red state blue", Boston Globe
External links
- Government Documents Round Table of the American Library Association, "Arizona", Voting & Elections Toolkits
- "Arizona: Election Tools, Deadlines, Dates, Rules, and Links", Vote.org, Oakland, CA
- "League of Women Voters of Arizona". (state affiliate of the U.S. League of Women Voters)