2020 United States presidential election in Massachusetts
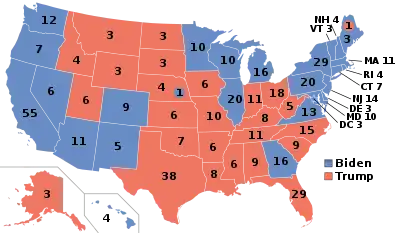
The 2020 United States presidential election in Massachusetts was held on Tuesday, November 3, 2020, as part of the 2020 United States presidential election in which all 50 states plus the District of Columbia participated.[2] Massachusetts voters chose electors to represent them in the Electoral College via a popular vote, pitting the Republican Party's nominee, incumbent President Donald Trump, and running mate Vice President Mike Pence against Democratic Party nominee, former Vice President Joe Biden, and his running mate California Senator Kamala Harris. Massachusetts has 11 electoral votes in the Electoral College.[3]
| ||||||||||||||||||||||||||
| Turnout | 76%[1] | |||||||||||||||||||||||||
|---|---|---|---|---|---|---|---|---|---|---|---|---|---|---|---|---|---|---|---|---|---|---|---|---|---|---|
| ||||||||||||||||||||||||||
 County results
Biden 50–60% 60–70% 70–80% 80–90%
| ||||||||||||||||||||||||||
 Municipal results | ||||||||||||||||||||||||||
| ||||||||||||||||||||||||||
.jpg.webp)
| 2020 Massachusetts general election |
| Election Day: Tuesday November 3, 2020 |
|---|
| Polls Open: 7 a.m. – 8 p.m. |
| Early Voting Open: October 17–30 |
| Voter ID: Not Required |
| Find Voting Precincts |
| Registration |
| Deadline: Saturday October 24 |
| Paper Form |
| Online Form |
| Check / Update Registration |
| Vote by Mail |
| No Excuse Needed |
| Application Deadline: Received by October 28 |
| Ballot Mailing Deadline: Received by 8 p.m. November 3 |
| Paper Form |
| Online Form |
| Find Drop Off Location |
| Track my Ballot |
| Electronic Voting |
| Electronic Voting: Not Available |
| Election Agency: Secretary of the Commonwealth |
| Elections in Massachusetts |
|---|
 |
Biden carried Massachusetts with a 33-point margin, the largest margin whereby any nominee had carried the state since 1964. Massachusetts was one of three states where Biden won every county, the other two being Rhode Island and Hawaii. It was the eighth election in a row that the Democratic candidate carried every single county in the state. It is also the highest percentage of the popular vote that a winning presidential candidate has received in the state since Lyndon B. Johnson won the state with over 70% of the vote back in 1964. It is also the second time that a presidential candidate has won Suffolk County with over 80% of the vote in presidential history after Lyndon B. Johnson won the county with over 80% of the vote back in 1964.[4] In addition, Biden won the following counties with the highest percentage of the popular vote that was seen for a Democratic presidential candidate in history: Barnstable County, Dukes County, and Nantucket County.
Massachusetts has consistently been amongst the bluest states in the nation since 1960, and this remained true in 2020, with Massachusetts being one of six states (along with Hawaii, Vermont, Maryland, California, and New York) that gave Biden over 60% of the vote. Massachusetts is ethnically diverse, highly urbanized, highly educated, and less religious. Per exit polls by the Associated Press, Biden's strength in Massachusetts came from college-educated voters, which he won with 74% of the vote, which carries particular weight in Massachusetts, as the state contains the highest proportion of graduates in the country.[5] Trump's slip among suburban voters led Biden to carry almost every municipality in the Greater Boston area by at least 60% or more, while Trump carried only several towns on the South Shore and in Central Massachusetts. Biden won 301 of the 351 municipalities.[6] Biden swept all demographic groups, garnering 61% with whites, 84% with Latinos, 58% with Catholics, and 86% with Jewish voters.[5] Trump had the worst vote share in Massachusetts of any Republican nominee since 1996, and slightly underperformed George W. Bush's 32.5% vote share in 2000.
Massachusetts was one of sixteen states where President Trump received less percentage of the vote than he did in the 2016 election.[lower-alpha 1]
Primary elections
Presidential preference primaries were scheduled for March 3, 2020, for each of the political parties with state ballot access.
Democratic primary
Bernie Sanders and Joe Biden were among the declared major Democratic candidates. Elizabeth Warren, one of the two current senators from Massachusetts, formed an exploratory committee in December 2018 and declared her intention to run in February 2019.[7][8]
| Candidate | Votes | % | Delegates[10] |
|---|---|---|---|
| Joe Biden | 473,861 | 33.41 | 45 |
| Bernie Sanders | 376,990 | 26.58 | 30 |
| Elizabeth Warren | 303,864 | 21.43 | 16 |
| Michael Bloomberg | 166,200 | 11.72 | |
| Pete Buttigieg (withdrawn†) | 38,400 | 2.71 | |
| Amy Klobuchar (withdrawn†) | 17,297 | 1.22 | |
| Tulsi Gabbard | 10,548 | 0.74 | |
| Deval Patrick (withdrawn) | 6,923 | 0.49 | |
| Tom Steyer (withdrawn†) | 6,762 | 0.48 | |
| Andrew Yang (withdrawn) | 2,708 | 0.19 | |
| Michael Bennet (withdrawn) | 1,257 | 0.09 | |
| John Delaney (withdrawn) | 675 | 0.05 | |
| Marianne Williamson (withdrawn) | 617 | 0.04 | |
| Cory Booker (withdrawn) | 426 | 0.03 | |
| Julian Castro (withdrawn) | 305 | 0.02 | |
| No Preference | 5,345 | 0.38 | |
| Blank ballots | 4,061 | 0.29 | |
| All Others | 1,941 | 0.14 | |
| Total | 1,418,180 | 100% | 91 |
Republican primary
Massachusetts governor Charlie Baker declined to run, as did former Massachusetts governor and Utah senator Mitt Romney.[11][12][13][14]
| 2020 Massachusetts Republican presidential primary[15] | |||
|---|---|---|---|
| Candidate | Popular vote | Delegates | |
| Count | Percentage | ||
| 239,115 | 86.32 | 41 | |
| Bill Weld | 25,425 | 9.18 | 0 |
| Joe Walsh (withdrawn) | 3,008 | 1.09 | 0 |
| Rocky De La Fuente | 675 | 0.24 | 0 |
| No Preference | 4,385 | 1.58 | 0 |
| Blank ballots | 2,242 | 0.81 | 0 |
| All Others | 2,152 | 0.78 | 0 |
| Total | 277,002 | 100% | 41 |
Libertarian primary
A number of Libertarian candidates declared for the race, including New Hampshire State Representative Max Abramson, Adam Kokesh, Vermin Supreme and former Libertarian National Committee vice-chair Arvin Vohra.[16][17][18]

| Massachusetts Libertarian presidential primary, March 3, 2020 [19] | ||
|---|---|---|
| Candidate | Votes | Percentage |
| Vermin Supreme | 398 | 10.4% |
| Jacob Hornberger | 369 | 9.6% |
| Blank | 324 | 7.8% |
| Dan Behrman | 294 | 7.7% |
| Kim Ruff (withdrawn) | 224 | 5.8% |
| Arvin Vohra | 151 | 3.9% |
| Ken Armstrong | 145 | 3.8% |
| Jo Jorgensen | 141 | 3.4% |
| Sam Robb | 127 | 3.1% |
| Adam Kokesh | 125 | 3% |
| Max Abramson | 98 | 2.4% |
| All others | 958 | 23% |
| No Preference | 804 | 21% |
| Total | 4,158 | 100% |
Green primary
| Massachusetts Green Party presidential primary, March 3, 2020 [20] | |||
|---|---|---|---|
| Candidate | Votes | Percentage | National delegates |
| Dario Hunter | 224 | 16.9 | 2 |
| Howie Hawkins | 217 | 16.4 | 1 |
| Sedinam Kinamo Christin Moyowasifza-Curry | 141 | 10.6 | 1 |
| Kent Mesplay | 55 | 4.1 | 0 |
| David Rolde | 4 | 0.3 | 0 |
| Write-In | 369 | 27.8 | 0 |
| No Preference | 316 | 23.8 | 7 |
| Total | 1326 | 100.00% | 11 |
General election
Predictions
| Source | Ranking | As of |
|---|---|---|
| The Cook Political Report[21] | Safe D | September 10, 2020 |
| Inside Elections[22] | Safe D | September 4, 2020 |
| Sabato's Crystal Ball[23] | Safe D | July 14, 2020 |
| Politico[24] | Safe D | September 8, 2020 |
| RCP[25] | Safe D | August 3, 2020 |
| Niskanen[26] | Safe D | July 26, 2020 |
| CNN[27] | Safe D | August 3, 2020 |
| The Economist[28] | Safe D | September 2, 2020 |
| 270towin[29] | Safe D | August 2, 2020 |
| ABC News[30] | Safe D | July 31, 2020 |
| NBC News[31] | Safe D | August 6, 2020 |
| 538[32] | Safe D | September 9, 2020 |
Graphical summary
Aggregate polls
| Source of poll aggregation |
Dates administered |
Dates updated |
Joe Biden Democratic |
Donald Trump Republican |
Other/ Undecided [lower-alpha 2] |
Margin |
|---|---|---|---|---|---|---|
| 270 to Win | September 20 – October 21, 2020 | October 28, 2020 | 66.5% | 29.0% | 4.5% | Biden +37.5 |
| RealClearPolitics | July 31 – August 27, 2020 | September 15, 2020 | 64.0% | 28.3% | 7.7% | Biden +35.7 |
| FiveThirtyEight | until October 27, 2020 | October 28, 2020 | 65.7% | 29.1% | 5.2% | Biden +36.6 |
| Average | 65.4% | 28.8% | 5.8% | Biden +36.6 | ||
- Polls
| Poll source | Date(s) administered |
Sample size[lower-alpha 3] |
Margin of error |
Donald Trump Republican |
Joe Biden Democratic |
Jo Jorgensen Libertarian |
Howie Hawkins Green |
Other | Undecided |
|---|---|---|---|---|---|---|---|---|---|
| MassInc | Oct 23–30, 2020 | 929 (LV) | – | 28% | 62% | - | - | 8%[lower-alpha 4] | 2% |
| SurveyMonkey/Axios | Oct 1–28, 2020 | 5,848 (LV) | – | 28% | 70% | - | - | – | – |
| YouGov/UMass Amherst | Oct 14–21, 2020 | 713 (LV) | – | 29% | 64% | - | - | 3%[lower-alpha 5] | 3% |
| SurveyMonkey/Axios | Sep 1–30, 2020 | 2,655 (LV) | – | 32% | 66% | - | - | – | 2% |
| SurveyMonkey/Axios | Aug 1–31, 2020 | 2,286 (LV) | – | 29% | 69% | - | - | – | 2% |
| Emerson College/WHDH | Aug 25–27, 2020 | 763 (LV) | ± 3.5% | 31% | 69% | - | - | – | – |
| MassINC/WBUR | Aug 6–9, 2020 | 501 (LV) | ± 4.4% | 27% | 63% | - | - | 5%[lower-alpha 6] | 4% |
| UMass/YouGov | Jul 31 – Aug 7, 2020 | 500 (RV) | ± 5.9% | 28% | 61% | - | - | – | – |
| SurveyMonkey/Axios | Jul 1–31, 2020 | 2,509 (LV) | – | 26% | 72% | - | - | – | 2% |
| MassINC | Jul 17–20, 2020 | 797 (RV) | – | 23% | 55% | - | - | 10%[lower-alpha 7] | 12% |
| SurveyMonkey/Axios | Jun 8–30, 2020 | 1,091 (LV) | – | 27% | 71% | - | - | – | 2% |
| Emerson College/7 News | May 4–5, 2020 | 740 (RV) | ± 3.5% | 33%[lower-alpha 8] | 67% | - | - | – | – |
| University of Massachusetts Lowell/YouGov | Apr 27 – May 1, 2020 | 1,000 (RV) | ± 3.6% | 30% | 58% | - | - | 7%[lower-alpha 9] | 4% |
| Emerson College | Apr 4–7, 2019 | 761 (RV) | ± 3.5% | 31% | 69% | - | - | – | – |
Former candidates | ||||||||||||||||||||||||||||
|---|---|---|---|---|---|---|---|---|---|---|---|---|---|---|---|---|---|---|---|---|---|---|---|---|---|---|---|---|
|
Results
| Party | Candidate | Votes | % | ±% | |
|---|---|---|---|---|---|
| Democratic | Joe Biden Kamala Harris |
2,382,202 | 65.60% | +4.62% | |
| Republican | Donald Trump Mike Pence |
1,167,202 | 32.14% | -1.20% | |
| Libertarian | Jo Jorgensen Spike Cohen |
47,013 | 1.29% | -2.93% | |
| Green | Howie Hawkins Angela Walker |
18,658 | 0.51% | -0.95% | |
| Write-in | 16,327 | 0.45% | |||
| Total votes | 3,631,402 | 100.00% | 1.49% | ||
By county
| County | Joseph R. Biden | Donald J. Trump | Jo Jorgensen | Howie Hawkins | Total votes cast | ||
|---|---|---|---|---|---|---|---|
| # | % | # | % | # | # | ||
| Barnstable | 91,994 | 60.72% | 55,311 | 36.50% | 1,856 | 638 | 151,512 |
| Berkshire | 51,705 | 72.04% | 18,064 | 25.17% | 927 | 465 | 71,771 |
| Bristol | 153,377 | 54.51% | 119,872 | 42.60% | 3,667 | 1,427 | 281,364 |
| Dukes | 9,914 | 77.04% | 2,631 | 20.44% | 138 | 82 | 12,873 |
| Essex | 267,198 | 62.93% | 144,837 | 34.11% | 5,356 | 1,899 | 424,599 |
| Franklin | 30,030 | 69.83% | 11,201 | 26.05% | 692 | 380 | 43,003 |
| Hampden | 125,948 | 57.04% | 87,318 | 39.54% | 2,971 | 1,166 | 220,793 |
| Hampshire | 63,362 | 71.73% | 22,281 | 25.22% | 1,086 | 768 | 88,332 |
| Middlesex | 617,196 | 71.00% | 226,956 | 26.11% | 10,649 | 4,484 | 869,347 |
| Nantucket | 5,241 | 71.42% | 1,914 | 26.08% | 81 | 41 | 7,338 |
| Norfolk | 273,312 | 66.49% | 125,294 | 30.48% | 5,191 | 1,753 | 411,042 |
| Plymouth | 173,630 | 57.14% | 121,227 | 39.89% | 4,310 | 1,324 | 303,870 |
| Suffolk | 270,522 | 80.22% | 58,613 | 17.38% | 2,959 | 1,695 | 337,240 |
| Worcester | 248,773 | 57.20% | 171,683 | 39.47% | 7,130 | 2,536 | 434,921 |
By congressional district
| District | Trump | Biden | Representative |
|---|---|---|---|
| 1st | 37% | 61% | Richard Neal |
| 2nd | 36% | 62% | Jim McGovern |
| 3rd | 35% | 63% | Lori Trahan |
| 4th | 34% | 65% | Joe Kennedy III |
| Jake Auchincloss | |||
| 5th | 24% | 75% | Katherine Clark |
| 6th | 36% | 63% | Seth Moulton |
| 7th | 13% | 85% | Ayanna Pressley |
| 8th | 32% | 66% | Stephen Lynch |
| 9th | 40% | 58% | Bill Keating |
See also
Notes
- The other fifteen states were Alabama, Connecticut, Delaware, Georgia, Kentucky, Maine, Maryland, Mississippi, Nebraska, New Hampshire, New Jersey, Rhode Island, Tennessee, Texas and Virginia.
- Calculated by taking the difference of 100% and all other candidates combined.
- Key:
A – all adults
RV – registered voters
LV – likely voters
V – unclear - "Some other candidate" with 5%; "Refused" with 3%; would not vote with no voters
- "Other" with 3%; would not vote with 0%
- "Another candidate" with 2%; "Refused" with 3%
- "Some other candidate" with 7%; would not vote with 3%
- Including voters who lean towards a given candidate
- "Another candidate" with 7%
References
- "MA SOC Voter Turnout Statistics".
- Kelly, Ben (August 13, 2018). "US elections key dates: When are the 2018 midterms and the 2020 presidential campaign?". The Independent. Retrieved January 3, 2019.
- "Distribution of Electoral Votes". National Archives and Records Administration. Retrieved January 3, 2019.
- "Massachusetts Election Results 2020". Politico. November 21, 2020.
- "Massachusetts Voter Surveys: How Different Groups Voted". The New York Times. November 3, 2020. ISSN 0362-4331. Retrieved November 9, 2020.
- "Map: See How Your Town Or City Voted In The 2020 Election". www.wbur.org. Retrieved November 15, 2020.
- Taylor, Kate (February 9, 2019). "Elizabeth Warren Formally Announces 2020 Presidential Bid in Lawrence, Mass". The New York Times. Retrieved February 10, 2019.
- Herndon, Astead W.; Burns, Alexander. "Elizabeth Warren Announces Iowa Trip as She Starts Running for President in 2020".
- "2020 President Democratic Primary". Mass.gov. Secretary of the Commonwealth of Massachusetts. Archived from the original on April 9, 2020. Retrieved April 9, 2020.
- "2020 Presidential Primaries, Caucuses, and Conventions: Massachusetts Democrat". Retrieved July 4, 2020.
- Markos, Mary (November 8, 2018). "Charlie Baker 'absolutely' staying put". Boston Herald. Retrieved November 9, 2018.
- Burr, Thomas (February 16, 2018). "Mitt Romney: On school shootings, immigration and when he'll challenge Trump. A Q&A with Utah's new Senate candidate". The Salt Lake Tribune. Retrieved February 18, 2018.
- Heilbrunn, Jacob (January 2, 2018). "Donald Trump's Biggest Fear: A Romney 2020 Primary Challenge". The National Interest. Retrieved January 2, 2018.
- Keller, Jon (January 2, 2018). "Keller @ Large: Could Romney Be Trump's Worst Nightmare?". WBZ-TV. Retrieved January 2, 2018.
- "2020 President Republican Primary". Mass.gov. Secretary of the Commonwealth of Massachusetts. Archived from the original on April 9, 2020. Retrieved April 9, 2020.
- Sullivan, Max (July 28, 2019). "Seabrook's Abramson seeks Libertarian presidential nomination". The Portsmouth Herald. Retrieved December 22, 2019.
- Limitone, Julia (June 18, 2019). "Presidential candidate vows to abolish federal government on day 1, then resign". Fox Business. Retrieved December 22, 2019.
- Clark, Bob (November 12, 2019). "Libertarians Offer Voters Nothing New". Olean Times Herald. Retrieved December 22, 2019.
- "Massachusetts Election Statistics: 2020 Libertarian Primary". Massachusetts Secretary of State. March 3, 2020.
- https://electionstats.state.ma.us/elections/view/135904/
- "2020 POTUS Race ratings" (PDF). The Cook Political Report. Retrieved May 21, 2019.
- "POTUS Ratings | Inside Elections". insideelections.com. Retrieved May 21, 2019.
- "Larry J. Sabato's Crystal Ball » 2020 President". crystalball.centerforpolitics.org. Retrieved May 21, 2019.
- "2020 Election Forecast". Politico. November 19, 2019.
- "Battle for White House". RCP. April 19, 2019.
- 2020 Bitecofer Model Electoral College Predictions, Niskanen Center, March 24, 2020, retrieved: April 19, 2020.
- David Chalian; Terence Burlij. "Road to 270: CNN's debut Electoral College map for 2020". CNN. Retrieved June 16, 2020.
- "Forecasting the US elections". The Economist. Retrieved July 7, 2020.
- "2020 Presidential Election Interactive Map". 270 to Win.
- "ABC News Race Ratings". CBS News. July 24, 2020. Retrieved July 24, 2020.
- "Biden dominates the electoral map, but here's how the race could tighten". NBC News. Retrieved August 6, 2020.
- "2020 Election Forecast". FiveThirtyEight. Retrieved August 14, 2020.
- "2020 President General Election". Massachusetts Secretary of State. Retrieved November 24, 2020.
Further reading
- Summary: State Laws on Presidential Electors (PDF), Washington DC: National Association of Secretaries of State, August 2020,
Massachusetts
- "A farmer made a giant Biden-Harris sign out of hay bales. It was set on fire the next day", Washingtonpost.com, October 12, 2020. (About incident in Dalton, Massachusetts)
External links
- Government Documents Round Table of the American Library Association, "Massachusetts", Voting & Elections Toolkits
- "Massachusetts: Election Tools, Deadlines, Dates, Rules, and Links", Vote.org, Oakland, CA
- "League of Women Voters of Massachusetts". (state affiliate of the U.S. League of Women Voters)
- Massachusetts at Ballotpedia