2020 United States presidential election in Alabama
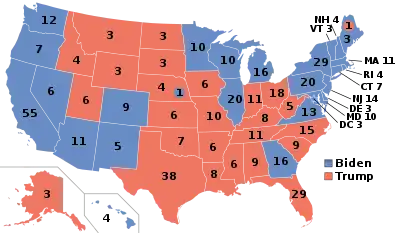
The 2020 United States presidential election in Alabama took place on Tuesday, November 3, 2020, as part of the 2020 United States presidential election in which all 50 states and the District of Columbia participated.[1] Alabama voters chose nine electors[2] to represent them in the Electoral College via a popular vote pitting incumbent Republican President Donald Trump and his running mate, incumbent Vice President Mike Pence, against Democratic challenger and former Vice President Joe Biden and his running mate, United States Senator Kamala Harris of California. Also on the ballot was the Libertarian nominee, psychology lecturer Jo Jorgensen and her running mate, entrepreneur and podcaster Spike Cohen. Write-in candidates were permitted without registration, and their results were not individually counted.[3][4]
| ||||||||||||||||||||||||||
| Turnout | 63.1% | |||||||||||||||||||||||||
|---|---|---|---|---|---|---|---|---|---|---|---|---|---|---|---|---|---|---|---|---|---|---|---|---|---|---|
| ||||||||||||||||||||||||||
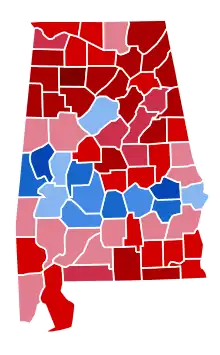 County results
| ||||||||||||||||||||||||||
| ||||||||||||||||||||||||||
.jpg.webp)
| Elections in Alabama |
|---|
 |
|
|
Prior to the election, all 14 news organizations making predictions considered this a state Trump would win, or otherwise a safe red state. In 2016, Trump won Alabama by a 27.72% margin,[5] the largest margin for any candidate in Alabama since Richard Nixon's 46.89% margin in 1972. In 2020, Trump won the state with 62.03% of the vote to Biden's 36.57%, a margin of 25.46%,[6] with Biden improving on Hillary Clinton's 2016 loss by 2.26%. This was the fifth election in a row in which the Republican nominee won over 60% of the vote in Alabama.[7] A socially conservative Bible Belt state, Alabama has voted for the Republican candidate in every election since 1980 and has done so by double-digit margins except in all of them except 1980, 1992, and 1996. The last time a Democratic nominee won the state was when fellow Southerner Jimmy Carter carried it in 1976, and it has not even given 40% of the vote to the Democratic nominee since 2000.
Biden's biggest victories were in Jefferson County, home to the Yellowhammer State's largest city of Birmingham, and Montgomery County, which encompasses the state capital of Montgomery. In addition, he easily won all 12 Black Belt counties. However, these victories were offset by Trump's landslide wins among white evangelicals in the suburbs and rural areas, as well as all other major cities including Mobile, Huntsville, Alabaster, and Tuscaloosa. Barbour and Conecuh counties, both of which voted for Democrat Barack Obama in 2012 but switched to the Republican column in 2016 remained there this year. Alabama weighed in as 29.91 percentage points more Republican than the national average in 2020.
Alabama was one of seventeen states where Trump received less percentage of the vote than he did in the 2016 presidential election.[lower-alpha 1] This election also marked the first time since 1992 that Alabama and neighboring Georgia did not vote for the same presidential candidate.
Primary elections
The primary elections were held on Super Tuesday, March 3, 2020.
Republican primary
As one of the Super Tuesday states, little campaigning has been done here, and the focus had been on the highly competitive Republican senatorial primary, which was expected to boost turnout.
Former Massachusetts Governor William Weld challenged incumbent president Donald Trump in the Republican primary in Alabama.[8] Trump received 96.22% of the vote[9] and all 50 delegates,[10] while Bill Weld received only 1.52% of the vote. Uncommitted votes made up the other 2.27%.
| 2020 Alabama Republican presidential primary[9] | |||
|---|---|---|---|
| Candidate | Popular vote | Delegates[10] | |
| Count | Percentage | ||
| 695,470 | 96.22% | 50 | |
| Bill Weld | 10,962 | 1.52% | 0 |
| Uncommitted | 16,378 | 2.27% | 0 |
| Total | 722,809 | 100% | 50 |
Democratic primary
Joe Biden's victory in Alabama was near-guaranteed. Four years earlier, Hillary Clinton carried the state with 77.84% against Bernie Sanders and won every county and congressional district, a feat repeated by Biden.[11] FiveThirtyEight, which made state-by-state predictions prior to the primaries, gave Biden a 92% chance at winning the Yellowhammer State, a landslide over Sanders' 5% chance.[12] Aggregate polling from FiveThirtyEight right before election day showed Biden up with 40.2%, Sanders at 18.4%, Bloomberg at 15.9%, Warren at 10.9%, Gabbard at 0.5%, and other/undecided 14.1%.[13] 270toWin had Biden ahead as well with 44.5% of support, 23.5 percentage points ahead of Bernie Sanders at 21%.[14]
The week before, Biden swept the South Carolina primary by a 28.88% margin over Sanders, reviving Biden's candidacy after crushing losses in Iowa, New Hampshire, and Nevada.[15] Additionally, the moderate wing of the primary, consisting of former South Bend Mayor Pete Buttigieg, Senator Amy Klobuchar from Minnesota, representative Beto O'Rourke from Texas's 16th district, and Senator Kamala Harris from California coalesced behind and endorsed Biden while the progressive wing, consisting of Senators Sanders and Warren, remained fractured.[16][17][18][19][20] Thus, right before Super Tuesday, Biden's support surged.
As with most states in the American South, the majority – 49% – of Alabama's Democratic electorate is African American, and these voters backed Biden with 72% per exit polls by CNN.[21] Biden's best performance, regionally, was in the Black Belt, a historically Democratic region due to high proportions of African Americans, which is attributable to the prominence of slavery in this region before emancipation. He carried the Birmingham/South Central region with 68%, and this region comprises 44% of the Democratic electorate in the state. Biden won voters 45 to 64 with 67% and those older than 65 with 78%. He also won all education groups, ideologies, and party affiliations.%252C_2020.svg.png.webp)
| Candidate | Votes | % | Delegates[23] |
|---|---|---|---|
| Joe Biden | 286,065 | 63.28 | 44 |
| Bernie Sanders | 74,755 | 16.54 | 8 |
| Michael Bloomberg | 52,750 | 11.67 | 0 |
| Elizabeth Warren | 25,847 | 5.72 | 0 |
| Michael Bennet (withdrawn) | 2,250 | 0.50 | 0 |
| Pete Buttigieg (withdrawn) | 1,416 | 0.31 | 0 |
| Tom Steyer (withdrawn) | 1,048 | 0.23 | 0 |
| Tulsi Gabbard | 1,038 | 0.23 | 0 |
| Amy Klobuchar (withdrawn) | 907 | 0.20 | 0 |
| Andrew Yang (withdrawn) | 875 | 0.19 | 0 |
| Cory Booker (withdrawn) | 740 | 0.16 | 0 |
| John Delaney (withdrawn) | 294 | 0.07 | 0 |
| Marianne Williamson (withdrawn) | 224 | 0.05 | 0 |
| Julian Castro (withdrawn) | 184 | 0.04 | 0 |
| Uncommitted | 3,700 | 0.82 | 0 |
| Total | 452,093 | 100% | 52 |
General election
Predictions
| Source | Ranking | As of |
|---|---|---|
| The Cook Political Report[24] | Safe R | November 3, 2020 |
| Inside Elections[25] | Safe R | November 3, 2020 |
| Sabato's Crystal Ball[26] | Safe R | November 3, 2020 |
| Politico[27] | Safe R | November 3, 2020 |
| RCP[28] | Safe R | November 3, 2020 |
| Niskanen[29][30] | Safe R | November 3, 2020 |
| CNN[31] | Safe R | November 3, 2020 |
| The Economist[32] | Safe R | November 3, 2020 |
| CBS News[33][lower-alpha 2] | Likely R | November 3, 2020 |
| 270towin[34] | Safe R | November 3, 2020 |
| ABC News[35] | Safe R | November 3, 2020 |
| NPR[36][lower-alpha 3] | Likely R | November 3, 2020 |
| NBC News[37] | Safe R | November 3, 2020 |
| 538[38] | Safe R | November 3, 2020 |
Polling
- Graphical summary
Aggregate polls
| Source of poll aggregation |
Dates administered |
Dates updated |
Joe Biden Democratic |
Donald Trump Republican |
Other/ Undecided [lower-alpha 4] |
Margin |
|---|---|---|---|---|---|---|
| 270 to Win | September 1 – October 13, 2020 | October 27, 2020 | 38.0% | 58.0% | 4.0% | Trump +20.0 |
| FiveThirtyEight | until October 25, 2020 | October 27, 2020 | 38.5% | 56.8% | 4.7% | Trump +18.3 |
| Average | 38.3% | 57.4% | 4.3% | Trump +19.1 | ||
- Polls
| Poll source | Date(s) administered |
Sample size[lower-alpha 5] |
Margin of error |
Donald Trump Republican |
Joe Biden Democratic |
Jo Jorgensen Libertarian |
Other | Undecided |
|---|---|---|---|---|---|---|---|---|
| SurveyMonkey/Axios | Oct 20 – Nov 2, 2020 | 1,808 (LV) | ± 3.5% | 62%[lower-alpha 6] | 36% | – | – | – |
| Swayable | Oct 27 – Nov 1, 2020 | 330 (LV) | ± 7.9% | 55% | 38% | 7% | – | – |
| Data for Progress | Oct 27 – Nov 1, 2020 | 1,045 (LV) | ± 3% | 58% | 38% | 3% | 1% | 0%[lower-alpha 7] |
| Auburn University At Montgomery | Oct 23–28, 2020 | 853 (LV) | ± 4.4% | 58% | 39% | – | 3% | – |
| SurveyMonkey/Axios | Oct 1–28, 2020 | 3,363 (LV) | – | 61% | 37% | – | – | – |
| Swayable | Oct 23–26, 2020 | 266 (LV) | ± 7.8% | 56% | 37% | 7% | – | – |
| Moore Information (R)[upper-alpha 1] | Oct 11–14, 2020 | 504 (LV) | ± 4.5% | 55% | 38% | – | – | – |
| Auburn University at Montgomery | Sep 30 – Oct 3, 2020 | 1,072 (RV) | ± 4.0% | 57% | 37% | – | 6% | – |
| SurveyMonkey/Axios | Sep 1–30, 2020 | 1,354 (LV) | – | 59% | 39% | – | – | 2% |
| SurveyMonkey/Axios | Aug 1–31, 2020 | 1,220 (LV) | – | 65% | 33% | – | – | 2% |
| Tyson Group/Consumer Energy Alliance[upper-alpha 2] | Aug 17–19, 2020 | 600 (LV) | ± 4% | 48% | 44% | 0% | 0%[lower-alpha 8] | 7% |
| Morning Consult | Jul 24 – Aug 2, 2020 | 609 (LV) | ± 4.0% | 58% | 36% | – | 2%[lower-alpha 9] | 4% |
| SurveyMonkey/Axios | Jul 1–31, 2020 | 1,583 (LV) | – | 63% | 35% | – | – | 2% |
| Auburn University at Montgomery | Jul 2–9, 2020 | 567 (RV) | ± 5.1% | 55% | 41% | – | 4% | 1% |
| SurveyMonkey/Axios | Jun 8–30, 2020 | 649 (LV) | – | 63% | 35% | – | – | 2% |
| FM3 Research/Doug Jones[upper-alpha 3] | May 14–18, 2020 | 601 (LV) | ± 4% | 53% | 39% | – | – | – |
| Mason-Dixon | Feb 4–6, 2020 | 625 (RV) | ± 4% | 58% | 38% | – | – | 4% |
| WPA Intelligence | Jan 7–9, 2020 | 500 (LV) | – | 59% | 38% | – | – | 3% |
Former candidates | |||||||||||||||||||||||||||||||||||||||||||||||||||||||||||||||
|---|---|---|---|---|---|---|---|---|---|---|---|---|---|---|---|---|---|---|---|---|---|---|---|---|---|---|---|---|---|---|---|---|---|---|---|---|---|---|---|---|---|---|---|---|---|---|---|---|---|---|---|---|---|---|---|---|---|---|---|---|---|---|---|
|
Hypothetical polling | ||||||||||||||
|---|---|---|---|---|---|---|---|---|---|---|---|---|---|---|
|
Fundraising
According to the Federal Election Commission, in 2019 and 2020, Donald Trump and his interest groups raised $4,412,645.01,[39] Joe Biden and his interest groups raised $2,412,420.93,[40] and Jo Jorgensen raised $8,172.29[41] from Alabama-based contributors.
Candidate ballot access
- Donald John Trump / Michael Richard Pence, Republican
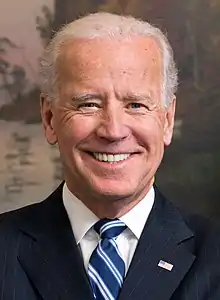
- Joseph Robinette Biden Jr. / Kamala Devi Harris, Democratic
- Jo Jorgensen / Jeremy "Spike" Cohen, Libertarian
In addition, write-in candidates were allowed without registration, and their votes were not counted individually.[3][4]
Electoral slates
Technically the voters of Alabama cast their ballots for electors, or representatives to the Electoral College, rather than directly for the President and Vice President. Alabama is allocated 9 electors because it has 7 congressional districts and 2 senators. All candidates who appear on the ballot or qualify to receive write-in votes must submit a list of 9 electors who pledge to vote for their candidate and their running mate. Whoever wins the most votes in the state is awarded all 9 electoral votes. Their chosen electors then vote for president and vice president. Although electors are pledged to their candidate and running mate, they are not obligated to vote for them. An elector who votes for someone other than their candidate is known as a faithless elector. In the state of Alabama, a faithless elector's vote is counted and not penalized.[42][43]
The electors of each state and the District of Columbia met on December 15, 2020, to cast their votes for president and vice president. All 9 pledged electors cast their votes for President Donald Trump and Vice President Mike Pence. The Electoral College itself never meets as one body. Instead, the electors from each state and the District of Columbia met in their respective capitols. The electoral vote was tabulated and certified by Congress in a joint session on January 6, 2021 per the Electoral Count Act.
These electors were nominated by each party in order to vote in the Electoral College should their candidate win the state:[44][45][46]
| Donald Trump and Mike Pence Republican Party |
Joe Biden and Kamala Harris Democratic Party |
Jo Jorgensen and Spike Cohen Libertarian Party |
|---|---|---|
| Jacquelyn Gay Jeana S. Boggs Joseph R. Fuller John H. Killian J. Elbert Peters Joan Reynolds Rick Pate Dennis H. Beavers John Wahl |
Brooke Tanner Battle Linda Coleman-Madison Earl Hilliard Jr. Sigfredo Rubio Lashunda Scales James Box Spearman Patricia Todd Sheila Tyson Ralph Young |
Pascal Bruijn Lorelei Koory Shane A. Taylor Jason Matthew Shelby Elijah J. Boyd Dennis J. Knizley Laura Chancey Lane Anthony G. Peebles Franklin R. Dillman |
Results
| Party | Candidate | Votes | % | ±% | |
|---|---|---|---|---|---|
| Republican | Donald Trump Mike Pence |
1,441,170 | 62.03% | −0.05% | |
| Democratic | Joe Biden Kamala Harris |
849,624 | 36.57% | +2.21% | |
| Libertarian | Jo Jorgensen Spike Cohen |
25,176 | 1.08% | −1.01% | |
| Write-in | 7,312 | 0.32% | −0.70% | ||
| Total votes | 2,323,282 | 100% | |||
By county
| County[6] | Donald Trump Republican |
Joe Biden Democratic |
Jo Jorgensen Libertarian |
Write-ins | Margin | Total votes | |||||
|---|---|---|---|---|---|---|---|---|---|---|---|
| Votes | % | Votes | % | Votes | % | Votes | % | Votes | % | Votes | |
| Autauga | 19,838 | 71.44% | 7,503 | 27.02% | 350 | 1.26% | 79 | 0.28% | 12,335 | 44.42% | 27,770 |
| Baldwin | 83,544 | 76.17% | 24,578 | 22.41% | 1,229 | 1.12% | 328 | 0.30% | 58,966 | 53.76% | 109,679 |
| Barbour | 5,622 | 53.54% | 4,816 | 45.79% | 68 | 0.65% | 12 | 0.11% | 806 | 7.75% | 10,518 |
| Bibb | 7,525 | 78.43% | 1,986 | 20.70% | 74 | 0.77% | 10 | 0.10% | 5,539 | 57.73% | 9,595 |
| Blount | 24,711 | 89.57% | 2,640 | 9.57% | 209 | 0.76% | 28 | 0.10% | 22,071 | 80.00% | 27,588 |
| Bullock | 1,146 | 24.84% | 3,446 | 74.70% | 19 | 0.41% | 2 | 0.04% | −2,300 | −49.86% | 4,613 |
| Butler | 5,458 | 57.53% | 3,965 | 41.79% | 59 | 0.62% | 6 | 0.06% | 1,493 | 15.74% | 9,488 |
| Calhoun | 35,101 | 68.85% | 15,216 | 29.85% | 553 | 1.08% | 113 | 0.22% | 19,885 | 39.00% | 50,983 |
| Chambers | 8,753 | 57.27% | 6,365 | 41.64% | 141 | 0.92% | 25 | 0.16% | 2,388 | 15.63% | 15,284 |
| Cherokee | 10,583 | 86.03% | 1,624 | 13.20% | 82 | 0.67% | 12 | 0.10% | 8,959 | 72.83% | 12,301 |
| Chilton | 16,085 | 83.30% | 3,073 | 15.91% | 123 | 0.64% | 29 | 0.15% | 13,012 | 67.39% | 19,310 |
| Choctaw | 4,296 | 57.77% | 3,127 | 42.05% | 38 | 0.51% | 3 | 0.04% | 1,169 | 15.72% | 7,437 |
| Clarke | 7,324 | 55.76% | 5,755 | 43.81% | 49 | 0.37% | 7 | 0.05% | 1,569 | 11.95% | 13,135 |
| Clay | 5,601 | 80.82% | 1,267 | 18.28% | 53 | 0.76% | 9 | 0.12% | 4,334 | 62.54% | 6,930 |
| Cleburne | 6,484 | 89.72% | 675 | 9.34% | 60 | 0.83% | 8 | 0.11% | 5,809 | 80.38% | 7,227 |
| Coffee | 16,899 | 75.87% | 5,076 | 22.79% | 264 | 1.19% | 36 | 0.16% | 11,823 | 53.08% | 22,275 |
| Colbert | 19,203 | 68.86% | 8,343 | 29.92% | 272 | 0.98% | 68 | 0.24% | 10,860 | 38.94% | 27,886 |
| Conecuh | 3,442 | 53.44% | 2,966 | 46.05% | 32 | 0.50% | 1 | 0.02% | 476 | 7.39% | 6,441 |
| Coosa | 3,631 | 66.27% | 1,796 | 32.78% | 46 | 0.84% | 6 | 0.11% | 1,835 | 33.49% | 5,479 |
| Covington | 14,586 | 83.68% | 2,721 | 15.61% | 97 | 0.56% | 26 | 0.15% | 11,865 | 68.07% | 17,430 |
| Crenshaw | 4,864 | 73.51% | 1,700 | 25.69% | 44 | 0.66% | 9 | 0.14% | 3,164 | 47.82% | 6,617 |
| Cullman | 36,880 | 88.12% | 4,478 | 10.70% | 418 | 1.00% | 75 | 0.18% | 32,402 | 77.42% | 41,851 |
| Dale | 14,303 | 72.46% | 5,170 | 26.19% | 233 | 1.18% | 32 | 0.16% | 9,133 | 46.27% | 19,738 |
| Dallas | 5,524 | 30.92% | 12,230 | 68.46% | 90 | 0.50% | 20 | 0.11% | −6,706 | −37.54% | 17,864 |
| DeKalb | 24,767 | 84.37% | 4,281 | 14.58% | 250 | 0.85% | 58 | 0.20% | 20,486 | 69.79% | 29,356 |
| Elmore | 30,164 | 73.52% | 10,367 | 25.27% | 398 | 0.97% | 101 | 0.25% | 19,797 | 48.25% | 41,030 |
| Escambia | 10,869 | 68.32% | 4,918 | 30.91% | 94 | 0.59% | 29 | 0.18% | 5,951 | 37.40% | 15,910 |
| Etowah | 35,528 | 74.43% | 11,567 | 24.24% | 531 | 1.11% | 102 | 0.21% | 23,961 | 50.19% | 47,728 |
| Fayette | 7,300 | 83.28% | 1,395 | 15.91% | 56 | 0.64% | 15 | 0.17% | 5,905 | 67.37% | 8,766 |
| Franklin | 10,376 | 82.49% | 2,086 | 16.58% | 106 | 0.84% | 10 | 0.08% | 8,290 | 65.91% | 12,578 |
| Geneva | 10,848 | 86.47% | 1,595 | 12.71% | 90 | 0.72% | 12 | 0.10% | 9,253 | 73.76% | 12,545 |
| Greene | 875 | 18.32% | 3,884 | 81.34% | 8 | 0.17% | 8 | 0.17% | −3,009 | −63.01% | 4,775 |
| Hale | 3,192 | 40.41% | 4,663 | 59.03% | 37 | 0.47% | 8 | 0.10% | −1,471 | −18.62% | 7,900 |
| Henry | 6,607 | 71.06% | 2,606 | 28.03% | 69 | 0.74% | 16 | 0.17% | 4,001 | 43.03% | 9,298 |
| Houston | 32,618 | 70.64% | 12,917 | 27.98% | 533 | 1.15% | 105 | 0.23% | 19,701 | 42.66% | 46,173 |
| Jackson | 19,670 | 83.22% | 3,717 | 15.73% | 208 | 0.88% | 41 | 0.17% | 15,953 | 67.49% | 23,636 |
| Jefferson | 138,843 | 42.61% | 181,688 | 55.76% | 3,578 | 1.10% | 1,739 | 0.53% | −42,845 | −13.15% | 325,848 |
| Lamar | 6,174 | 85.83% | 978 | 13.60% | 33 | 0.46% | 8 | 0.11% | 5,196 | 72.23% | 7,193 |
| Lauderdale | 31,721 | 71.54% | 11,915 | 26.87% | 537 | 1.21% | 166 | 0.37% | 19,806 | 44.67% | 44,339 |
| Lawrence | 12,322 | 76.86% | 3,562 | 22.22% | 126 | 0.79% | 21 | 0.13% | 8,760 | 54.64% | 16,031 |
| Lee | 42,221 | 59.09% | 27,860 | 38.99% | 1,019 | 1.43% | 349 | 0.49% | 14,361 | 20.10% | 71,449 |
| Limestone | 34,640 | 70.36% | 13,672 | 27.77% | 748 | 1.52% | 175 | 0.36% | 20,968 | 42.59% | 49,235 |
| Lowndes | 1,836 | 26.86% | 4,972 | 72.74% | 26 | 0.38% | 1 | 0.01% | −3,136 | −45.88% | 6,835 |
| Macon | 1,541 | 17.67% | 7,108 | 81.49% | 52 | 0.60% | 22 | 0.25% | −5,567 | −63.82% | 8,723 |
| Madison | 102,780 | 52.77% | 87,286 | 44.82% | 3,699 | 1.90% | 1,002 | 0.51% | 15,494 | 7.95% | 194,767 |
| Marengo | 5,343 | 49.02% | 5,488 | 50.35% | 59 | 0.54% | 10 | 0.09% | −145 | −1.33% | 10,900 |
| Marion | 12,205 | 88.40% | 1,463 | 10.60% | 115 | 0.83% | 24 | 0.17% | 10,742 | 77.80% | 13,807 |
| Marshall | 33,191 | 83.70% | 5,943 | 14.99% | 435 | 1.10% | 86 | 0.22% | 27,248 | 68.71% | 39,655 |
| Mobile | 101,243 | 55.27% | 79,474 | 43.39% | 1,938 | 1.06% | 509 | 0.28% | 21,769 | 11.88% | 183,164 |
| Monroe | 6,147 | 57.62% | 4,455 | 41.76% | 53 | 0.50% | 13 | 0.12% | 1,692 | 15.86% | 10,668 |
| Montgomery | 33,311 | 33.60% | 64,529 | 65.09% | 923 | 0.93% | 376 | 0.38% | −31,218 | −31.49% | 99,139 |
| Morgan | 39,664 | 73.83% | 13,234 | 24.63% | 705 | 1.31% | 119 | 0.22% | 26,430 | 49.20% | 53,722 |
| Perry | 1,339 | 25.60% | 3,860 | 73.80% | 24 | 0.46% | 7 | 0.13% | −2,521 | −48.20% | 5,230 |
| Pickens | 5,594 | 57.86% | 4,022 | 41.60% | 40 | 0.41% | 12 | 0.12% | 1,572 | 16.26% | 9,668 |
| Pike | 8,042 | 58.10% | 5,636 | 40.72% | 134 | 0.97% | 29 | 0.21% | 2,406 | 17.38% | 13,841 |
| Randolph | 8,559 | 78.98% | 2,203 | 20.33% | 61 | 0.56% | 14 | 0.13% | 6,356 | 58.65% | 10,837 |
| Russell | 9,864 | 46.25% | 11,228 | 52.64% | 198 | 0.93% | 39 | 0.18% | −1,364 | −6.39% | 21,329 |
| Shelby | 79,700 | 69.33% | 33,268 | 28.94% | 1,462 | 1.27% | 520 | 0.45% | 46,432 | 40.39% | 114,950 |
| St. Clair | 36,166 | 81.38% | 7,744 | 17.43% | 446 | 1.00% | 85 | 0.19% | 28,422 | 63.95% | 44,441 |
| Sumter | 1,598 | 25.40% | 4,648 | 73.88% | 37 | 0.59% | 8 | 0.13% | −3,050 | −48.48% | 6,291 |
| Talladega | 22,235 | 62.35% | 13,138 | 36.84% | 247 | 0.69% | 43 | 0.12% | 9,097 | 25.51% | 35,663 |
| Tallapoosa | 14,963 | 71.28% | 5,859 | 27.91% | 130 | 0.62% | 39 | 0.19% | 9,104 | 43.37% | 20,991 |
| Tuscaloosa | 51,117 | 56.69% | 37,765 | 41.88% | 927 | 1.03% | 363 | 0.40% | 13,352 | 14.81% | 90,172 |
| Walker | 26,002 | 83.42% | 4,834 | 15.51% | 277 | 0.89% | 57 | 0.18% | 21,168 | 67.91% | 31,170 |
| Washington | 6,564 | 73.95% | 2,258 | 25.44% | 45 | 0.51% | 9 | 0.10% | 4,306 | 48.51% | 8,876 |
| Wilcox | 1,833 | 31.05% | 4,048 | 68.58% | 17 | 0.29% | 5 | 0.08% | −2,215 | −37.53% | 5,903 |
| Winston | 10,195 | 90.35% | 974 | 8.63% | 102 | 0.90% | 13 | 0.12% | 9,221 | 81.72% | 11,284 |
| Total | 1,441,170 | 62.03% | 849,624 | 36.57% | 25,176 | 1.08% | 7,312 | 0.32% | 591,546 | 25.46% | 2,323,282 |
Analysis
The Democratic Party dominated Alabama politics in the early 19th century.[48] The party held an 84-year streak on the presidential ballot from 1876 and 1944, and did not vote for a Republican between 1872 and 1964. Congressional and local politics were effectively one-party systems as well even into the early 21st century. Yet, the Southern Strategy and realignment of political parties made the Republicans the prominent political party in the South as evangelical and southern whites realigned to the Republicans in response to Democratic support of Civil Rights legislation. Republican ascendance to the presidential ballot began in 1964, when conservative Barry Goldwater easily carried the state despite Lyndon B. Johnson's nationwide landslide. Johnson wiped out Goldwater in the rest of the country due to Johnson portraying Goldwater's views as anti-Civil Rights and pro-war, the former of which appealed more to Southern states. Thus, this election marked a turning point in Alabama politics, creating a Republican advantage that slowly trickled downballot.[7] As a consequence, today, it is now one of the quintessential Republican states in the Deep South, and a Trump victory was near-guaranteed.
According to the Pew Research Center, Alabama is tied with Mississippi for the most religious state in the country: as of 2016, 77% of adults are "highly religious" and 82% believe in God.[49] Just as with other Bible Belt states, the dominating white, evangelical population in rural and suburban areas more than offset any gains made by Vice President Biden. Biden did win Jefferson County, which encompasses the Yellowhammer State's largest city, Birmingham, by a margin of 13.15%.[6] Birmingham was a potential host for the 2020 Democratic National Convention, but it was not chosen.[50][51] The rest of the counties he won were in the Black Belt, a Democratic enclave in Alabama due to high proportions of African Americans. Highly fertile black soil made this area an epicenter for slavery in the days of the Solid South, and once these slaves were emancipated in 1865 and enfranchised in the 1960s, this collection of 12 majority-Black counties became solidly Democratic: seven of them gave 70% or more of their ballots to Biden, and two (Greene and Macon) gave him over 80%. However, the Great Migration saw most of these counties become rural and sparsely populated, with the exception of Montgomery County, home to the state capital of Montgomery.[52]
Trump easily outperformed these wins with victories in every other metropolitan area and the Birmingham suburbs. He won, in order of population, Mobile (Mobile), Madison (Huntsville), Shelby (Alabaster and many other Birmingham suburbs), Tuscaloosa (Tuscaloosa), and Baldwin (Daphne) counties, as well as most rural counties not in the Black Belt, many of them with over 70% of the vote. He also carried the two swing counties of Barbour and Conecuh. His largest margin was in the historically Republican Winston County, where he received 90.35% of the vote, a margin of 81.72%. 18 counties gave President Trump over 80% of the vote and another 17 gave him between 70 and 80%.
Per exit polls by the Associated Press, Trump's strength in Alabama came from 88% of white born again/evangelical Christians, which comprised 53% of voters. Protestant voters backed Trump with 75% of the vote, Catholics with 59%, and other Christians with 63%. Expectedly, Biden had his greatest strength among other religious groups, whom he captured 56–43, and nonreligious voters, who backed him 60–38. 59% of voters believed abortion should be illegal in all or most cases, and these voters backed Trump by 84–15. Other policy divides were also evident: 48% of voters supported COVID-19 restrictions over economic harm, while 50% supported the opposite. These groups backed Biden 68–30 and Trump 90–7, respectively. 70% of voters believed racism is a significant issue in American society, and these voters decided to back Biden 50–48, but were usurped by the other 30% of voters who believed the opposite and gave 94% of their support to Trump.
As is the case in most Southern states, there was a stark racial divide in voting in this election, with Trump capturing 78% of whites and Biden winning 91% of blacks. While Trump carried all gender, age, and education groups, Biden was most competitive among women (53% of voters, backing Trump 59–40), voters aged 18 to 29 (12% of voters, backing Trump 52–45), and postgraduates (11% of the electorate, backing Trump 53–44).[53]
This election corresponded with the 2020 United States Senate election in Alabama, where incumbent Democrat Doug Jones – who was elected by a 21,924 vote margin in a 2017 special election – ran for a full six-year term but was defeated by Republican football coach Tommy Tuberville. Despite losing, Jones outperformed Biden by 5.1 percentage points.
See also
- United States presidential elections in Alabama
- 2020 United States elections
- 2020 United States presidential election
- 2020 Democratic Party presidential primaries
- 2020 Democratic Party presidential debates
- 2020 Democratic Party presidential forums
- Results of the 2020 Democratic Party presidential primaries
- 2020 Republican Party presidential primaries
- 2020 Republican Party presidential debates
- Results of the 2020 Republican Party presidential primaries
- 2020 United States Senate election in Alabama
- 2020 United States House of Representatives elections
- Elections in Alabama
Notes
- The other sixteen states were, Colorado, Connecticut, Delaware, Georgia, Kentucky, Maine, Maryland, Massachusetts, Mississippi, Nebraska, New Hampshire, New Jersey, Rhode Island, Tennessee, Texas, and Virginia.
- CBS News' presidential election ratings uniquely do not contain a category for Safe/Solid races.
- NPR's presidential election ratings uniquely do not contain a category for Safe/Solid races.
- Calculated by taking the difference of 100% and all other candidates combined.
- Key:
A – all adults
RV – registered voters
LV – likely voters
V – unclear - Overlapping sample with the previous SurveyMonkey/Axios poll, but more information available regarding sample size
- "Other candidate or write-in" with 0%
- "Refused" with 0%
- "Someone else" with 2%
- "Trump does not deserve to be re-elected" with 42% as opposed to "Trump deserves to be re-elected"
- Partisan clients
- Poll sponsored by Tommy Tuberville's campaign.
- The Consumer Energy Alliance is a pro-Keystone XL lobbying group
- Poll sponsored by Doug Jones' campaign
References
- Kelly, Ben (August 13, 2018). "US elections key dates: When are the 2018 midterms and the 2020 presidential campaign?". The Independent. Retrieved January 3, 2019.
- "Distribution of Electoral Votes". National Archives and Records Administration. Retrieved January 3, 2019.
- "2020 November General Election Sample Ballot". www.sos.alabama.gov. Alabama Secretary of State. Retrieved December 4, 2020.
- "Ballot access requirements for political candidates in Alabama". Ballotpedia. Retrieved December 4, 2020.
- "Canvass of Results for the General Election held on November 8, 2016" (PDF). Alabama Secretary of State. November 29, 2016. Retrieved December 5, 2020.
- "State of Alabama: Canvass of Results" (PDF). Alabama Secretary of State. November 23, 2020. Retrieved December 5, 2020.
- "Alabama Presidential Election Voting History". 270toWin. Retrieved December 5, 2020.
- Sean Ross. "View your county's sample ballot for Alabama's March 3 primary election". Yellowhammer News. Retrieved February 4, 2020.
- "Republican Party – Official 2020 Primary Election Results". Alabama.gov. Alabama Secretary of State. March 11, 2020. Archived from the original on March 29, 2020. Retrieved March 25, 2020.
- "Alabama Election Results 2020". PBS NewsHour. Retrieved March 26, 2020.
- "Alabama Primary Election Results 2016". The New York Times. March 1, 2016. ISSN 0362-4331. Retrieved December 6, 2020.
- Silver, Nate (January 9, 2020). "2020 Democratic Primary: Who will win the Alabama primary?". FiveThirtyEight. Retrieved December 6, 2020.
- Bycoffe, Aaron; King, Ritchie; Koeze, Ella; Mehta, Dhrumil; Mithani, Jasmine; Wolfe, Julia (December 4, 2020). "Alabama President: Democratic primary Polls". FiveThirtyEight. Retrieved December 6, 2020.
- "2020 Alabama Democratic Primary". 270toWin.com. Retrieved December 6, 2020.
- Strauss, Daniel; Gambino, Lauren (November 1, 2020). "Joe Biden: from a campaign that almost collapsed to fighting Trump for the presidency". The Guardian. ISSN 0029-7712. Retrieved December 10, 2020.
- Edelman, Adam; Melvin, Craig; Thompson, Priscilla (March 2, 2020). "Pete Buttigieg endorses Joe Biden for president". NBC News. Retrieved December 6, 2020.
- Lah, Kyung; Merica, Dan; Sullivan, Kate; Wright, Jasmine (March 2, 2020). "Amy Klobuchar ends 2020 presidential campaign and endorses Joe Biden". CNN. Retrieved December 6, 2020.
- Dugyala, Rishika. "Beto O'Rourke endorses Biden". POLITICO. Retrieved December 6, 2020.
- Dugyala, Rishika (March 8, 2020). "Kamala Harris endorses Biden". Politico. Retrieved December 6, 2020.
- Rakich, Nathaniel (March 4, 2020). "How Biden Beat Expectations On Super Tuesday". FiveThirtyEight. Retrieved December 10, 2020.
- "Exit and entrance polls from the 2020 primaries and caucuses". CNN. Retrieved December 6, 2020.
- "Democratic Party – Official 2020 Primary Election Results". Alabama.gov. Alabama Secretary of State. March 11, 2020. Archived from the original on March 29, 2020. Retrieved March 25, 2020.
- "Alabama Election Results 2020". PBS NewsHour. Retrieved March 3, 2020.
- "2020 POTUS Race ratings" (PDF). The Cook Political Report. Retrieved May 21, 2019.
- "POTUS Ratings | Inside Elections". insideelections.com. Retrieved May 21, 2019.
- "Larry J. Sabato's Crystal Ball » 2020 President". crystalball.centerforpolitics.org. Retrieved May 21, 2019.
- "2020 Election Forecast". Politico. November 19, 2019.
- "Battle for White House". RCP. April 19, 2019.
- 2020 Bitecofer Model Electoral College Predictions, Niskanen Center, March 24, 2020, retrieved: April 19, 2020
- "Niskanen Center electoral college map". 270toWin. September 15, 2020. Retrieved December 19, 2020.
- David Chalian; Terence Burlij. "Road to 270: CNN's debut Electoral College map for 2020". CNN. Retrieved June 16, 2020.
- "Forecasting the US elections". The Economist. Retrieved July 7, 2020.
- "2020 Election Battleground Tracker". CBS News. July 12, 2020. Retrieved July 13, 2020.
- "2020 Presidential Election Interactive Map". 270 to Win.
- "ABC News Race Ratings". CBS News. July 24, 2020. Retrieved July 24, 2020.
- "2020 Electoral Map Ratings: Trump Slides, Biden Advantage Expands Over 270 Votes". NPR.org. Retrieved August 3, 2020.
- "Biden dominates the electoral map, but here's how the race could tighten". NBC News. Retrieved August 6, 2020.
- "2020 Election Forecast". FiveThirtyEight. Retrieved August 14, 2020.
- "TRUMP, DONALD J. - Candidate overview". Federal Election Commission. Retrieved December 9, 2020.
- "BIDEN, JOSEPH R JR - Candidate overview". Federal Election Commission. Retrieved December 9, 2020.
- "JORGENSEN, JO - Candidate overview". Federal Election Commission. Retrieved December 9, 2020.
- "Faithless Elector State Laws". FairVote. July 7, 2020. Retrieved December 9, 2020.
- "Alabama Code Title 17. Elections § 17-14-31". FindLaw. Retrieved December 9, 2020.
- "Certification of Dem Electors" (PDF). alabama.gov. Alabama Secretary of State. Retrieved December 8, 2020.
- "GOP Final Certification 8-27-2020" (PDF). alabama.gov. Alabama Secretary of State. Retrieved December 8, 2020.
- "Elector Statements for Jo Jorgensen and Jeremy Spike Cohen" (PDF). alabama.gov. Alabama Secretary of State. Retrieved December 8, 2020.
- "State of Alabama: Canvass of Results" (PDF). November 23, 2020. Retrieved November 23, 2020.
- Moskowitz, Seth (December 23, 2019). "The Road to 270: Alabama". 270toWin. Retrieved December 7, 2020.
- Lipka, Michiael; Wormald, Benjamin (February 29, 2016). "Most and least religious U.S. states". Pew Research Center. Retrieved December 5, 2020.
- Poe, Kelly (August 1, 2016). "Mayor Bell: Birmingham will seek the DNC again in 2020". AL.com. Retrieved February 1, 2018.
- Poe, Kelly (April 20, 2018). "Yes, Birmingham is again vying for the Democratic national convention". AL.com. Retrieved April 20, 2018.
- Moskowitz, Seth (December 23, 2019). "The Road to 270: Alabama". 270toWin. Retrieved December 5, 2020.
- "Alabama Voter Surveys: How Different Groups Voted". The New York Times. November 3, 2020. ISSN 0362-4331. Retrieved November 9, 2020.
Further reading
- Summary: State Laws on Presidential Electors (PDF), Washington DC: National Association of Secretaries of State, August 2020,
Alabama
External links
- Government Documents Round Table of the American Library Association, "Alabama", Voting & Elections Toolkits
- "Alabama: Election Tools, Deadlines, Dates, Rules, and Links", Vote.org, Oakland, CA
- "League of Women Voters of Alabama". (state affiliate of the U.S. League of Women Voters)
- Alabama at Ballotpedia