2020 United States presidential election in Hawaii
The 2020 United States presidential election in Hawaii was held on Tuesday, November 3, 2020, as part of the 2020 United States elections in which all 50 states plus the District of Columbia participated.[2] Hawaii voters chose electors to represent them in the Electoral College via a popular vote, pitting the Republican Party's nominee, incumbent President Donald Trump, and running mate Vice President Mike Pence against Democratic Party nominee, former Vice President Joe Biden, and his running mate California Senator Kamala Harris. Hawaii has four electoral votes in the Electoral College.[3]
| ||||||||||||||||||||||||||
| Turnout | 69.65% | |||||||||||||||||||||||||
|---|---|---|---|---|---|---|---|---|---|---|---|---|---|---|---|---|---|---|---|---|---|---|---|---|---|---|
| ||||||||||||||||||||||||||
 County Results
Biden 60–70% 90-100%
| ||||||||||||||||||||||||||
| ||||||||||||||||||||||||||
.jpg.webp)
| Elections in Hawaii |
|---|
 |
Hawaii was the first state in the 2020 election cycle to exceed the voter turnout in 2016, causing the state to attract attention as a representation of an overall trend in increased early voting during the general election.[4]
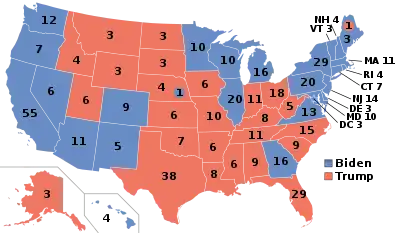
Biden won Hawaii with 63.7% of the vote and a 29.5% margin over Trump, who earned 34.3%. Both major parties improved over 2016, when third parties earned nearly 8% of the vote; Biden's percentage of the vote was slightly higher than Hillary Clinton's 62.9%, while Trump improved over his 30.3% share of the 2016 vote. However, Biden's margin of victory was slightly smaller than Clinton's 32.6%. Hawaii was one of only seven states and the District of Columbia where Trump's margin increased from 2016, and its 2.7% shift was the largest. Trump won more precincts than he did in 2016, winning more of the west coast of Oahu than he did before and every single vote on Niihau. Trump won more votes in Hawaii than any Republican in history (but not a larger percentage), narrowly beating George W. Bush's performance in 2004.[5] Despite this modest pro-Trump margin swing, Biden won the state by more votes than Clinton, as was the case for the other three states (California, Nevada and Illinois) and the District of Columbia that he won.[6] Hawaii was one of three states where Biden won every county, the other two being Massachusetts and Rhode Island. It was the eighth consecutive election that the Democratic nominee carried every county in the state. Despite his overwhelming victory here, this was the first election since 2004 in which Hawaii was not the most Democratic state in terms of margin or percentage, that title went to Vermont instead.
Per exit polls by the Associated Press, Biden's strength in Hawaii came from progressive whites with 63%, and Asians with 66%.[7] Japanese Americans make up a large percentage of Hawaii, and they are among the most Democratic constituencies.[8] Hawaii was the only state in which the electorate was majority-minority in 2020, with whites comprising only 29% of the electorate.[7]
Primary elections
Canceled Republican primary
On December 11, 2019, the Hawaii Republican Party became one of several state GOP parties to officially cancel their respective primaries and caucuses.[9] Donald Trump's re-election campaign and GOP officials have cited the fact that Republicans canceled several state primaries when George H. W. Bush and George W. Bush sought a second term in 1992 and 2004, respectively; and Democrats scrapped some of their primaries when Bill Clinton and Barack Obama were seeking reelection in 1996 and 2012, respectively.[10][11] Because this was the first of the cancelled Republican state races to directly bind its delegates to the national convention (as opposed to a walking subcaucus-type system), Trump automatically was awarded his first 19 pledged delegates of the nomination campaign.[9][12]
Democratic primary
The Hawaii Democratic primary was originally scheduled for April 4, 2020. On March 20, due to concerns over the COVID-19 pandemic, the Hawaii Democratic Party canceled in-person voting in favor of mail-in voting.[13] The deadline was then extended to May 22.[14]
The primary was conducted by ranked-choice voting. Voters were instructed to mark their top three choices on paper ballots. Any voter with a first choice other than Biden or Sanders had their ballot count in the final round if ranking one of those candidates as a second or third choice.
| Candidate | First result |
% | Final result |
% | Delegates |
|---|---|---|---|---|---|
| Joe Biden | 19,593 | 56.0% | 21,215 | 63.23% | 16 |
| Bernie Sanders (suspended) | 10,777 | 30.8% | 12,337 | 36.77% | 8 |
| Elizabeth Warren (withdrawn) | 1,689 | 4.8% | |||
| Tulsi Gabbard (withdrawn) | 1,377 | 3.9% | |||
| Michael Bloomberg (withdrawn) | 460 | 1.3% | |||
| Andrew Yang (withdrawn) | 340 | 1.0 | |||
| Pete Buttigieg (withdrawn) | 311 | 0.9 | |||
| Uncommitted | 291 | 0.8 | |||
| Amy Klobuchar (withdrawn) | 93 | 0.3 | |||
| Tom Steyer (withdrawn) | 34 | 0.1 | |||
| Deval Patrick (withdrawn) | 11 | 0.0 | |||
| Total | 34,976 | 100% | 33,552 | 100% | 24 |
The ballots were counted separately in each of Hawaii's two Congressional districts.[16]
| Candidate | Round 1 | Round 2 | Round 3 | Round 4 | Round 5 | Round 6 | Round 7 | Round 8 | Round 9 | Round 10 | ||||||||||
|---|---|---|---|---|---|---|---|---|---|---|---|---|---|---|---|---|---|---|---|---|
| Votes | % | Votes | % | Votes | % | Votes | % | Votes | % | Votes | % | Votes | % | Votes | % | Votes | % | Votes | % | |
| Joe Biden | 8,585 | 58.90% | 8,586 | 58.90% | 8,588 | 58.90% | 8,601 | 59.00% | 8,612 | 59.40% | 8,686 | 60.00% | 8,729 | 60.40% | 8,885 | 61.80% | 8,991 | 63.50% | 9,315 | 66.40% |
| Bernie Sanders suspended | 4,054 | 27.80% | 4,055 | 27.80% | 4,057 | 27.80% | 4,061 | 27.90% | 4,066 | 28.00% | 4,086 | 28.20% | 4,141 | 28.70% | 4,174 | 29.00% | 4,322 | 30.50% | 4,716 | 33.60% |
| Elizabeth Warren suspended | 738 | 5.06% | 738 | 5.06% | 740 | 5.08% | 746 | 5.12% | 747 | 5.15% | 769 | 5.31% | 813 | 5.63% | 832 | 5.79% | 853 | 6.02% | Eliminated | |
| Tulsi Gabbard suspended | 446 | 3.06% | 446 | 3.06% | 446 | 3.06% | 447 | 3.07% | 449 | 3.10% | 456 | 3.15% | 475 | 3.29% | 485 | 3.37% | Eliminated | |||
| Michael Bloomberg suspended | 262 | 1.80% | 262 | 1.80% | 266 | 1.82% | 267 | 1.83% | 270 | 1.86% | 278 | 1.92% | 286 | 1.98% | Eliminated | |||||
| Andrew Yang suspended | 186 | 1.28% | 187 | 1.28% | 191 | 1.31% | 192 | 1.32% | 193 | 1.33% | 206 | 1.42% | Eliminated | |||||||
| Pete Buttigieg suspended | 153 | 1.05% | 153 | 1.05% | 153 | 1.05% | 159 | 1.09% | 159 | 1.10% | Eliminated | |||||||||
| Uncommitted | 106 | 0.73% | 106 | 0.73% | 106 | 0.73% | 106 | 0.73% | Eliminated | |||||||||||
| Amy Klobuchar suspended | 34 | 0.23% | 34 | 0.23% | 34 | 0.23% | Eliminated | |||||||||||||
| Tom Steyer suspended | 15 | 0.10% | 15 | 0.10% | Eliminated | |||||||||||||||
| Deval Patrick suspended | 4 | 0.03% | Eliminated | |||||||||||||||||
| Total | 14,583 | 100% | 14,582 | 100% | 14,581 | 100% | 14,579 | 100% | 14,496 | 100% | 14,481 | 100% | 14,444 | 100% | 14,376 | 100% | 14,166 | 100% | 14,031 | 100% |
| Candidate | Round 1 | Round 2 | Round 3 | Round 4 | Round 5 | Round 6 | Round 7 | Round 8 | Round 9 | Round 10 | ||||||||||
|---|---|---|---|---|---|---|---|---|---|---|---|---|---|---|---|---|---|---|---|---|
| Votes | % | Votes | % | Votes | % | Votes | % | Votes | % | Votes | % | Votes | % | Votes | % | Votes | % | Votes | % | |
| Joe Biden | 11,008 | 54.00% | 11,010 | 54.00% | 11,015 | 54.00% | 11,028 | 54.10% | 11,058 | 54.30% | 11,137 | 54.80% | 11,150 | 55.30% | 11,247 | 55.90% | 11,459 | 58.20% | 11,900 | 61.00% |
| Bernie Sanders suspended | 6,723 | 33.00% | 6,724 | 33.00% | 6,729 | 33.00% | 6,730 | 33.00% | 6,773 | 33.20% | 6,798 | 33.40% | 6,808 | 33.70% | 6,837 | 34.00% | 7,138 | 36.20% | 7,621 | 39.00% |
| Elizabeth Warren suspended | 951 | 4.66% | 952 | 4.67% | 955 | 4.68% | 974 | 4.78% | 997 | 4.89% | 1,024 | 5.03% | 1,028 | 5.09% | 1,040 | 5.17% | 1,098 | 5.58% | Eliminated | |
| Tulsi Gabbard suspended | 931 | 4.57% | 931 | 4.57% | 931 | 4.57% | 937 | 4.60% | 962 | 4.72% | 971 | 4.77% | 973 | 4.82% | 990 | 4.92% | Eliminated | |||
| Michael Bloomberg suspended | 198 | 0.97% | 198 | 0.97% | 201 | 0.99% | 203 | 1.00% | 205 | 1.01% | 217 | 1.07% | 219 | 1.09% | Eliminated | |||||
| Uncommitted | 185 | 0.91% | 185 | 0.91% | 186 | 0.91% | 186 | 0.91% | 191 | 0.94% | 192 | 0.94% | Eliminated | |||||||
| Pete Buttigieg suspended | 158 | 0.77% | 159 | 0.78% | 159 | 0.78% | 170 | 0.83% | 186 | 0.91% | Eliminated | |||||||||
| Andrew Yang suspended | 154 | 0.76% | 155 | 0.76% | 155 | 0.76% | 159 | 0.78% | Eliminated | |||||||||||
| Amy Klobuchar suspended | 59 | 0.29% | 60 | 0.29% | 61 | 0.30% | Eliminated | |||||||||||||
| Tom Steyer suspended | 19 | 0.09% | 19 | 0.09% | Eliminated | |||||||||||||||
| Deval Patrick suspended | 7 | 0.03% | Eliminated | |||||||||||||||||
| Total | 20,393 | 100% | 20,393 | 100% | 20,392 | 100% | 20,387 | 100% | 20,372 | 100% | 20,339 | 100% | 20,178 | 100% | 20,114 | 100% | 19,695 | 100% | 19,521 | 100% |
Green primary
| Green Party of Hawaii presidential primary, May 23, 2020[17] | |||
|---|---|---|---|
| Candidate | Percentage | National delegates | |
| Dario Hunter | 41.6% | 2 | |
| Howie Hawkins | 33.3% | 2 | |
| Kent Mesplay | 8.3% | 0 | |
| Dennis Lambert | 8.3% | 0 | |
| Chad Wilson | 8.3% | 0 | |
| Susan Buchser-Lochocki | 0% | 0 | |
| Sedinam Moyowasifza-Curry | 0% | 0 | |
| David Rolde | 0% | 0 | |
| No Preference | 0% | 0 | |
| Total | 100.00% | 4 | |
General election
Predictions
| Source | Ranking | As of |
|---|---|---|
| The Cook Political Report[18] | Safe D | November 3, 2020 |
| Inside Elections[19] | Safe D | November 3, 2020 |
| Sabato's Crystal Ball[20] | Safe D | November 3, 2020 |
| Politico[21] | Safe D | November 3, 2020 |
| RCP[22] | Safe D | November 3, 2020 |
| Niskanen[23] | Safe D | November 3, 2020 |
| CNN[24] | Safe D | November 3, 2020 |
| The Economist[25] | Safe D | November 3, 2020 |
| CBS News[26] | Likely D | November 3, 2020 |
| 270towin[27] | Safe D | November 3, 2020 |
| ABC News[28] | Safe D | November 3, 2020 |
| NPR[29] | Likely D | November 3, 2020 |
| NBC News[30] | Safe D | November 3, 2020 |
| 538[31] | Safe D | November 3, 2020 |
Graphical summary
Aggregate polls
| Source of poll aggregation |
Dates administered |
Dates updated |
Joe Biden Democratic |
Donald Trump Republican |
Other/ Undecided [lower-alpha 1] |
Margin |
|---|---|---|---|---|---|---|
| FiveThirtyEight | until October 31, 2020 | November 2, 2020 | 64.1% | 30.6% | 5.3% | Biden +33.5 |
Polls
| Poll source | Date(s) administered |
Sample size[lower-alpha 2] |
Margin of error |
Donald Trump Republican |
Joe Biden Democratic |
Jo Jorgensen Libertarian |
Howie Hawkins Green |
Other | Undecided |
|---|---|---|---|---|---|---|---|---|---|
| SurveyMonkey/Axios | Oct 20 – Nov 2, 2020 | 688 (LV) | ± 5% | 31%[lower-alpha 3] | 67% | - | - | – | – |
| SurveyMonkey/Axios | Oct 1–28, 2020 | 1,263 (LV) | – | 34% | 63% | - | - | – | – |
| Mason-Dixon | Oct 12–14, 2020 | 625 (LV) | ± 4% | 29% | 58% | - | - | 5% | 8% |
| MRG Research/Civil Beat/HNN | Oct 2–7, 2020 | 988 (RV) | ± 3.1% | 28% | 61% | - | - | 4%[lower-alpha 4] | 7% |
| SurveyMonkey/Axios | Sep 1–30, 2020 | 474 (LV) | – | 33% | 66% | - | - | – | 1% |
| SurveyMonkey/Axios | Aug 1–31, 2020 | 362 (LV) | – | 37% | 61% | - | - | – | 2% |
| SurveyMonkey/Axios | Jul 1–31, 2020 | 356 (LV) | – | 37% | 62% | - | - | – | 2% |
| MRG Research | Jul 27–30, 2020 | 975 (RV) | ± 3.1% | 29% | 56% | - | - | 6%[lower-alpha 5] | 10% |
| SurveyMonkey/Axios | Jun 8–30, 2020 | 207 (LV) | – | 30% | 67% | - | - | – | 3% |
Results
| Party | Candidate | Votes | % | ±% | |
|---|---|---|---|---|---|
| Democratic | Joe Biden Kamala Harris |
366,130 | 63.73 | +0.85 | |
| Republican | Donald Trump Mike Pence |
196,864 | 34.27 | +3.91 | |
| Libertarian | Jo Jorgensen Spike Cohen |
5,539 | 0.96 | -2.80 | |
| Green | Howie Hawkins Angela Walker |
3,822 | 0.67 | -2.33 | |
| American Shopping | Brock Pierce Karla Ballard |
1,183 | 0.21 | N/A | |
| Constitution | Don Blankenship William Mohr |
931 | 0.16 | -0.89 | |
| Total votes | 574,469 | 100.0 | |||
By county
| County | Joseph R. Biden | Donald J. Trump | Jo Jorgensen | Howie Hawkins | Brock Pierce
American Shopping |
Don Blankenship | Margin | Total votes cast | |||||||
|---|---|---|---|---|---|---|---|---|---|---|---|---|---|---|---|
| # | % | # | % | # | % | # | % | # | % | # | % | # | % | ||
| Kalawao | 23 | 95.83% | 1 | 4.17% | 0 | 0 | 0 | 0 | 0 | 0 | 0 | 0 | 22 | 91.66% | 24 |
| Hawaii | 58,731 | 66.88% | 26,897 | 30.63% | 1,027 | 1.17% | 805 | 0.92% | 220 | 0.25% | 134 | 0.15% | 31,834 | 36.25% | 87,814 |
| Honolulu | 238,869 | 62.51% | 136,259 | 35.66% | 3,437 | 0.90% | 2,178 | 0.57% | 741 | 0.19% | 630 | 0.16% | 102,610 | 26.85% | 382,114 |
| Kauai | 21,225 | 63.36% | 11,582 | 34.58% | 303 | 0.90% | 254 | 0.76% | 77 | 0.23% | 56 | 0.17% | 9,643 | 28.78% | 33,497 |
| Maui | 47,305 | 66.59% | 22,126 | 31.14% | 772 | 1.09% | 585 | 0.82% | 145 | 0.20% | 111 | 0.16% | 25,179 | 35.45% | 71,044 |
| Totals | 366,130 | 63.73% | 196,864 | 34.27% | 5,539 | 0.96% | 3,822 | 0.67% | 1,183 | 0.21% | 931 | 0.16% | 169,266 | 29.46% | 574,469 |
By congressional district
| District | Trump | Biden | Representative |
|---|---|---|---|
| 1st | 36% | 64% | Ed Case |
| 2nd | 34% | 64% | Tulsi Gabbard |
| Kai Kahele |
Electors
The Democratic Party of Hawaii selected the following individuals to cast Electoral College votes for Biden:[33]
- John Bickel, a government and history teacher from Oahu
- Mike Golojuch, Sr. - an Air Force veteran and longtime Democratic activist from Oahu
- Hermina “Mina” Morita - a retired state lawmaker from Kaua'i
- Kainoa Kaumeheiwa-Rego - a community advocate for the Office of Hawaiian Affairs from Oahu
See also
Notes
- Calculated by taking the difference of 100% and all other candidates combined.
- Key:
A – all adults
RV – registered voters
LV – likely voters
V – unclear - Overlapping sample with the previous SurveyMonkey/Axios poll, but more information available regarding sample size
- "Neither" with 4%
- "Neither" with 6%
References
- "GENERAL ELECTION 2020 - State of Hawaii – Statewide November 3, 2020 **FINAL SUMMARY REPORT**" (PDF). Hawaii Office of Elections. November 19, 2020. Retrieved November 22, 2020.
- Kelly, Ben (August 13, 2018). "US elections key dates: When are the 2018 midterms and the 2020 presidential campaign?". The Independent. Retrieved January 3, 2019.
- "Distribution of Electoral Votes". National Archives and Records Administration. Retrieved January 3, 2019.
- https://electproject.github.io/Early-Vote-2020G/index.html
- Jung, Yoohyun. "Biden Easily Won Hawaii But Data Shows Support For Trump Has Grown". Honolulu Civil Beat. Retrieved February 4, 2021.
- Wasserman, David; Sophie; rews; Saenger, Leo; Cohen, Lev; Flinn, Ally; Tatarsky, Griff. "2020 Popular Vote Tracker". The Cook Political Report. Retrieved December 4, 2020.
- "Hawaii Voter Surveys: How Different Groups Voted". The New York Times. November 3, 2020. ISSN 0362-4331. Retrieved November 9, 2020.
- Mehta, Dhrumil (September 18, 2020). "How Asian Americans Are Thinking About The 2020 Election". FiveThirtyEight. Retrieved November 9, 2020.
- "Hawaii GOP cancels presidential preference poll, commits delegates to Trump". The Hill. December 12, 2019. Retrieved December 12, 2019.
- Karni, Annie (September 6, 2019). "GOP plans to drop presidential primaries in 4 states to impede Trump challengers". Boston Globe. MSN. Retrieved September 7, 2019.
- Steakin, Will; Karson, Kendall (September 6, 2019). "GOP considers canceling at least 3 GOP primaries and caucuses, Trump challengers outraged". ABC News. Retrieved September 7, 2019.
- "Hawaii Republican Delegation 2020". The Green Papers. Retrieved February 20, 2020.
- "Hawaii Democrats scrap in-person voting plan for primary". Associated Press. March 20, 2020.
- "Party-run Presidential Primary UPDATE". Democratic Party of Hawaii. March 27, 2020. Retrieved March 27, 2020.
- "Hawaii Primary Election Results 2020". New York Times. Retrieved May 24, 2020.
- "Ranked-Choice Results" (PDF). Democratic Party of Hawai'i. Retrieved June 6, 2020.
- "Green Party of Hawai'i Presidential Preference Poll Results". OPAVOTE. Green Party of Hawaii. Retrieved May 26, 2020.
- "2020 POTUS Race ratings" (PDF). The Cook Political Report. Retrieved May 21, 2019.
- "POTUS Ratings | Inside Elections". insideelections.com. Retrieved May 21, 2019.
- "Larry J. Sabato's Crystal Ball » 2020 President". crystalball.centerforpolitics.org. Retrieved May 21, 2019.
- "2020 Election Forecast". Politico. November 19, 2019.
- "Battle for White House". RCP. April 19, 2019.
- 2020 Bitecofer Model Electoral College Predictions, Niskanen Center, March 24, 2020, retrieved: April 19, 2020.
- David Chalian; Terence Burlij. "Road to 270: CNN's debut Electoral College map for 2020". CNN. Retrieved June 16, 2020.
- "Forecasting the US elections". The Economist. Retrieved July 7, 2020.
- "2020 Election Battleground Tracker". CBS News. July 12, 2020. Retrieved July 13, 2020.
- "2020 Presidential Election Interactive Map". 270 to Win.
- "ABC News Race Ratings". CBS News. July 24, 2020. Retrieved July 24, 2020.
- "2020 Electoral Map Ratings: Trump Slides, Biden Advantage Expands Over 270 Votes". NPR.org. Retrieved August 3, 2020.
- "Biden dominates the electoral map, but here's how the race could tighten". NBC News. Retrieved August 6, 2020.
- "2020 Election Forecast". FiveThirtyEight. Retrieved August 14, 2020.
- https://www.dailykos.com/stories/2012/11/19/1163009/-Daily-Kos-Elections-presidential-results-by-congressional-district-for-the-2012-2008-elections
Further reading
- Summary: State Laws on Presidential Electors (PDF), Washington DC: National Association of Secretaries of State, August 2020,
Hawaii
External links
- Government Documents Round Table of the American Library Association, "Hawaii", Voting & Elections Toolkits
- "Hawaii: Election Tools, Deadlines, Dates, Rules, and Links", Vote.org, Oakland, CA
- "League of Women Voters of Hawaii". (State affiliate of the U.S. League of Women Voters)
- Hawaii at Ballotpedia