2020 United States presidential election in Texas
The 2020 United States presidential election in Texas was held on Tuesday, November 3, 2020, as part of the 2020 United States elections in which all 50 states plus the District of Columbia participated.[2] Texan voters chose electors to represent them in the Electoral College via a popular vote, pitting the Republican Party's nominee, incumbent President Donald Trump, and running mate Vice President Mike Pence against Democratic Party nominee, former Vice President Joe Biden, and his running mate California Senator Kamala Harris. The state of Texas has 38 electoral votes in the Electoral College.[3]
| ||||||||||||||||||||||||||
| Turnout | 66.73%[1] | |||||||||||||||||||||||||
|---|---|---|---|---|---|---|---|---|---|---|---|---|---|---|---|---|---|---|---|---|---|---|---|---|---|---|
| ||||||||||||||||||||||||||
 County Results
| ||||||||||||||||||||||||||
| ||||||||||||||||||||||||||
.jpg.webp)
| Elections in Texas |
|---|
 |
|
|
Although it was considered a vulnerable state for Trump by pollsters and experts and a potential upset victory for Biden due to its recent demographic trends, Trump held Texas with 52.1% of the vote, roughly the same percentage he carried it with in 2016. However, Biden improved over Hillary Clinton's 2016 margin by 3.4%, having the strongest performance by a Democratic presidential candidate in the state since Jimmy Carter in 1976. Trump's margin of victory was 5.58%, a decrease from his 9% margin in 2016, but it was still larger than his lead-in polling. Turnout saw a large increase, becoming the highest in the state since 1992, when two Texans, George H. W. Bush and Ross Perot, were on the ballot.[4]
While Biden still won Latino voters in the state with 58%,[5] and Latinos of Mexican heritage with 63%,[6] Trump significantly improved his numbers among Hispanic voters in this state, particularly in the Rio Grande Valley.[7] Trump flipped Jim Wells County and La Salle County, both not won by a Republican since 1972; as well as Frio County, Kenedy County, Kleberg County, Reeves County, and Val Verde County. He also became the first Republican to win Zapata County since Warren G. Harding in 1920, flipping it by five points after having lost it by 33 points in 2016.[8] Trump's total of eight counties flipped in South Texas were the most flipped by any candidate in any state in 2020. Conversely, Biden flipped Tarrant County, winning by less than 2,000 votes. Tarrant County is home to the fifth largest city in Texas, Fort Worth, and had not been won by a Democrat since 1964, when favorite son Lyndon B. Johnson carried it. Biden also flipped Hays County and Williamson County, both of them suburban counties located outside of Austin that had not been won by a Democrat since 1992 and 1976, respectively.[9] With its 38 electoral votes, Texas was Trump's largest prize in the 2020 election.
Primary elections
Republican primary
The Republican primary was held on March 3, 2020. Donald Trump and Bill Weld were declared Republican candidates. Former South Carolina Governor and U.S. Representative Mark Sanford and U.S. Representative Joe Walsh dropped out. Texas Governor Greg Abbott declined to run against Trump, as did 2016 Republican primary candidate and current senator Ted Cruz.[10][11]
| 2020 Texas Republican Party presidential primary[12] | |||
|---|---|---|---|
| Candidate | Popular vote | Delegates | |
| Count | Percentage | ||
| 1,898,664 | 94.13% | 117 | |
| Uncommitted | 71,803 | 3.56% | 0 |
| Bill Weld | 15,739 | 0.78% | 0 |
| Joe Walsh | 15,824 | 0.78% | 0 |
| Rocky De La Fuente | 7,563 | 0.38% | 0 |
| Bob Ely | 3,582 | 0.37% | 0 |
| Matthew Matern | 3,525 | 0.18% | 0 |
| Zoltan Istvan | 1,447 | 0.07% | 0 |
| Total: | 2,017,167 | 100% | 155 |
Democratic primary
The Democratic primary was held on March 3, 2020. Elizabeth Warren, Bernie Sanders, and Joe Biden were among the major declared candidates.[13][14][15]
| Candidate | Votes | % | Delegates |
|---|---|---|---|
| Joe Biden | 725,562 | 34.64 | 113 |
| Bernie Sanders | 626,339 | 29.91 | 99 |
| Michael Bloomberg | 300,608 | 14.35 | 11 |
| Elizabeth Warren | 239,237 | 11.42 | 5 |
| Pete Buttigieg (withdrawn†) | 82,671 | 3.95 | 0 |
| Amy Klobuchar (withdrawn†) | 43,291 | 2.07 | 0 |
| Julian Castro (withdrawn) | 16,688 | 0.80 | 0 |
| Tom Steyer (withdrawn†) | 13,929 | 0.67 | 0 |
| Michael Bennet (withdrawn) | 10,324 | 0.49 | 0 |
| Tulsi Gabbard | 8,688 | 0.41 | 0 |
| Andrew Yang (withdrawn) | 6,674 | 0.32 | 0 |
| Roque De La Fuente III | 5,469 | 0.26 | 0 |
| Cory Booker (withdrawn) | 4,941 | 0.24 | 0 |
| Marianne Williamson (withdrawn) | 3,918 | 0.19 | 0 |
| John Delaney (withdrawn) | 3,280 | 0.16 | 0 |
| Robby Wells | 1,505 | 0.07 | 0 |
| Deval Patrick (withdrawn) | 1,304 | 0.06 | 0 |
| Total | 2,094,428 | 100% | 228 |
General election
Predictions
| Source | Ranking | As of |
|---|---|---|
| The Cook Political Report[18] | Tossup | October 28, 2020 |
| Inside Elections[19] | Tossup | October 28, 2020 |
| Sabato's Crystal Ball[20] | Lean R | October 8, 2020 |
| Politico[21] | Lean R | October 11, 2020 |
| RCP[22] | Tossup | October 30, 2020 |
| Niskanen[23] | Tossup | September 15, 2020 |
| CNN[24] | Lean R | October 30, 2020 |
| The Economist[25] | Lean R | October 30, 2020 |
| CBS News[26] | Lean R | October 25, 2020 |
| 270towin[27] | Lean R | October 29, 2020 |
| ABC News[28] | Tossup | October 30, 2020 |
| NPR[29] | Tossup | October 30, 2020 |
| NBC News[30] | Tossup | October 30, 2020 |
| 538[31] | Lean R | October 30, 2020 |
Graphical summary
Aggregate polls
| Source of poll aggregation |
Dates administered |
Dates updated |
Joe Biden Democratic |
Donald Trump Republican |
Other/ Undecided [lower-alpha 1] |
Margin |
|---|---|---|---|---|---|---|
| 270 to Win | Oct 20–31, 2020 | November 2, 2020 | 47.5% | 48.8% | 3.7% | Trump +1.3 |
| Real Clear Politics | October 20–31, 2020 | November 1, 2020 | 46.5% | 47.7% | 5.8% | Trump +1.2 |
| FiveThirtyEight | until November 1, 2020 | November 2, 2020 | 47.5% | 48.5% | 4.0% | Trump +1.0 |
| Average | 47.2% | 48.3% | 4.5% | Trump +1.1 | ||
Polls
| Poll source | Date(s) administered |
Sample size[lower-alpha 2] |
Margin of error |
Donald Trump Republican |
Joe Biden Democratic |
Jo Jorgensen Libertarian |
Howie Hawkins Green |
Other | Undecided |
|---|---|---|---|---|---|---|---|---|---|
| SurveyMonkey/Axios | Oct 20 – Nov 2, 2020 | 9,226 (LV) | ± 1.5% | 51%[lower-alpha 3] | 47% | – | – | – | – |
| Swayable | Oct 27 – Nov 1, 2020 | 1,151 (LV) | ± 3.9% | 51% | 47% | 1% | 0% | – | – |
| Data For Progress | Oct 27 – Nov 1, 2020 | 926 (LV) | ± 3.2% | 48% | 49% | 1% | 1% | 0%[lower-alpha 4] | – |
| AtlasIntel | Oct 30–31, 2020 | 686 (LV) | ± 4% | 50% | 47% | – | – | 3% | – |
| Emerson College | Oct 29–31, 2020 | 763 (LV) | ± 3.5% | 49%[lower-alpha 5] | 48% | - | - | 2%[lower-alpha 6] | – |
| Morning Consult | Oct 22–31, 2020 | 3,267 (LV) | ± 2% | 48% | 48% | – | – | – | – |
| Public Policy Polling | Oct 28–29, 2020 | 775 (V) | – | 48% | 50% | – | – | – | 2% |
| Gravis Marketing | Oct 27–28, 2020 | 670 (LV) | ± 3.8% | 50% | 45% | – | – | – | 5% |
| RMG Research/PoliticalIQ | Oct 27–28, 2020 | 800 (LV) | ± 3.5% | 50%[lower-alpha 7] | 46% | – | – | 2%[lower-alpha 8] | 2% |
| 48%[lower-alpha 9] | 48% | – | – | 2%[lower-alpha 10] | 2% | ||||
| 52%[lower-alpha 11] | 44% | – | – | 2%[lower-alpha 12] | 2% | ||||
| SurveyMonkey/Axios | Oct 1–28, 2020 | 15,145 (LV) | – | 51% | 47% | – | – | – | – |
| Swayable | Oct 23–26, 2020 | 552 (LV) | ± 5.7% | 49% | 48% | 3% | 1% | – | – |
| YouGov/UMass Amherst | Oct 20–26, 2020 | 873 (LV) | ± 4.2% | 48% | 47% | 2% | 1% | 0%[lower-alpha 13] | 1% |
| Data for Progress (D) | Oct 22–25, 2020 | 1,018 (LV) | ± 3.1% | 48% | 49% | 1% | 0% | – | 2% |
| Siena College/NYT Upshot | Oct 20–25, 2020 | 802 (LV) | ± 3.8% | 47% | 43% | 3% | 0% | 2%[lower-alpha 14] | 5%[lower-alpha 15] |
| Univision/University of Houston/Latino Decisions/North Star Opinion Research |
Oct 17–25, 2020 | 758 (RV) | ± 3.56% | 49% | 46% | – | – | 3%[lower-alpha 16] | 2% |
| Citizen Data | Oct 17–20, 2020 | 1,000 (LV) | ± 3% | 45% | 49% | 1% | 0% | 1% | 4% |
| YouGov/University of Houston | Oct 13–20, 2020 | 1,000 (LV) | ± 3.1% | 50% | 45% | 2% | 0% | – | 3% |
| University of Texas at Tyler/Dallas Morning News | Oct 13–20, 2020 | 925 (LV) | ± 3.2% | 47%[lower-alpha 17] | 49% | 3% | 1% | – | 1% |
| Morning Consult | Oct 11–20, 2020 | 3,347 (LV) | ± 1.7% | 47% | 48% | – | – | – | – |
| Quinnipiac University | Oct 16–19, 2020 | 1,145 (LV) | ± 2.9% | 47% | 47% | – | – | 1%[lower-alpha 18] | 5% |
| Data for Progress (D) | Oct 15–18, 2020 | 933 (LV) | ± 3.2% | 46%[lower-alpha 19] | 47% | 2% | 1% | – | 5% |
| Morning Consult | Oct 2–11, 2020 | 3,455 (LV) | ± 1.7% | 49% | 47% | – | – | – | 3% |
| Public Policy Polling/Texas Democrats[upper-alpha 1] | Oct 7–8, 2020 | 721 (LV) | ± 3.6% | 48% | 48% | – | – | – | 1% |
| YouGov/CCES | Sep 29 – Oct 7, 2020 | 2,947 (LV) | – | 49% | 47% | – | – | – | – |
| Morning Consult | Sep 28 – Oct 7, 2020 | ~2,700 (LV) | ± 2% | 49% | 46% | – | – | – | – |
| Pulse Opinion Research/Rasmussen Reports/Crosswind PR | Oct 5–6, 2020 | 1,000 (LV) | ± 3% | 51% | 44% | – | – | – | – |
| Civiqs/Daily Kos | Oct 3–6, 2020 | 895 (LV) | ± 3.4% | 48% | 48% | – | – | 2%[lower-alpha 20] | 1% |
| Data For Progress (D) | Sep 30 – Oct 5, 2020 | 1,949 (LV) | ± 2.2% | 45% | 47% | 2% | 1% | – | 5% |
| YouGov/University of Texas/Texas Tribune | Sep 25 – Oct 4, 2020 | 908 (LV) | ± 3.25% | 50% | 45% | 2% | 2% | 1%[lower-alpha 21] | – |
| EMC Research/Blue Texas PAC[upper-alpha 2] | Sep 27 – Oct 2, 2020 | 848 (LV) | – | 49% | 49% | – | – | – | – |
| SurveyMonkey/Axios | Sep 1–30, 2020 | 13,395 (LV) | – | 52% | 46% | – | – | – | 2% |
| Hart Research Associates/Human Rights Campaign[upper-alpha 3] | Sep 24–27, 2020 | 400 (LV) | ± 4.9% | 49% | 47% | – | – | – | – |
| Morning Consult | Sep 18–27, 2020 | ~2,700 (LV) | ± 2% | 48% | 47% | – | – | – | – |
| Public Policy Polling/Texas Democrats[upper-alpha 4] | Sep 25–26, 2020 | 612 (LV) | ± 3.6% | 48% | 48% | – | – | – | 4% |
| YouGov/UMass Lowell | Sep 18–25, 2020 | 882 (LV) | ± 4.3% | 49%[lower-alpha 22] | 46% | 2% | 1% | 1%[lower-alpha 23] | 1% |
| 50%[lower-alpha 24] | 46% | – | – | 2%[lower-alpha 25] | 2% | ||||
| Data For Progress[upper-alpha 5] | Sep 18–22, 2020 | 726 (LV) | ± 3.6% | 47% | 45% | – | – | – | 9% |
| Siena College/NYT Upshot | Sep 16–22, 2020 | 653 (LV) | ± 4.3% | 46% | 43% | 1% | 1% | 0%[lower-alpha 26] | 9%[lower-alpha 27] |
| Quinnipiac University | Sep 17–21, 2020 | 1,078 (LV) | ± 3% | 50% | 45% | – | – | No voters | 4% |
| YouGov/CBS | Sep 15–18, 2020 | 1,129 (LV) | ± 3.5% | 48% | 46% | – | – | 2%[lower-alpha 28] | 4% |
| Morning Consult | Sep 8–17, 2020 | ~2,700 (LV) | ± 2% | 47% | 47% | – | – | – | – |
| Morning Consult | Aug 29 – Sep 7, 2020 | 2,829 (LV) | ± 2% | 46%[lower-alpha 29] | 46% | – | – | – | – |
| Public Policy Polling/Giffords[upper-alpha 6] | Sep 1–2, 2020 | 743 (V) | – | 48% | 47% | – | – | – | 5% |
| University of Texas at Tyler/Dallas Morning News | Aug 28 – Sep 2, 2020 | 901 (LV) | ± 3.26% | 49%[lower-alpha 30] | 47% | 1% | 1% | 1% | – |
| SurveyMonkey/Axios | Aug 1–31, 2020 | 12,607 (LV) | – | 52% | 46% | – | – | – | 2% |
| Morning Consult | Aug 21–30, 2020 | 2,632 (LV) | ± 2% | 48%[lower-alpha 31] | 47% | – | – | – | – |
| Tyson Group/Consumer Energy Alliance[upper-alpha 7] | Aug 20–25, 2020 | 906 (LV) | ± 3% | 44% | 48% | 0% | – | 0%[lower-alpha 32] | 5% |
| Data for Progress/Texas Youth Power Alliance | Aug 20–25, 2020 | 2,295 (LV) | ± 2.0% | 45% | 48% | – | – | – | 8% |
| Public Policy Polling/Texas Democrats[upper-alpha 8] | Aug 21–22, 2020 | 764 (RV) | ± 3.6% | 47% | 48% | – | – | – | 5% |
| Morning Consult | Aug 13–22, 2020 | ~2,700 (LV) | ± 2% | 48% | 47% | – | – | – | – |
| Morning Consult | Aug 7–16, 2020 | 2,559 (LV) | ± 2% | 47%[lower-alpha 33] | 46% | – | – | – | – |
| Global Strategy Group/Chrysta for Texas[upper-alpha 9] | Aug 11–13, 2020 | 700 (LV) | ± 3.7% | 45% | 47% | – | – | – | – |
| YouGov/Texas Hispanic Policy Foundation/Rice University’s Baker Institute | Aug 4–13, 2020 | 846 (RV) | – | 48% | 41% | 1% | 1% | – | 10.2% |
| – (LV)[upper-alpha 10] | 50% | 44% | 1% | 0% | – | 5% | |||
| Trafalgar Group (R) | Aug 1–5, 2020 | 1,015 (LV) | ± 3.0% | 49% | 43% | 2% | – | 2%[lower-alpha 34] | 3% |
| Morning Consult | Aug 3–12, 2020 | ~2,700 (LV) | ± 2.0% | 47% | 46% | – | – | – | – |
| Morning Consult | Jul 24 – Aug 2, 2020 | 2,576 (LV) | ± 2.0% | 46%[lower-alpha 35] | 47% | – | – | 2%[lower-alpha 36] | 5% |
| SurveyMonkey/Axios | Jul 1–31, 2020 | 13,721 (LV) | – | 52% | 46% | – | – | – | 2% |
| Morning Consult | Jul 17–26, 2020 | 2,685 (LV) | ± 1.9% | 45%[lower-alpha 37] | 47% | – | – | – | – |
| Morning Consult | Jul 16–25, 2020 | ~2,700 (LV)[lower-alpha 38] | ± 2.0% | 45% | 47% | – | – | – | – |
| Spry Strategies/American Principles Project[upper-alpha 11] | Jul 16–20, 2020 | 750 (LV) | ± 3.5% | 49% | 45% | – | – | – | 6% |
| Quinnipiac University | Jul 16–20, 2020 | 880 (RV) | ± 3.3% | 44% | 45% | – | – | 7%[lower-alpha 39] | 4% |
| Morning Consult | Jul 6–15, 2020 | – (LV)[lower-alpha 40] | – | 46% | 46% | – | – | – | – |
| YouGov/CBS | Jul 7–10, 2020 | 1,185 (LV) | ± 3.6% | 46% | 45% | – | – | 4%[lower-alpha 41] | 6% |
| Gravis Marketing/OANN | Jul 7, 2020 | 591 (LV) | ± 4.3% | 46% | 44% | – | – | – | – |
| Dallas Morning News/University of Texas at Tyler | Jun 29 – Jul 7, 2020 | 1,677 (LV) | ± 2.4% | 43% | 48% | – | – | 4% | 5% |
| Morning Consult | Jun 26 – Jul 5, 2020 | – (LV)[lower-alpha 42] | – | 46% | 45% | – | – | – | – |
| SurveyMonkey/Axios | Jun 8–30, 2020 | 6,669 (LV) | – | 51% | 46% | – | – | – | 2% |
| YouGov/University of Texas/Texas Politics Project | Jun 19–29, 2020 | 1,200 (RV) | ± 2.89% | 48% | 44% | – | – | – | 8% |
| Public Policy Polling | Jun 24–25, 2020 | 729 (RV) | ± 3.6% | 46% | 48% | – | – | – | 5% |
| Morning Consult | Jun 16–25, 2020 | – (LV)[lower-alpha 43] | – | 47% | 44% | – | – | – | – |
| Fox News | Jun 20–23, 2020 | 1,001 (RV) | ± 3% | 44% | 45% | – | – | 5%[lower-alpha 44] | 5% |
| Public Policy Polling/Progress Texas[upper-alpha 12] | Jun 18–19, 2020 | 907 (V) | ± 3% | 48% | 46% | – | – | – | 6% |
| Morning Consult | Jun 6–15, 2020 | – (LV)[lower-alpha 45] | – | 48% | 45% | – | – | – | – |
| Morning Consult | May 27 – Jun 5, 2020 | – (LV)[lower-alpha 46] | – | 48% | 43% | – | – | – | – |
| Public Policy Polling/Texas Democrats[upper-alpha 13] | Jun 2–3, 2020 | 683 (V) | – | 48% | 48% | – | – | – | 4% |
| Quinnipiac | May 28 – Jun 1, 2020 | 1,166 (RV) | ± 2.9% | 44% | 43% | – | – | 6%[lower-alpha 47] | 7% |
| Morning Consult | May 17–26, 2020 | 2,551 (LV) | – | 50%[lower-alpha 48] | 43% | – | – | – | – |
| Morning Consult | May 16–25, 2020 | – (LV)[lower-alpha 49] | – | 50% | 42% | – | – | – | – |
| Morning Consult | May 6–15, 2020 | – (LV)[lower-alpha 50] | – | 49% | 43% | – | – | – | – |
| Emerson College | May 8–10, 2020 | 800 (RV) | ± 3.4% | 52%[lower-alpha 51] | 48% | – | – | – | – |
| Public Policy Polling | Apr 27–28, 2020 | 1,032 (V) | – | 46% | 47% | – | – | – | 7% |
| Dallas Morning News/University of Texas at Tyler | Apr 18–27, 2020 | 1,183 (RV) | ± 2.85% | 43% | 43% | – | – | 5% | 9% |
| University of Texas/Texas Tribune | Apr 10–19, 2020 | 1,200 (RV) | ± 2.8% | 49% | 44% | – | – | – | 7% |
| AtlasIntel | Feb 24 – Mar 2, 2020 | 1,100 (RV) | ± 3.0% | 47% | 43% | – | – | 11% | – |
| NBC News/Marist College | Feb 23–27, 2020 | 2,409 (RV) | ± 2.5% | 49% | 45% | – | – | 1% | 5% |
| CNN/SSRS | Feb 22–26, 2020 | 1,003 (RV) | ± 3.4% | 47% | 48% | – | – | 3%[lower-alpha 52] | 2% |
| Univision | Feb 21–26, 2020 | 1,004 (RV) | ± 3.1% | 43% | 46% | – | – | – | 11% |
| Dallas Morning News/University of Texas at Tyler | Feb 17–26, 2020 | 1,221 (RV) | ± 2.8% | 45% | 44% | – | – | 11% | – |
| YouGov/University of Texas/Texas Tribune | Jan 31 – Feb 9, 2020 | 1,200 (RV) | ± 2.83% | 47% | 44% | – | – | – | 10% |
| University of Texas at Tyler/Dallas News | Jan 21–30, 2020 | 910 (LV) | ± 3.24% | 46% | 44% | – | – | 10%[lower-alpha 53] | – |
| Data For Progress[upper-alpha 14] | Jan 16–21, 2020 | 1,486 (LV) | – | 54% | 40% | – | – | 3%[lower-alpha 54] | 3% |
| Texas Lyceum | Jan 10–19, 2020 | 520 (LV) | ± 4.3% | 51% | 46% | – | – | – | 3% |
| CNN/SSRS | Dec 4–9, 2019 | 1,003 (RV) | – | 48% | 47% | – | – | 2%[lower-alpha 55] | 3% |
| Beacon Research (R) | Nov 9–21, 2019 | 1,601 (RV) | ± 3.0% | 45% | 44% | – | – | – | – |
| University of Texas at Tyler | Nov 5–14, 2019 | 1,093 (RV) | ± 3.0% | 45% | 39% | – | – | – | 16% |
| University of Texas/ Texas Tribune | Oct 18–27, 2019 | 1,200 (RV) | ± 2.8% | 46% | 39% | – | – | 9%[lower-alpha 56] | 6% |
| University of Texas at Tyler | Sep 13–15, 2019 | 1,199 (RV) | ± 2.8% | 38% | 40% | – | – | 13% | 9% |
| Univision | Aug 31 – Sep 6, 2019 | 1,004 (RV) | – | 43% | 47% | – | – | – | 10% |
| Climate Nexus | Aug 20–25, 2019 | 1,660 (RV) | ± 2.4% | 43% | 43% | – | – | – | 9% |
| University of Texas at Tyler | Aug 1–4, 2019 | 1,261 (RV) | ± 2.8% | 37% | 41% | – | – | 14% | 8% |
| Emerson | Aug 1–3, 2019 | 1,033 (RV) | ± 3.0% | 49% | 51% | – | – | – | – |
| University of Texas at Tyler | Jul 24–27, 2019 | 1,414 (RV) | ± 2.6% | 37% | 37% | – | – | 12% | 14% |
| Quinnipiac University | May 29 – Jun 4, 2019 | 1,159 (RV) | ± 3.4% | 44% | 48% | – | – | 1% | 4% |
| WPA Intelligence | Apr 27–30, 2019 | 200 (LV) | ± 6.9% | 49% | 42% | – | – | – | 7% |
| Emerson College | Apr 25–28, 2019 | 799 (RV) | ± 3.4% | 50%[lower-alpha 57] | 51% | – | – | – | – |
| Quinnipiac University | Feb 20–25, 2019 | 1,222 (RV) | ± 3.4% | 47% | 46% | – | – | 1% | 5% |
| Public Policy Polling (D)[upper-alpha 15] | Feb 13–14, 2019 | 743 (RV) | ± 3.6% | 49% | 46% | – | – | – | 5% |
Former candidates | ||||||||||||||||||||||||||||||||||||||||||||||||||||||||||||||||||||||||||||||||||||||||||||||||||||||||||||||||||||||||||||||||||||||||||||||||||||||||||||||||||||||||||||||||||||||||||||||||||||||||||||||||||||||||||||||||||||||||||||||||||||||||||||||||||||||||||||||||||||||||||||||||||||||||||||||||||||||||||||||||||||||||||||||||||||||||||||||||||||||||||||||||||||||||||||||||||||||||||||||||||||||||||||||||||||||||||||||||||||||||||||||||||||||||||||||||||||||||||||||||||||||||||||||||||||||||||||||||||||||||||||||||||||||||||||||||||||||||||||||||||||||||||||||||||||||||||||||||||||||||||||||||||||||||||||||||||||||||||||||||||||||||||||||||||||||||||||||||||||||||||||||||||||||||||||||||||||||||||||||||||||||||||||||||||||||||||||||||||||||||||||||||||||||||||||||||
|---|---|---|---|---|---|---|---|---|---|---|---|---|---|---|---|---|---|---|---|---|---|---|---|---|---|---|---|---|---|---|---|---|---|---|---|---|---|---|---|---|---|---|---|---|---|---|---|---|---|---|---|---|---|---|---|---|---|---|---|---|---|---|---|---|---|---|---|---|---|---|---|---|---|---|---|---|---|---|---|---|---|---|---|---|---|---|---|---|---|---|---|---|---|---|---|---|---|---|---|---|---|---|---|---|---|---|---|---|---|---|---|---|---|---|---|---|---|---|---|---|---|---|---|---|---|---|---|---|---|---|---|---|---|---|---|---|---|---|---|---|---|---|---|---|---|---|---|---|---|---|---|---|---|---|---|---|---|---|---|---|---|---|---|---|---|---|---|---|---|---|---|---|---|---|---|---|---|---|---|---|---|---|---|---|---|---|---|---|---|---|---|---|---|---|---|---|---|---|---|---|---|---|---|---|---|---|---|---|---|---|---|---|---|---|---|---|---|---|---|---|---|---|---|---|---|---|---|---|---|---|---|---|---|---|---|---|---|---|---|---|---|---|---|---|---|---|---|---|---|---|---|---|---|---|---|---|---|---|---|---|---|---|---|---|---|---|---|---|---|---|---|---|---|---|---|---|---|---|---|---|---|---|---|---|---|---|---|---|---|---|---|---|---|---|---|---|---|---|---|---|---|---|---|---|---|---|---|---|---|---|---|---|---|---|---|---|---|---|---|---|---|---|---|---|---|---|---|---|---|---|---|---|---|---|---|---|---|---|---|---|---|---|---|---|---|---|---|---|---|---|---|---|---|---|---|---|---|---|---|---|---|---|---|---|---|---|---|---|---|---|---|---|---|---|---|---|---|---|---|---|---|---|---|---|---|---|---|---|---|---|---|---|---|---|---|---|---|---|---|---|---|---|---|---|---|---|---|---|---|---|---|---|---|---|---|---|---|---|---|---|---|---|---|---|---|---|---|---|---|---|---|---|---|---|---|---|---|---|---|---|---|---|---|---|---|---|---|---|---|---|---|---|---|---|---|---|---|---|---|---|---|---|---|---|---|---|---|---|---|---|---|---|---|---|---|---|---|---|---|---|---|---|---|---|---|---|---|---|---|---|---|---|---|---|---|---|---|---|---|---|---|---|---|---|---|---|---|---|---|---|---|---|---|---|---|---|---|---|---|---|---|---|---|---|---|---|---|---|---|---|---|---|---|---|---|---|---|---|---|---|---|---|---|---|---|---|---|---|---|---|---|---|---|---|---|---|---|---|---|---|---|---|---|---|---|---|---|---|---|---|---|---|---|---|---|---|---|---|---|---|---|---|---|---|---|---|---|---|---|---|---|---|---|---|---|---|---|---|---|---|---|---|---|---|---|---|---|---|---|---|---|---|---|---|---|---|---|---|---|---|---|---|---|---|---|---|---|---|---|---|---|---|---|---|---|---|---|---|---|---|---|---|---|---|---|---|---|---|---|---|---|---|---|---|---|---|---|---|---|---|---|---|---|---|---|---|---|---|---|---|---|---|---|---|---|---|---|---|---|---|---|---|---|---|---|---|---|---|---|---|---|---|---|---|---|---|---|---|---|---|---|---|---|---|---|---|---|---|---|---|---|---|---|---|---|---|---|---|---|---|---|---|---|---|---|---|---|---|---|---|---|---|---|---|---|---|---|---|---|---|---|---|---|---|---|---|---|---|---|---|---|---|---|---|---|---|---|---|---|---|---|---|---|---|---|---|---|---|---|---|---|---|---|---|---|---|---|---|---|---|---|---|---|---|
|
Donald Trump vs. Bernie Sanders
Donald Trump vs. Elizabeth Warren
Donald Trump vs. Michael Bloomberg
Donald Trump vs. Amy Klobuchar
Donald Trump vs. Pete Buttigieg
Donald Trump vs. Tom Steyer
Donald Trump vs. Andrew Yang
Donald Trump vs. Cory Booker
with Donald Trump and Julian Castro
with Donald Trump and Kamala Harris
with Donald Trump and Beto O'Rourke
|
Hypothetical polling | |||||||||||||||||||||||||||||||||||||||||||||||||||||||||||||||||||||||||||||
|---|---|---|---|---|---|---|---|---|---|---|---|---|---|---|---|---|---|---|---|---|---|---|---|---|---|---|---|---|---|---|---|---|---|---|---|---|---|---|---|---|---|---|---|---|---|---|---|---|---|---|---|---|---|---|---|---|---|---|---|---|---|---|---|---|---|---|---|---|---|---|---|---|---|---|---|---|---|
|
with Donald Trump and Mark Cuban
with Donald Trump and a Generic Democrat
with Donald Trump and a generic Opponent
|
Voting access
Matters of election administration and ease of voting during an ongoing pandemic were heavily litigated in Texas in 2020. Harris County, the most populous one in Texas, spearheaded a number of innovative approaches and was the focal point of several legal challenges.
For the 2020 elections, Harris County Commissioners approved a budget of $33 million, higher than the $4 million budget for the 2016 United States presidential election. Chris Hollins, the interim Harris County Clerk and Texas Democratic Party finance vice chairperson, created a 23-point voting access expansion program, which included promotion of voting by mail, expansion of early voting accessibility, and drive-through voting, an innovation to facilitate voting while at the same time mitigating infection risks during the COVID-19 pandemic.[32] On October 29 several voting locations in Harris County were available for 24 hours to accommodate voters whose work shifts or other responsibilities overlapped with regular voting hours.[33]
Local Republican activists and officials challenged the voter-friendly measures in multiple legal actions, with mixed success. Several lawsuits complained about early voting and about Harris County providing multiple drop-off locations for absentee ballots. Responding to pressure from within his own party, Governor Abbott then restricted the number of drop-offs to a single one per county regardless of population and size, forcing Harris County to close eleven sites at county clerk branch offices called annexes.[34]
When a legal action challenging drive-through voting was dismissed,[32] the Republican Party in Texas sought relief in the Texas Supreme Court (SCOTX), which denied the petition because the case had not been brought promptly.[35] The first lawsuit was filed on October 15 even though Harris County had obtained prior clearance from the Office of the Texas Secretary of State (which is led a Republican appointed by Republican Governor Abbott) and had tested drive-in voting in the primary runoff elections in July without complaint.[36][37] SCOTX denied the petition and drive-thru voting continued.[38] On October 29 another action was filed seeking to invalidate drive-thru ballots based on the contention that this was a form of curbside voting that the Texas Election Code authorized only for voters with disabilities.[39] In an order issued on Sunday, November 1, the Texas Supreme Court denied the petition challenging the legality of drive-through voting, but did not resolve the legal argument one way or the other.[40][41] The next day, U.S. District Judge Andrew Hanen heard an almost identical case by the same group of plaintiff, which included Republican candidates, on an emergency basis. Slate described the judge as "one of the most notoriously partisan conservatives in the federal judiciary."[37] Hanen ruled against the plaintiffs, dismissing their action for lack of standing, with the result that drive-in voting remained in effect. The Plaintiffs, which included Steve Toth,[42] immediately sought emergency relief in the Fifth Circuit Court of Appeals, but were unsuccessful.[43] Hollins nevertheless cancelled drive-thru voting in tent structures on the eve of Election Day.[44] He reversed himself out of concern that ballots cast there might be declared invalid, should the Fifth Circuit disagree with Judge Hanen on the standing issue and agree with Judge Hanen that tents were not permissible polling places on Election Day.[45]
Some counties also set up an online system that allowed voters to check for wait times at early voting centers and make their voting plans accordingly.[46]
On October 5, Texas Governor Greg Abbott issued a proclamation under the Texas Disaster Act limiting each county to a single drop-off location for mail ballots.[47] Federal judge Robert Pitman blocked Abbott's order on October 9.[48] The next day, Texas Attorney General Ken Paxton appealed to the Fifth Circuit Court of Appeals for an emergency stay of Pitman's ruling, which a three-judge motion panel temporarily granted on an interim basis, pending consideration of the appeal on the merits.[49] A Texas state judge also blocked Abbott's order on October 15, and a state appeals court upheld that decision on October 23. Attorney General Ken Paxton then sought emergency relief from the Texas Supreme Court, which backed the Governor and lifting the temporary injunction in an October 27 decision with no dissent.[50][51][52]
Turnout
Voter registration in Texas ended on October 5, and the Secretary of State reported a registration total of 16,955,519 voters, an increase of 1,854,432 since the 2016 elections, and 1.2 million of which had occurred after the 2018 midterm elections.
Early voting began on October 13. Over one million ballots were received on that day,[53] and by October 15 fewer than two million ballots were counted.[54] The following day the count was 2.6 million, which meant 15.51% of the state's registered voters had already voted.[55]
For the whole early voting period, votes in the age 18-29 range were higher than the total of that age group of 2016, with 1.3 million votes.[56]
On October 13, Dallas County recorded 59,905 ballots and Tarrant County recorded 42,428 ballots, with the former setting a record for that county and the latter below the 2016 count on the first day of early voting.[57]
On October 13, Harris County had an unofficial tally of 128,186 ballots received, the highest ever first day early voting count and over 5% of the county's registered voters.[58] By the second day the count was 287,931, 11% of the county's registered voters.[59] On the third day over 100,000 ballots were counted, and in those three days 387,000 ballots were counted, with 44,000 of them issued through the mail.[60] On the fourth day a similar amount of ballots were past, which meant the number of ballots cast total were about 500,000.[61] On October 23 there were 1 million ballots cast from Harris County.[62]
On October 13, Travis County received 35,873 ballots,[63] while it received 38,119 the following day,[64] and by 3 P.M. on Thursday over 26,000.[65] When voting closed on Thursday the percentage of Travis County voters who had already voted was 16.44%. On Friday 41,328 additional votes were counted.[55] Williamson County by the third day had a 64,891 votes out of 376,931 people registered to vote, which meant its turnout was already 17.25%.[66]
On October 13, Bexar County recorded 78,000 votes, with over 45,000 by mail and the remainder in person.[53]
On October 13, El Paso County recorded fewer than 34,000 votes.[53]
By October 19, Texas voters cast 50% of the votes cast in the 2016 presidential election in Texas. By October 22, 65.5% of 2016 votes were cast (or 34.65% of registered voters). By October 25, over 80% of 2016 votes were cast (or 43% of registered voters),[67] and by October 29, 50% of registered voters had cast ballots by early in-person and absentee ballot. By October 30, statewide voter turnout, as well as turnout in Harris County, had already surpassed the total of 2016.[68]
General results
| Party | Candidate | Votes | % | ±% | |
|---|---|---|---|---|---|
| Republican | Donald Trump Mike Pence |
5,890,347 | 52.06% | -0.17% | |
| Democratic | Joe Biden Kamala Harris |
5,259,126 | 46.48% | +3.24% | |
| Libertarian | Jo Jorgensen Spike Cohen |
126,243 | 1.12% | -2.04% | |
| Green | Howie Hawkins Angela Walker |
33,396 | 0.30% | -0.50% | |
| Write-in | 5,944 | 0.04% | -0.53% | ||
| Total votes | 11,315,056 | 100.00% | |||
By county
| Counties won by Trump/Pence | |
| Counties won by Biden/Harris |
| County | Trump/Pence Republican |
Biden/Harris Democratic |
Jorgensen/Cohen Libertarian |
Hawkins/Walker Green |
Others | Margin | Turnout | Total votes | ||||||
|---|---|---|---|---|---|---|---|---|---|---|---|---|---|---|
| Votes | % | Votes | % | Votes | % | Votes | Votes | % | Votes | % | % | |||
| Anderson | 15,110 | 78.59% | 3,955 | 20.57% | 134 | 0.70% | 22 | 0.11% | 6 | 0.03% | 11,155 | 58.02% | 65.68% | 19,227 |
| Andrews | 4,943 | 84.31% | 850 | 14.50% | 60 | 1.02% | 10 | 0.17% | 0 | 0.00% | 4,093 | 69.81% | 57.08% | 5,863 |
| Angelina | 25,076 | 72.53% | 9,143 | 26.44% | 274 | 0.79% | 75 | 0.22% | 6 | 0.02% | 15,933 | 46.08% | 65.03% | 34,574 |
| Aransas | 9,239 | 75.17% | 2,916 | 23.73% | 103 | 0.84% | 31 | 0.25% | 1 | 0.01% | 6,323 | 51.45% | 67.14% | 12,290 |
| Archer | 4,300 | 89.66% | 446 | 9.30% | 45 | 0.94% | 4 | 0.08% | 1 | 0.02% | 3,854 | 80.36% | 73.36% | 4,796 |
| Armstrong | 1,035 | 93.08% | 75 | 6.74% | 2 | 0.18% | 0 | 0.00% | 0 | 0.00% | 960 | 86.33% | 74.23% | 1,112 |
| Atascosa | 12,039 | 66.45% | 5,876 | 32.43% | 143 | 0.79% | 58 | 0.32% | 2 | 0.01% | 6,163 | 34.02% | 61.61% | 18,118 |
| Austin | 11,447 | 78.65% | 2,951 | 20.28% | 123 | 0.85% | 33 | 0.23% | 0 | 0.00% | 8,496 | 58.38% | 71.72% | 14,554 |
| Bailey | 1,434 | 77.10% | 409 | 21.99% | 14 | 0.75% | 2 | 0.11% | 1 | 0.05% | 1,025 | 55.11% | 52.56% | 1,860 |
| Bandera | 10,057 | 79.10% | 2,505 | 19.70% | 120 | 0.94% | 30 | 0.24% | 3 | 0.02% | 7,552 | 59.39% | 74.37% | 12,715 |
| Bastrop | 20,516 | 55.96% | 15,474 | 42.20% | 531 | 1.45% | 128 | 0.35% | 16 | 0.04% | 5,042 | 13.75% | 70.38% | 36,665 |
| Baylor | 1,494 | 87.78% | 183 | 10.75% | 22 | 1.29% | 1 | 0.06% | 2 | 0.12% | 1,311 | 77.03% | 70.68% | 1,702 |
| Bee | 6,006 | 63.76% | 3,288 | 34.90% | 93 | 0.99% | 27 | 0.29% | 6 | 0.06% | 2,718 | 28.85% | 58.75% | 9,420 |
| Bell | 67,893 | 53.30% | 57,014 | 44.76% | 1,980 | 1.55% | 440 | 0.35% | 48 | 0.04% | 10,879 | 8.54% | 58.98% | 127,375 |
| Bexar | 308,618 | 40.04% | 448,452 | 58.18% | 8,837 | 1.15% | 2,798 | 0.36% | 2,113 | 0.27% | −139,834 | −18.14% | 64.81% | 770,818 |
| Blanco | 5,443 | 73.15% | 1,911 | 25.68% | 72 | 0.97% | 15 | 0.20% | 0 | 0.00% | 3,532 | 47.47% | 79.63% | 7,441 |
| Borden | 397 | 95.43% | 16 | 3.85% | 2 | 0.48% | 1 | 0.24% | 0 | 0.00% | 381 | 91.59% | 83.37% | 416 |
| Bosque | 7,469 | 81.84% | 1,561 | 17.10% | 83 | 0.91% | 13 | 0.14% | 0 | 0.00% | 5,908 | 64.74% | 71.72% | 9,126 |
| Bowie | 27,116 | 70.87% | 10,747 | 28.09% | 300 | 0.78% | 91 | 0.24% | 7 | 0.02% | 16,369 | 42.78% | 62.31% | 38,261 |
| Brazoria | 90,433 | 58.35% | 62,228 | 40.15% | 1,860 | 1.20% | 417 | 0.27% | 46 | 0.03% | 28,205 | 18.20% | 69.11% | 154,984 |
| Brazos | 47,530 | 55.88% | 35,349 | 41.56% | 1,812 | 2.13% | 252 | 0.30% | 118 | 0.14% | 12,181 | 14.32% | 69.64% | 85,061 |
| Brewster | 2,461 | 51.04% | 2,258 | 46.83% | 89 | 1.85% | 14 | 0.29% | 0 | 0.00% | 203 | 4.21% | 64.09% | 4,822 |
| Briscoe | 639 | 88.14% | 78 | 10.76% | 7 | 0.97% | 1 | 0.14% | 0 | 0.00% | 561 | 77.38% | 70.73% | 725 |
| Brooks | 998 | 40.18% | 1,470 | 59.18% | 10 | 0.40% | 6 | 0.24% | 0 | 0.00% | −472 | −19.00% | 44.99% | 2,484 |
| Brown | 13,698 | 85.78% | 2,107 | 13.19% | 134 | 0.84% | 24 | 0.15% | 6 | 0.04% | 11,591 | 72.58% | 66.67% | 15,969 |
| Burleson | 6,743 | 78.33% | 1,788 | 20.77% | 63 | 0.73% | 15 | 0.17% | 0 | 0.00% | 4,955 | 57.56% | 69.20% | 8,609 |
| Burnet | 18,767 | 75.93% | 5,639 | 22.81% | 268 | 1.08% | 34 | 0.14% | 9 | 0.04% | 13,128 | 53.11% | 73.35% | 24,717 |
| Caldwell | 8,031 | 53.64% | 6,672 | 44.56% | 190 | 1.27% | 47 | 0.31% | 33 | 0.22% | 1,359 | 9.08% | 57.71% | 14,973 |
| Calhoun | 5,641 | 71.80% | 2,148 | 27.34% | 61 | 0.78% | 6 | 0.08% | 0 | 0.00% | 3,493 | 44.46% | 60.06% | 7,856 |
| Callahan | 6,012 | 88.00% | 734 | 10.74% | 71 | 1.04% | 15 | 0.22% | 0 | 0.00% | 5,278 | 77.25% | 69.91% | 6,832 |
| Cameron | 49,032 | 42.94% | 64,063 | 56.11% | 728 | 0.64% | 336 | 0.29% | 15 | 0.01% | −15,031 | −13.16% | 52.16% | 114,174 |
| Camp | 3,626 | 71.66% | 1,394 | 27.55% | 31 | 0.61% | 7 | 0.14% | 2 | 0.04% | 2,232 | 44.11% | 64.02% | 5,060 |
| Carson | 2,779 | 89.01% | 297 | 9.51% | 37 | 1.19% | 3 | 0.10% | 6 | 0.19% | 2,482 | 79.50% | 71.85% | 3,122 |
| Cass | 11,033 | 79.22% | 2,795 | 20.07% | 79 | 0.57% | 17 | 0.12% | 3 | 0.02% | 8,238 | 59.15% | 66.67% | 13,927 |
| Castro | 1,602 | 76.91% | 466 | 22.37% | 9 | 0.43% | 6 | 0.29% | 0 | 0.00% | 1,136 | 54.54% | 54.06% | 2,083 |
| Chambers | 17,353 | 80.15% | 3,997 | 18.46% | 250 | 1.15% | 50 | 0.23% | 2 | 0.01% | 13,356 | 61.68% | 70.51% | 21,652 |
| Cherokee | 15,101 | 77.41% | 4,210 | 21.58% | 161 | 0.83% | 36 | 0.18% | 0 | 0.00% | 10,891 | 55.83% | 66.89% | 19,508 |
| Childress | 1,943 | 85.26% | 310 | 13.60% | 18 | 0.79% | 8 | 0.35% | 0 | 0.00% | 1,633 | 71.65% | 62.30% | 2,279 |
| Clay | 5,069 | 88.25% | 614 | 10.69% | 46 | 0.80% | 12 | 0.21% | 3 | 0.05% | 4,455 | 77.56% | 72.17% | 5,744 |
| Cochran | 809 | 80.90% | 177 | 17.70% | 11 | 1.10% | 3 | 0.30% | 0 | 0.00% | 632 | 63.20% | 56.47% | 1,000 |
| Coke | 1,586 | 89.15% | 178 | 10.01% | 10 | 0.56% | 5 | 0.28% | 0 | 0.00% | 1,408 | 79.15% | 73.70% | 1,779 |
| Coleman | 3,641 | 88.29% | 451 | 10.94% | 23 | 0.56% | 9 | 0.22% | 0 | 0.00% | 3,190 | 77.35% | 69.19% | 4,124 |
| Collin | 252,318 | 51.40% | 230,945 | 47.05% | 6,075 | 1.24% | 1,246 | 0.25% | 272 | 0.06% | 21,373 | 4.35% | 75.67% | 490,856 |
| Collingsworth | 1,048 | 86.04% | 155 | 12.73% | 12 | 0.99% | 1 | 0.08% | 2 | 0.16% | 893 | 73.32% | 62.72% | 1,218 |
| Colorado | 7,472 | 74.91% | 2,420 | 24.26% | 50 | 0.50% | 19 | 0.19% | 14 | 0.14% | 5,052 | 50.65% | 69.38% | 9,975 |
| Comal | 62,740 | 70.58% | 24,826 | 27.93% | 1,106 | 1.24% | 191 | 0.21% | 29 | 0.03% | 37,914 | 42.65% | 76.71% | 88,892 |
| Comanche | 5,177 | 85.06% | 853 | 14.02% | 49 | 0.81% | 5 | 0.08% | 2 | 0.03% | 4,324 | 71.05% | 63.65% | 6,086 |
| Concho | 1,058 | 83.44% | 197 | 15.54% | 10 | 0.79% | 3 | 0.24% | 0 | 0.00% | 861 | 67.90% | 72.17% | 1,268 |
| Cooke | 15,596 | 82.10% | 3,210 | 16.90% | 156 | 0.82% | 26 | 0.14% | 8 | 0.04% | 12,386 | 65.20% | 69.66% | 18,996 |
| Coryell | 15,438 | 65.71% | 7,565 | 32.20% | 410 | 1.75% | 77 | 0.33% | 3 | 0.01% | 7,873 | 33.51% | 56.68% | 23,493 |
| Cottle | 540 | 81.57% | 113 | 17.07% | 6 | 0.91% | 3 | 0.45% | 0 | 0.00% | 427 | 64.50% | 63.59% | 662 |
| Crane | 1,247 | 82.97% | 241 | 16.03% | 10 | 0.67% | 4 | 0.27% | 1 | 0.07% | 1,006 | 66.93% | 56.44% | 1,503 |
| Crockett | 1,220 | 77.51% | 344 | 21.86% | 9 | 0.57% | 1 | 0.06% | 0 | 0.00% | 876 | 55.65% | 63.65% | 1,574 |
| Crosby | 1,396 | 71.48% | 527 | 26.98% | 22 | 1.13% | 8 | 0.41% | 0 | 0.00% | 869 | 44.50% | 53.82% | 1,953 |
| Culberson | 415 | 48.03% | 438 | 50.69% | 9 | 1.04% | 2 | 0.23% | 0 | 0.00% | −23 | −2.66% | 50.56% | 864 |
| Dallam | 1,389 | 86.33% | 197 | 12.24% | 18 | 1.12% | 5 | 0.31% | 0 | 0.00% | 1,192 | 74.08% | 52.82% | 1,609 |
| Dallas | 307,076 | 33.40% | 598,576 | 65.10% | 9,635 | 1.05% | 3,667 | 0.40% | 550 | 0.06% | −291,500 | −31.70% | 65.75% | 919,504 |
| Dawson | 2,951 | 77.88% | 808 | 21.32% | 25 | 0.66% | 5 | 0.13% | 0 | 0.00% | 2,143 | 56.56% | 53.34% | 3,789 |
| Deaf Smith | 3,294 | 71.45% | 1,264 | 27.42% | 35 | 0.76% | 17 | 0.37% | 0 | 0.00% | 2,030 | 44.03% | 51.80% | 4,610 |
| Delta | 2,162 | 83.41% | 403 | 15.55% | 24 | 0.93% | 3 | 0.12% | 0 | 0.00% | 1,759 | 67.86% | 65.64% | 2,592 |
| Denton | 222,480 | 53.23% | 188,695 | 45.15% | 5,421 | 1.30% | 1,092 | 0.26% | 276 | 0.07% | 33,785 | 8.08% | 73.96% | 417,964 |
| Dewitt | 6,567 | 80.89% | 1,494 | 18.40% | 46 | 0.57% | 11 | 0.14% | 0 | 0.00% | 5,073 | 62.49% | 67.12% | 8,118 |
| Dickens | 853 | 86.34% | 130 | 13.16% | 3 | 0.30% | 2 | 0.20% | 0 | 0.00% | 723 | 73.18% | 74.40% | 988 |
| Dimmit | 1,384 | 37.75% | 2,264 | 61.76% | 10 | 0.27% | 8 | 0.22% | 0 | 0.00% | −880 | −24.00% | 49.94% | 3,666 |
| Donley | 1,438 | 87.26% | 198 | 12.01% | 11 | 0.67% | 1 | 0.06% | 0 | 0.00% | 1,240 | 75.24% | 70.97% | 1,648 |
| Duval | 2,443 | 48.35% | 2,575 | 50.96% | 22 | 0.44% | 13 | 0.26% | 0 | 0.00% | −132 | −2.61% | 60.54% | 5,053 |
| Eastland | 7,237 | 87.27% | 983 | 11.85% | 60 | 0.72% | 12 | 0.14% | 1 | 0.01% | 6,254 | 75.41% | 67.81% | 8,293 |
| Ector | 32,697 | 73.33% | 11,367 | 25.49% | 428 | 0.96% | 89 | 0.20% | 10 | 0.02% | 21,330 | 47.83% | 55.14% | 44,591 |
| Edwards | 893 | 83.77% | 168 | 15.76% | 5 | 0.47% | 0 | 0.00% | 0 | 0.00% | 725 | 68.01% | 71.11% | 1,066 |
| Ellis | 56,717 | 66.34% | 27,565 | 32.24% | 954 | 1.12% | 220 | 0.26% | 37 | 0.04% | 29,152 | 34.10% | 71.13% | 85,493 |
| El Paso | 84,331 | 31.62% | 178,126 | 66.78% | 2,746 | 1.03% | 1,445 | 0.54% | 81 | 0.03% | −93,795 | −35.16% | 54.60% | 266,729 |
| Erath | 13,684 | 81.18% | 2,916 | 17.30% | 218 | 1.29% | 35 | 0.21% | 3 | 0.02% | 10,768 | 63.88% | 70.42% | 16,856 |
| Falls | 4,177 | 68.11% | 1,899 | 30.96% | 44 | 0.72% | 13 | 0.21% | 0 | 0.00% | 2,278 | 37.14% | 59.19% | 6,133 |
| Fannin | 12,171 | 81.10% | 2,655 | 17.69% | 155 | 1.03% | 23 | 0.15% | 3 | 0.02% | 9,516 | 63.41% | 67.60% | 15,007 |
| Fayette | 10,171 | 78.60% | 2,661 | 20.56% | 83 | 0.64% | 26 | 0.20% | 0 | 0.00% | 7,510 | 58.03% | 74.38% | 12,941 |
| Fisher | 1,448 | 79.30% | 352 | 19.28% | 21 | 1.15% | 5 | 0.27% | 0 | 0.00% | 1,096 | 60.02% | 69.01% | 1,826 |
| Floyd | 1,584 | 77.69% | 438 | 21.48% | 15 | 0.74% | 2 | 0.10% | 0 | 0.00% | 1,146 | 56.20% | 52.96% | 2,039 |
| Foard | 445 | 80.76% | 99 | 17.97% | 6 | 1.09% | 1 | 0.18% | 0 | 0.00% | 346 | 62.79% | 62.33% | 551 |
| Fort Bend | 157,718 | 44.12% | 195,552 | 54.70% | 3,028 | 0.85% | 1,091 | 0.31% | 125 | 0.03% | −37,834 | −10.58% | 74.12% | 357,514 |
| Franklin | 4,161 | 83.07% | 804 | 16.05% | 36 | 0.72% | 8 | 0.16% | 0 | 0.00% | 3,357 | 67.02% | 70.94% | 5,009 |
| Freestone | 6,991 | 80.25% | 1,635 | 18.77% | 67 | 0.77% | 18 | 0.21% | 0 | 0.00% | 5,356 | 61.49% | 69.79% | 8,711 |
| Frio | 2,823 | 53.48% | 2,422 | 45.88% | 23 | 0.44% | 11 | 0.21% | 0 | 0.00% | 401 | 7.60% | 58.76% | 5,279 |
| Gaines | 5,355 | 89.31% | 576 | 9.61% | 54 | 0.90% | 10 | 0.17% | 1 | 0.02% | 4,779 | 79.70% | 61.81% | 5,996 |
| Galveston | 93,911 | 60.56% | 58,842 | 37.95% | 1,913 | 1.23% | 393 | 0.25% | 1 | 0.00% | 35,069 | 22.62% | 67.87% | 155,060 |
| Garza | 1,413 | 85.48% | 231 | 13.97% | 5 | 0.30% | 4 | 0.24% | 0 | 0.00% | 1,182 | 71.51% | 61.66% | 1,653 |
| Gillespie | 12,514 | 78.95% | 3,176 | 20.04% | 140 | 0.88% | 16 | 0.10% | 4 | 0.03% | 9,338 | 58.91% | 77.68% | 15,850 |
| Glasscock | 611 | 93.57% | 39 | 5.97% | 3 | 0.46% | 0 | 0.00% | 0 | 0.00% | 572 | 87.60% | 81.63% | 653 |
| Goliad | 3,085 | 77.22% | 877 | 21.95% | 24 | 0.60% | 2 | 0.05% | 7 | 0.18% | 2,208 | 55.27% | 69.29% | 3,995 |
| Gonzales | 5,627 | 73.57% | 1,948 | 25.47% | 57 | 0.75% | 15 | 0.20% | 1 | 0.01% | 3,679 | 48.10% | 60.56% | 7,648 |
| Gray | 6,840 | 87.90% | 829 | 10.65% | 97 | 1.25% | 16 | 0.21% | 0 | 0.00% | 6,011 | 77.24% | 62.73% | 7,782 |
| Grayson | 44,163 | 74.26% | 14,506 | 24.39% | 634 | 1.07% | 136 | 0.23% | 35 | 0.06% | 29,657 | 49.87% | 68.57% | 59,474 |
| Gregg | 32,493 | 67.72% | 14,796 | 30.84% | 551 | 1.15% | 113 | 0.24% | 29 | 0.06% | 17,697 | 36.88% | 65.85% | 47,982 |
| Grimes | 9,432 | 75.98% | 2,833 | 22.82% | 118 | 0.95% | 30 | 0.24% | 1 | 0.01% | 6,599 | 53.16% | 69.44% | 12,414 |
| Guadalupe | 47,553 | 61.26% | 28,805 | 37.11% | 1,023 | 1.32% | 211 | 0.27% | 27 | 0.03% | 18,748 | 24.15% | 69.84% | 77,619 |
| Hale | 7,177 | 74.87% | 2,279 | 23.77% | 97 | 1.01% | 31 | 0.32% | 2 | 0.02% | 4,898 | 51.10% | 50.46% | 9,586 |
| Hall | 995 | 85.12% | 168 | 14.37% | 4 | 0.34% | 1 | 0.09% | 1 | 0.09% | 827 | 70.74% | 60.70% | 1,169 |
| Hamilton | 3,616 | 83.11% | 641 | 14.73% | 52 | 1.20% | 40 | 0.92% | 2 | 0.05% | 2,975 | 68.38% | 74.61% | 4,351 |
| Hansford | 1,849 | 90.33% | 166 | 8.11% | 27 | 1.32% | 3 | 0.15% | 2 | 0.10% | 1,683 | 82.22% | 68.03% | 2,047 |
| Hardeman | 1,330 | 84.18% | 241 | 15.25% | 9 | 0.57% | 0 | 0.00% | 0 | 0.00% | 1,089 | 68.92% | 63.56% | 1,580 |
| Hardin | 23,858 | 86.33% | 3,474 | 12.57% | 276 | 1.00% | 27 | 0.10% | 0 | 0.00% | 20,384 | 73.76% | 69.17% | 27,635 |
| Harris | 700,630 | 42.70% | 918,193 | 55.96% | 16,819 | 1.03% | 5,129 | 0.31% | 47 | 0.00% | −217,563 | −13.26% | 66.15% | 1,640,818 |
| Harrison | 21,466 | 72.23% | 7,908 | 26.61% | 294 | 0.99% | 42 | 0.14% | 7 | 0.02% | 13,558 | 45.62% | 64.70% | 29,717 |
| Hartley | 1,868 | 89.89% | 195 | 9.38% | 14 | 0.67% | 1 | 0.05% | 0 | 0.00% | 1,673 | 80.51% | 71.43% | 2,078 |
| Haskell | 1,840 | 83.11% | 353 | 15.94% | 15 | 0.68% | 6 | 0.27% | 0 | 0.00% | 1,487 | 67.16% | 65.56% | 2,214 |
| Hays | 47,680 | 43.59% | 59,524 | 54.41% | 1,735 | 1.59% | 418 | 0.38% | 38 | 0.03% | −11,844 | −10.83% | 71.57% | 109,395 |
| Hemphill | 1,486 | 86.40% | 206 | 11.98% | 25 | 1.45% | 3 | 0.17% | 0 | 0.00% | 1,280 | 74.42% | 73.04% | 1,720 |
| Henderson | 28,911 | 79.61% | 7,060 | 19.44% | 264 | 0.73% | 75 | 0.21% | 7 | 0.02% | 21,851 | 60.17% | 66.44% | 36,317 |
| Hidalgo | 90,527 | 40.98% | 128,199 | 58.04% | 1,261 | 0.57% | 865 | 0.39% | 32 | 0.01% | −37,672 | −17.06% | 56.45% | 220,884 |
| Hill | 11,926 | 79.87% | 2,860 | 19.15% | 119 | 0.80% | 26 | 0.17% | 0 | 0.00% | 9,066 | 60.72% | 63.20% | 14,931 |
| Hockley | 6,536 | 80.69% | 1,482 | 18.30% | 61 | 0.75% | 16 | 0.20% | 5 | 0.06% | 5,054 | 62.40% | 58.78% | 8,100 |
| Hood | 26,496 | 81.42% | 5,648 | 17.36% | 319 | 0.98% | 71 | 0.22% | 7 | 0.02% | 20,848 | 64.07% | 72.59% | 32,541 |
| Hopkins | 12,719 | 79.79% | 3,046 | 19.11% | 143 | 0.90% | 31 | 0.19% | 2 | 0.01% | 9,673 | 60.68% | 66.55% | 15,941 |
| Houston | 7,060 | 74.80% | 2,314 | 24.52% | 56 | 0.59% | 7 | 0.07% | 1 | 0.01% | 4,746 | 50.29% | 70.20% | 9,438 |
| Howard | 8,054 | 78.64% | 2,069 | 20.20% | 89 | 0.87% | 28 | 0.27% | 1 | 0.01% | 5,985 | 58.44% | 58.43% | 10,241 |
| Hudspeth | 779 | 66.87% | 371 | 31.85% | 10 | 0.86% | 5 | 0.43% | 0 | 0.00% | 408 | 35.02% | 55.88% | 1,165 |
| Hunt | 29,163 | 75.56% | 8,906 | 23.07% | 434 | 1.12% | 71 | 0.18% | 23 | 0.06% | 20,257 | 52.48% | 65.01% | 38,597 |
| Hutchinson | 7,681 | 87.55% | 965 | 11.00% | 115 | 1.31% | 10 | 0.11% | 2 | 0.02% | 6,716 | 76.55% | 64.83% | 8,773 |
| Irion | 759 | 85.38% | 120 | 13.50% | 8 | 0.90% | 2 | 0.22% | 0 | 0.00% | 639 | 71.88% | 68.49% | 889 |
| Jack | 3,418 | 90.38% | 331 | 8.75% | 24 | 0.63% | 9 | 0.24% | 0 | 0.00% | 3,087 | 81.62% | 71.98% | 3,782 |
| Jackson | 5,231 | 82.34% | 1,033 | 16.26% | 53 | 0.83% | 23 | 0.36% | 13 | 0.20% | 4,198 | 66.08% | 67.00% | 6,353 |
| Jasper | 12,542 | 80.34% | 2,954 | 18.92% | 105 | 0.67% | 7 | 0.04% | 3 | 0.02% | 9,588 | 61.42% | 66.79% | 15,611 |
| Jeff Davis | 784 | 60.08% | 501 | 38.39% | 17 | 1.30% | 3 | 0.23% | 0 | 0.00% | 283 | 21.69% | 78.14% | 1,305 |
| Jefferson | 47,570 | 50.20% | 46,073 | 48.62% | 897 | 0.95% | 199 | 0.21% | 20 | 0.02% | 1,497 | 1.58% | 63.44% | 94,759 |
| Jim Hogg | 833 | 40.91% | 1,197 | 58.79% | 4 | 0.20% | 2 | 0.10% | 0 | 0.00% | −364 | −17.88% | 53.58% | 2,036 |
| Jim Wells | 7,453 | 54.52% | 6,119 | 44.77% | 69 | 0.50% | 28 | 0.20% | 0 | 0.00% | 1,334 | 9.76% | 51.32% | 13,669 |
| Johnson | 54,628 | 75.85% | 16,464 | 22.86% | 771 | 1.07% | 142 | 0.20% | 15 | 0.02% | 38,164 | 52.99% | 68.22% | 72,020 |
| Jones | 5,660 | 83.96% | 999 | 14.82% | 63 | 0.93% | 19 | 0.28% | 0 | 0.00% | 4,661 | 69.14% | 69.96% | 6,741 |
| Karnes | 3,968 | 75.55% | 1,234 | 23.50% | 30 | 0.57% | 17 | 0.32% | 3 | 0.06% | 2,734 | 52.06% | 62.83% | 5,252 |
| Kaufman | 37,624 | 66.34% | 18,405 | 32.45% | 528 | 0.93% | 146 | 0.26% | 15 | 0.03% | 19,219 | 33.89% | 69.25% | 56,718 |
| Kendall | 20,083 | 75.92% | 6,020 | 22.76% | 289 | 1.09% | 46 | 0.17% | 14 | 0.05% | 14,063 | 53.16% | 78.18% | 26,452 |
| Kenedy | 127 | 65.46% | 65 | 33.51% | 1 | 0.52% | 1 | 0.52% | 0 | 0.00% | 62 | 31.96% | 65.54% | 194 |
| Kent | 411 | 88.96% | 47 | 10.17% | 1 | 0.22% | 3 | 0.65% | 0 | 0.00% | 364 | 78.79% | 78.04% | 462 |
| Kerr | 20,879 | 75.25% | 6,524 | 23.51% | 283 | 1.02% | 51 | 0.18% | 8 | 0.03% | 14,355 | 51.74% | 73.54% | 27,745 |
| Kimble | 1,987 | 86.69% | 284 | 12.39% | 17 | 0.74% | 4 | 0.17% | 0 | 0.00% | 1,703 | 74.30% | 73.63% | 2,292 |
| King | 151 | 94.97% | 8 | 5.03% | 0 | 0.00% | 0 | 0.00% | 0 | 0.00% | 143 | 89.94% | 86.89% | 159 |
| Kinney | 1,144 | 71.37% | 446 | 27.82% | 11 | 0.69% | 2 | 0.12% | 0 | 0.00% | 698 | 43.54% | 70.62% | 1,603 |
| Kleberg | 5,504 | 50.29% | 5,314 | 48.56% | 97 | 0.89% | 29 | 0.26% | 0 | 0.00% | 190 | 1.74% | 58.37% | 10,944 |
| Knox | 1,180 | 81.04% | 265 | 18.20% | 7 | 0.48% | 4 | 0.27% | 0 | 0.00% | 915 | 62.84% | 60.90% | 1,456 |
| Lamar | 16,760 | 78.16% | 4,458 | 20.79% | 172 | 0.80% | 28 | 0.13% | 24 | 0.11% | 12,302 | 57.37% | 66.20% | 21,442 |
| Lamb | 3,521 | 79.84% | 840 | 19.05% | 40 | 0.91% | 7 | 0.16% | 2 | 0.05% | 2,681 | 60.79% | 54.55% | 4,410 |
| Lampasas | 8,086 | 77.76% | 2,144 | 20.62% | 145 | 1.39% | 24 | 0.23% | 0 | 0.00% | 5,942 | 57.14% | 67.42% | 10,399 |
| La Salle | 1,335 | 55.49% | 1,052 | 43.72% | 12 | 0.50% | 7 | 0.29% | 0 | 0.00% | 283 | 11.76% | 54.36% | 2,406 |
| Lavaca | 8,804 | 86.34% | 1,333 | 13.07% | 46 | 0.45% | 8 | 0.08% | 6 | 0.06% | 7,471 | 73.27% | 74.64% | 10,197 |
| Lee | 6,255 | 77.35% | 1,750 | 21.64% | 65 | 0.80% | 16 | 0.20% | 1 | 0.01% | 4,505 | 55.71% | 72.56% | 8,087 |
| Leon | 7,523 | 86.73% | 1,072 | 12.36% | 57 | 0.66% | 14 | 0.16% | 8 | 0.09% | 6,451 | 74.37% | 73.97% | 8,674 |
| Liberty | 23,302 | 79.44% | 5,785 | 19.72% | 218 | 0.74% | 29 | 0.10% | 0 | 0.00% | 17,517 | 59.72% | 63.56% | 29,334 |
| Limestone | 6,789 | 74.65% | 2,213 | 24.33% | 66 | 0.73% | 27 | 0.30% | 0 | 0.00% | 4,576 | 50.31% | 65.14% | 9,095 |
| Lipscomb | 1,205 | 89.06% | 131 | 9.68% | 17 | 1.26% | 0 | 0.00% | 0 | 0.00% | 1,074 | 79.38% | 68.44% | 1,353 |
| Live Oak | 4,199 | 83.08% | 819 | 16.20% | 30 | 0.59% | 6 | 0.12% | 0 | 0.00% | 3,380 | 66.88% | 66.75% | 5,054 |
| Llano | 10,079 | 79.61% | 2,465 | 19.47% | 99 | 0.78% | 16 | 0.13% | 1 | 0.01% | 7,614 | 60.14% | 75.86% | 12,660 |
| Loving | 60 | 90.91% | 4 | 6.06% | 2 | 3.03% | 0 | 0.00% | 0 | 0.00% | 56 | 84.85% | 59.46% | 66 |
| Lubbock | 78,861 | 65.27% | 40,017 | 33.12% | 1,617 | 1.34% | 276 | 0.23% | 46 | 0.04% | 38,844 | 32.15% | 65.90% | 120,817 |
| Lynn | 1,853 | 80.81% | 428 | 18.67% | 10 | 0.44% | 2 | 0.09% | 0 | 0.00% | 1,425 | 62.15% | 56.93% | 2,293 |
| McCulloch | 2,904 | 84.52% | 490 | 14.26% | 36 | 1.05% | 6 | 0.17% | 0 | 0.00% | 2,414 | 70.26% | 64.09% | 3,436 |
| Mclennan | 59,543 | 60.84% | 36,688 | 37.49% | 1,297 | 1.33% | 243 | 0.25% | 101 | 0.10% | 22,855 | 23.35% | 65.48% | 97,872 |
| McMullen | 460 | 89.15% | 53 | 10.27% | 2 | 0.39% | 1 | 0.19% | 0 | 0.00% | 407 | 78.88% | 73.09% | 516 |
| Madison | 4,169 | 78.69% | 1,088 | 20.54% | 30 | 0.57% | 10 | 0.19% | 1 | 0.02% | 3,081 | 58.15% | 67.73% | 5,298 |
| Marion | 3,470 | 71.34% | 1,339 | 27.53% | 47 | 0.97% | 8 | 0.16% | 0 | 0.00% | 2,131 | 43.81% | 64.03% | 4,864 |
| Martin | 1,857 | 85.97% | 288 | 13.33% | 13 | 0.60% | 2 | 0.09% | 0 | 0.00% | 1,569 | 72.64% | 62.30% | 2,160 |
| Mason | 1,991 | 80.48% | 457 | 18.47% | 19 | 0.77% | 2 | 0.08% | 5 | 0.20% | 1,534 | 62.00% | 78.09% | 2,474 |
| Matagorda | 9,845 | 71.72% | 3,733 | 27.19% | 115 | 0.84% | 33 | 0.24% | 1 | 0.01% | 6,112 | 44.53% | 62.32% | 13,727 |
| Maverick | 6,881 | 44.84% | 8,332 | 54.29% | 73 | 0.48% | 60 | 0.39% | 0 | 0.00% | −1,451 | −9.46% | 46.43% | 15,346 |
| Medina | 15,642 | 69.04% | 6,773 | 29.89% | 184 | 0.81% | 45 | 0.20% | 13 | 0.06% | 8,869 | 39.14% | 67.11% | 22,657 |
| Menard | 823 | 80.06% | 197 | 19.16% | 6 | 0.58% | 2 | 0.19% | 0 | 0.00% | 626 | 60.89% | 69.98% | 1,028 |
| Midland | 45,624 | 77.51% | 12,329 | 20.95% | 777 | 1.32% | 126 | 0.21% | 3 | 0.01% | 33,295 | 56.57% | 65.12% | 58,859 |
| Milam | 7,984 | 75.48% | 2,496 | 23.60% | 72 | 0.68% | 24 | 0.23% | 2 | 0.02% | 5,488 | 51.88% | 66.79% | 10,578 |
| Mills | 2,217 | 88.50% | 271 | 10.82% | 15 | 0.60% | 2 | 0.08% | 0 | 0.00% | 1,946 | 77.68% | 73.05% | 2,505 |
| Mitchell | 2,170 | 84.14% | 397 | 15.39% | 11 | 0.43% | 1 | 0.04% | 0 | 0.00% | 1,773 | 68.75% | 57.01% | 2,579 |
| Montague | 8,615 | 87.74% | 1,097 | 11.17% | 78 | 0.79% | 24 | 0.24% | 5 | 0.05% | 7,518 | 76.57% | 70.13% | 9,819 |
| Montgomery | 193,382 | 71.22% | 74,377 | 27.39% | 3,166 | 1.17% | 526 | 0.19% | 92 | 0.03% | 119,005 | 43.83% | 73.38% | 271,543 |
| Moore | 4,359 | 79.14% | 1,062 | 19.28% | 66 | 1.20% | 21 | 0.38% | 0 | 0.00% | 3,297 | 59.86% | 55.11% | 5,508 |
| Morris | 3,872 | 69.30% | 1,669 | 29.87% | 36 | 0.64% | 10 | 0.18% | 0 | 0.00% | 2,203 | 39.43% | 65.09% | 5,587 |
| Motley | 604 | 92.64% | 46 | 7.06% | 2 | 0.31% | 0 | 0.00% | 0 | 0.00% | 558 | 85.58% | 75.90% | 652 |
| Nacogdoches | 17,378 | 64.88% | 9,000 | 33.60% | 302 | 1.13% | 83 | 0.31% | 22 | 0.08% | 8,378 | 31.28% | 69.06% | 26,785 |
| Navarro | 13,800 | 72.16% | 5,101 | 26.67% | 167 | 0.87% | 53 | 0.28% | 2 | 0.01% | 8,699 | 45.49% | 63.83% | 19,123 |
| Newton | 4,882 | 80.11% | 1,173 | 19.25% | 34 | 0.56% | 5 | 0.08% | 0 | 0.00% | 3,709 | 60.86% | 64.83% | 6,094 |
| Nolan | 4,131 | 77.11% | 1,162 | 21.69% | 53 | 0.99% | 10 | 0.19% | 1 | 0.02% | 2,969 | 55.42% | 60.39% | 5,357 |
| Nueces | 64,617 | 50.75% | 60,925 | 47.85% | 1,404 | 1.10% | 368 | 0.29% | 8 | 0.01% | 3,692 | 2.90% | 60.16% | 127,322 |
| Ochiltree | 2,812 | 89.10% | 302 | 9.57% | 37 | 1.17% | 3 | 0.10% | 2 | 0.06% | 2,510 | 79.53% | 60.79% | 3,156 |
| Oldham | 917 | 90.88% | 81 | 8.03% | 10 | 0.99% | 1 | 0.10% | 0 | 0.00% | 836 | 82.85% | 70.81% | 1,009 |
| Orange | 29,186 | 81.09% | 6,357 | 17.66% | 376 | 1.04% | 51 | 0.14% | 24 | 0.07% | 22,829 | 63.42% | 66.11% | 35,994 |
| Palo Pinto | 10,179 | 81.50% | 2,178 | 17.44% | 101 | 0.81% | 27 | 0.22% | 4 | 0.03% | 8,001 | 64.06% | 65.92% | 12,489 |
| Panola | 9,326 | 81.44% | 2,057 | 17.96% | 57 | 0.50% | 11 | 0.10% | 0 | 0.00% | 7,269 | 63.48% | 68.13% | 11,451 |
| Parker | 62,045 | 81.50% | 13,017 | 17.10% | 880 | 1.16% | 158 | 0.21% | 28 | 0.04% | 49,028 | 64.40% | 73.20% | 76,128 |
| Parmer | 2,135 | 80.57% | 488 | 18.42% | 23 | 0.87% | 4 | 0.15% | 0 | 0.00% | 1,647 | 62.15% | 58.41% | 2,650 |
| Pecos | 3,215 | 68.87% | 1,382 | 29.61% | 50 | 1.07% | 21 | 0.45% | 0 | 0.00% | 1,833 | 39.27% | 56.09% | 4,668 |
| Polk | 18,573 | 76.79% | 5,387 | 22.27% | 171 | 0.71% | 50 | 0.21% | 5 | 0.02% | 13,186 | 54.52% | 59.69% | 24,186 |
| Potter | 22,820 | 68.45% | 9,921 | 29.76% | 454 | 1.36% | 126 | 0.38% | 16 | 0.05% | 12,899 | 38.69% | 57.74% | 33,337 |
| Presidio | 721 | 32.52% | 1,463 | 65.99% | 21 | 0.95% | 12 | 0.54% | 0 | 0.00% | −742 | −33.47% | 46.29% | 2,217 |
| Rains | 5,155 | 85.16% | 842 | 13.91% | 43 | 0.71% | 13 | 0.21% | 0 | 0.00% | 4,313 | 71.25% | 72.75% | 6,053 |
| Randall | 50,796 | 78.54% | 12,802 | 19.79% | 910 | 1.41% | 129 | 0.20% | 37 | 0.06% | 37,994 | 58.75% | 69.31% | 64,674 |
| Reagan | 942 | 83.81% | 172 | 15.30% | 7 | 0.62% | 3 | 0.27% | 0 | 0.00% | 770 | 68.51% | 59.82% | 1,124 |
| Real | 1,643 | 82.90% | 320 | 16.15% | 14 | 0.71% | 5 | 0.25% | 0 | 0.00% | 1,323 | 66.75% | 73.35% | 1,982 |
| Red River | 4,517 | 77.80% | 1,246 | 21.46% | 36 | 0.62% | 7 | 0.12% | 0 | 0.00% | 3,271 | 56.34% | 68.39% | 5,806 |
| Reeves | 2,254 | 61.10% | 1,395 | 37.82% | 30 | 0.81% | 8 | 0.22% | 2 | 0.05% | 859 | 23.29% | 48.81% | 3,689 |
| Refugio | 2,210 | 65.66% | 1,108 | 32.92% | 26 | 0.77% | 21 | 0.62% | 1 | 0.03% | 1,102 | 32.74% | 67.23% | 3,366 |
| Roberts | 529 | 96.18% | 17 | 3.09% | 4 | 0.73% | 0 | 0.00% | 0 | 0.00% | 512 | 93.09% | 80.88% | 550 |
| Robertson | 5,646 | 69.71% | 2,374 | 29.31% | 66 | 0.81% | 13 | 0.16% | 0 | 0.00% | 3,272 | 40.40% | 68.38% | 8,099 |
| Rockwall | 36,726 | 68.15% | 16,412 | 30.45% | 611 | 1.13% | 121 | 0.22% | 21 | 0.04% | 20,314 | 37.69% | 75.79% | 53,891 |
| Runnels | 3,807 | 86.35% | 552 | 12.52% | 39 | 0.88% | 11 | 0.25% | 0 | 0.00% | 3,255 | 73.83% | 62.76% | 4,409 |
| Rusk | 16,534 | 77.34% | 4,629 | 21.65% | 155 | 0.73% | 50 | 0.23% | 9 | 0.04% | 11,905 | 55.69% | 66.00% | 21,377 |
| Sabine | 4,784 | 87.12% | 669 | 12.18% | 27 | 0.49% | 7 | 0.13% | 4 | 0.07% | 4,115 | 74.94% | 68.21% | 5,491 |
| San Augustine | 3,007 | 75.14% | 980 | 24.49% | 13 | 0.32% | 2 | 0.05% | 0 | 0.00% | 2,027 | 50.65% | 65.52% | 4,002 |
| San Jacinto | 10,161 | 80.39% | 2,337 | 18.49% | 101 | 0.80% | 39 | 0.31% | 2 | 0.02% | 7,824 | 61.90% | 66.64% | 12,640 |
| San Patricio | 16,516 | 63.79% | 8,988 | 34.71% | 291 | 1.12% | 93 | 0.36% | 3 | 0.01% | 7,528 | 29.08% | 59.87% | 25,891 |
| San Saba | 2,308 | 88.70% | 287 | 11.03% | 7 | 0.27% | 0 | 0.00% | 0 | 0.00% | 2,021 | 77.67% | 68.91% | 2,602 |
| Schleicher | 940 | 81.10% | 211 | 18.21% | 6 | 0.52% | 2 | 0.17% | 0 | 0.00% | 729 | 62.90% | 67.82% | 1,159 |
| Scurry | 4,983 | 84.89% | 818 | 13.94% | 53 | 0.90% | 15 | 0.26% | 1 | 0.02% | 4,165 | 70.95% | 61.86% | 5,870 |
| Shackelford | 1,484 | 91.15% | 130 | 7.99% | 10 | 0.61% | 4 | 0.25% | 0 | 0.00% | 1,354 | 83.17% | 70.17% | 1,628 |
| Shelby | 7,975 | 79.06% | 2,068 | 20.50% | 37 | 0.37% | 4 | 0.04% | 3 | 0.03% | 5,907 | 58.56% | 64.78% | 10,087 |
| Sherman | 886 | 89.31% | 91 | 9.17% | 9 | 0.91% | 5 | 0.50% | 1 | 0.10% | 795 | 80.14% | 65.26% | 992 |
| Smith | 69,080 | 69.02% | 29,615 | 29.59% | 1,126 | 1.12% | 254 | 0.25% | 14 | 0.01% | 39,465 | 39.43% | 68.48% | 100,089 |
| Somervell | 4,105 | 82.98% | 768 | 15.52% | 56 | 1.13% | 10 | 0.20% | 8 | 0.16% | 3,337 | 67.46% | 73.70% | 4,947 |
| Starr | 8,247 | 47.06% | 9,123 | 52.06% | 92 | 0.52% | 63 | 0.36% | 0 | 0.00% | −876 | −5.00% | 51.47% | 17,525 |
| Stephens | 3,385 | 89.08% | 397 | 10.45% | 16 | 0.42% | 2 | 0.05% | 0 | 0.00% | 2,988 | 78.63% | 67.00% | 3,800 |
| Sterling | 584 | 91.39% | 51 | 7.98% | 1 | 0.16% | 3 | 0.47% | 0 | 0.00% | 533 | 83.41% | 68.05% | 639 |
| Stonewall | 615 | 83.56% | 116 | 15.76% | 4 | 0.54% | 1 | 0.14% | 0 | 0.00% | 499 | 67.80% | 77.23% | 736 |
| Sutton | 1,222 | 78.48% | 322 | 20.68% | 9 | 0.58% | 4 | 0.26% | 0 | 0.00% | 900 | 57.80% | 63.58% | 1,557 |
| Swisher | 1,845 | 78.34% | 478 | 20.30% | 22 | 0.93% | 10 | 0.42% | 0 | 0.00% | 1,367 | 58.05% | 59.76% | 2,355 |
| Tarrant | 409,741 | 49.09% | 411,567 | 49.31% | 10,368 | 1.24% | 2,617 | 0.31% | 404 | 0.05% | −1,826 | −0.22% | 68.84% | 834,697 |
| Taylor | 39,547 | 71.73% | 14,588 | 26.46% | 827 | 1.50% | 150 | 0.27% | 23 | 0.04% | 24,959 | 45.27% | 65.88% | 55,135 |
| Terrell | 334 | 72.93% | 119 | 25.98% | 3 | 0.66% | 2 | 0.44% | 0 | 0.00% | 215 | 46.94% | 68.05% | 458 |
| Terry | 2,812 | 77.85% | 757 | 20.96% | 33 | 0.91% | 10 | 0.28% | 0 | 0.00% | 2,055 | 56.89% | 54.82% | 3,612 |
| Throckmorton | 806 | 90.16% | 82 | 9.17% | 5 | 0.56% | 1 | 0.11% | 0 | 0.00% | 724 | 80.98% | 73.52% | 894 |
| Titus | 7,570 | 71.81% | 2,856 | 27.09% | 94 | 0.89% | 19 | 0.18% | 2 | 0.02% | 4,714 | 44.72% | 59.67% | 10,541 |
| Tom Green | 32,313 | 71.47% | 12,239 | 27.07% | 546 | 1.21% | 96 | 0.21% | 16 | 0.04% | 20,074 | 44.40% | 64.51% | 45,210 |
| Travis | 161,337 | 26.51% | 435,860 | 71.62% | 8,905 | 1.46% | 2,094 | 0.34% | 379 | 0.06% | −274,523 | −45.11% | 71.21% | 608,575 |
| Trinity | 5,579 | 80.41% | 1,323 | 19.07% | 25 | 0.36% | 11 | 0.16% | 0 | 0.00% | 4,256 | 61.34% | 60.12% | 6,938 |
| Tyler | 8,194 | 84.82% | 1,403 | 14.52% | 52 | 0.54% | 11 | 0.11% | 0 | 0.00% | 6,791 | 70.30% | 66.36% | 9,660 |
| Upshur | 15,809 | 83.68% | 2,877 | 15.23% | 179 | 0.95% | 22 | 0.12% | 5 | 0.03% | 12,932 | 68.45% | 66.01% | 18,892 |
| Upton | 1,178 | 86.11% | 170 | 12.43% | 13 | 0.95% | 7 | 0.51% | 0 | 0.00% | 1,008 | 73.68% | 61.98% | 1,368 |
| Uvalde | 6,174 | 59.69% | 4,073 | 39.38% | 66 | 0.64% | 29 | 0.28% | 2 | 0.02% | 2,101 | 20.31% | 59.38% | 10,344 |
| Val Verde | 8,284 | 54.21% | 6,771 | 44.31% | 170 | 1.11% | 47 | 0.31% | 8 | 0.05% | 1,513 | 9.90% | 52.82% | 15,280 |
| Van Zandt | 22,270 | 85.56% | 3,516 | 13.51% | 175 | 0.67% | 33 | 0.13% | 35 | 0.13% | 18,754 | 72.05% | 66.80% | 26,029 |
| Victoria | 23,358 | 68.32% | 10,380 | 30.36% | 339 | 0.99% | 103 | 0.30% | 8 | 0.02% | 12,978 | 37.96% | 60.39% | 34,188 |
| Walker | 15,375 | 65.12% | 7,884 | 33.39% | 287 | 1.22% | 63 | 0.27% | 3 | 0.01% | 7,491 | 31.73% | 67.39% | 23,612 |
| Waller | 14,260 | 62.73% | 8,191 | 36.03% | 201 | 0.88% | 82 | 0.36% | 0 | 0.00% | 6,069 | 26.70% | 64.74% | 22,734 |
| Ward | 3,241 | 79.83% | 764 | 18.82% | 29 | 0.71% | 26 | 0.64% | 0 | 0.00% | 2,477 | 61.01% | 59.01% | 4,060 |
| Washington | 12,959 | 74.36% | 4,261 | 24.45% | 178 | 1.02% | 20 | 0.11% | 9 | 0.05% | 8,698 | 49.91% | 72.77% | 17,427 |
| Webb | 25,898 | 37.86% | 41,820 | 61.14% | 446 | 0.65% | 233 | 0.34% | 0 | 0.00% | −15,922 | −23.28% | 49.62% | 68,397 |
| Wharton | 11,926 | 71.15% | 4,694 | 28.01% | 105 | 0.63% | 36 | 0.21% | 0 | 0.00% | 7,232 | 43.15% | 65.23% | 16,761 |
| Wheeler | 2,159 | 92.38% | 168 | 7.19% | 7 | 0.30% | 3 | 0.13% | 0 | 0.00% | 1,991 | 85.19% | 66.51% | 2,337 |
| Wichita | 32,069 | 69.65% | 13,161 | 28.59% | 675 | 1.47% | 125 | 0.27% | 10 | 0.02% | 18,908 | 41.07% | 55.09% | 46,040 |
| Wilbarger | 3,524 | 77.90% | 956 | 21.13% | 33 | 0.73% | 11 | 0.24% | 0 | 0.00% | 2,568 | 56.76% | 55.20% | 4,524 |
| Willacy | 2,441 | 43.99% | 3,108 | 56.01% | 0 | 0.00% | 0 | 0.00% | 0 | 0.00% | −667 | −12.02% | 43.34% | 5,549 |
| Williamson | 139,729 | 48.26% | 143,795 | 49.66% | 4,998 | 1.73% | 790 | 0.27% | 243 | 0.08% | −4,066 | −1.40% | 76.87% | 289,555 |
| Wilson | 18,463 | 73.81% | 6,350 | 25.39% | 151 | 0.60% | 39 | 0.16% | 10 | 0.04% | 12,113 | 48.43% | 71.39% | 25,013 |
| Winkler | 1,753 | 82.46% | 358 | 16.84% | 14 | 0.66% | 1 | 0.05% | 0 | 0.00% | 1,395 | 65.62% | 52.98% | 2,126 |
| Wise | 27,032 | 83.52% | 4,973 | 15.37% | 310 | 0.96% | 47 | 0.15% | 3 | 0.01% | 22,059 | 68.16% | 70.91% | 32,365 |
| Wood | 19,049 | 83.63% | 3,509 | 15.40% | 175 | 0.77% | 40 | 0.18% | 6 | 0.03% | 15,540 | 68.22% | 70.34% | 22,779 |
| Yoakum | 2,174 | 82.63% | 420 | 15.96% | 31 | 1.18% | 6 | 0.23% | 0 | 0.00% | 1,754 | 66.67% | 59.70% | 2,631 |
| Young | 7,110 | 86.30% | 1,034 | 12.55% | 76 | 0.92% | 18 | 0.22% | 1 | 0.01% | 6,076 | 73.75% | 70.01% | 8,239 |
| Zapata | 2,033 | 52.48% | 1,826 | 47.13% | 11 | 0.28% | 4 | 0.10% | 0 | 0.00% | 207 | 5.34% | 46.92% | 3,874 |
| Zavala | 1,490 | 34.03% | 2,864 | 65.40% | 13 | 0.30% | 12 | 0.27% | 0 | 0.00% | −1,374 | −31.38% | 54.29% | 4,379 |
| Total | 5,890,347 | 52.06% | 5,259,126 | 46.48% | 126,243 | 1.12% | 33,396 | 0.30% | 5,944 | 0.05% | 631,221 | 5.58% | 66.73% | 11,315,056 |
| Trump/Pence Republican |
Biden/Harris Democratic |
Jorgensen/Cohen Libertarian |
Hawkins/Walker Green |
Others | Margin | Turnout | Total votes | |||||||
Counties that flipped from Democratic to Republican
- Frio (largest municipality: Pearsall)
- Jim Wells (largest municipality: Alice)
- Kenedy (largest municipality: Sarita)
- Kleberg (largest municipality: Kingsville)
- La Salle (largest municipality: Cotulla)
- Reeves (largest municipality: Pecos)
- Val Verde (largest municipality: Del Rio)
- Zapata (largest municipality: Zapata)
Counties that flipped from Republican to Democratic
- Hays (largest municipality: San Marcos)
- Tarrant (largest municipality: Fort Worth)
- Williamson (largest municipality: Round Rock)
Dianne Solis et al of The Dallas Morning News stated that according to polls, "Democrat Joe Biden overwhelmingly won the Latino vote in Texas' urban areas".[70]
In the Rio Grande Valley, which historically votes Democratic, Biden's lead narrowed from the previous election.[70]
By congressional district
Trump won 22 out of the 36 congressional districts in Texas.
See also
Notes
- Partisan clients
- Poll sponsored by the Texas arm of the party which nominated Biden prior to this poll's sampling period
- The Blue Texas PAC exclusively supports Democratic candidates
- The Human Rights Campaign endorsed Biden prior to this poll's sampling period
- Poll sponsored by the Texas arm of the party which nominated Biden prior to this poll's sampling period
- Poll sponsored by the Defend Students Action Fund.
- Giffords' founder, Gabby Giffords, endorsed Biden prior to this poll's sampling period
- The Consumer Energy Alliance is a pro-Keystone XL lobbying group
- The Texas Democratic Party exclusively supports Democratic candidates
- Poll sponsored by Chrysta Castañeda's campaign
- Size of "extremely likely to vote" sample not yet released
- This poll's sponsor is the American Principles Project, a 501(c)(4) organization that supports the Republican Party.
- Poll sponsored by Progress Texas, an organisation promoting progressive policies
- Poll sponsored by the Texas Democratic Party
- By the time of this poll, Data for Progress, which has worked with both the Sanders and Warren campaigns, had endorsed Warren
- Poll sponsored by Democracy Toolbox
- Poll sponsored by Courageous Conservatives PAC
- Samples
- Calculated by taking the difference of 100% and all other candidates combined.
- Key:
A – all adults
RV – registered voters
LV – likely voters
V – unclear - Overlapping sample with the previous SurveyMonkey/Axios poll, but more information available regarding sample size
- "Other candidate or write-in" with 0%
- With voters who lean towards a given candidate
- "Someone else" with 2%
- Standard VI response
- "Someone else" with 2%
- Results generated with high Democratic turnout model
- "Someone else" with 2%
- Results generated with high Republican turnout model
- "Someone else" with 2%
- "Another candidate" with no voters
- "Someone else" and would not vote with 1%
- Includes "Refused"
- "Someone else" with 3%
- With voters who lean towards a given candidate
- "Someone else" with 1%
- With voters who lean towards a given candidate
- "Someone else" with 2%
- "Someone else" with 1%
- Standard IV response
- "Another candidate" with 1%
- With only Biden, Trump and "another candidate" as options
- "Another candidate" with 2%
- "Someone else" and would not vote with 0%
- Includes "Refused"
- "Someone else/third party" with 2%
- Overlapping sample with the previous Morning Consult poll, but more information available regarding sample size
- With voters who lean towards a given candidate
- Overlapping sample with the previous Morning Consult poll, but more information available regarding sample size
- "Refused" with 0%
- Overlapping sample with the previous and subsequent Morning Consult polls, but more information available regarding sample size
- "Another party candidate" with 2%
- Overlapping sample with the previous Morning Consult poll, but more information available regarding sample size
- "Someone else" with 2%
- Overlapping sample with the previous and subsequent Morning Consult polls, but more information available regarding sample size
- Not yet released
- "Someone else" with 4%; would not vote with 3%
- Not yet released
- "Someone else/third party" with 4%; would not vote with 0%
- Not yet released
- Not yet released
- "Other" with 4%; would not vote with 1%
- Not yet released
- Not yet released
- "Someone else" and would not vote with 3%
- Overlapping sample with the previous Morning Consult poll, but more information available regarding sample size
- Not yet released
- Not yet released
- Including voters who lean towards a given candidate
- Other with 1%; neither with 2%
- "Neither-other" with 10%
- Would not vote with 3%
- Other with 0%; neither with 2%
- "Someone else" with 9%
- Including voters who lean towards a given candidate
- Other with 0%; neither with 3%
- "Neither-other" with 12%
- Would not vote with 3%
- Other with 1%; neither with 3%
- "Someone else" with 9%
- Including voters who lean towards a given candidate
- Other with 0%; neither with 2%
- "Neither-other" with 12%
- Would not vote with 3%
- Other with 1%; neither with 2%
- "Someone else" with 10%
- Other with 0%; neither with 3%
- "Neither-other" with 9%
- Other with 0%; neither with 2%
- "Neither-other" with 16%
- Other with 0%; neither with 2%
- "Neither-other" with 15%
- Would not vote with 4%
- Other with 0%; neither with 2%
- "Neither-other" with 17%
- "Someone else" with 14%
- "Someone else" with 7%
- Not yet released
- Listed as the combination of these responses: "Definitely or probably would not vote to re-elect Donald Trump"
- Listed as the combination of these responses: "Definitely or probably would not vote to re-elect Donald Trump"
- Listed as the combination of these responses: "Definitely or probably would not vote to re-elect Donald Trump"
- "Would definitely not vote for Trump" with 48%
- "Would consider voting for Trump" with 14%; "Don't know/no answer" with 3%
- Listed as the combination of these responses: "Definitely or probably would not vote to re-elect Donald Trump"
- Listed as the combination of these responses: "Definitely or probably would not vote to re-elect Donald Trump"
References
- "Official Canvass Report - 2020 November 3rd General Election" (PDF). Texas Secretary of State. November 2020.
- Kelly, Ben (August 13, 2018). "US elections key dates: When are the 2018 midterms and the 2020 presidential campaign?". The Independent. Retrieved January 3, 2019.
- "Distribution of Electoral Votes". National Archives and Records Administration. Retrieved January 3, 2019.
- Ramsey, Ross (November 6, 2020). "Analysis: Texas voters elect to stay the course". The Texas Tribune. Retrieved November 10, 2020.
- "Texas 2020 President exit polls". www.cnn.com. Retrieved November 12, 2020.
- "Texas Voter Surveys: How Different Groups Voted". The New York Times. November 3, 2020. ISSN 0362-4331. Retrieved November 12, 2020.
- Hernández, Arelis R.; Martin, Brittney. "Why Texas's overwhelmingly Latino Rio Grande Valley turned toward Trump". The Washington Post. ISSN 0190-8286. Retrieved November 12, 2020.
- Dobbins, James; Fernandez, Manny (November 7, 2020). "In Texas, an Emerging Problem for Democrats on the Border". The New York Times. Retrieved November 10, 2020.
- Jacobson, Louis (November 10, 2020). "Biden Gained Votes Nationwide on the Way to Victory". U.S. News & World Report. Retrieved November 27, 2020.
- "Governor Greg Abbott for President in 2020?". News/Talk 95.1 & 790 KFYO.
- Garrett, Robert T. (March 8, 2018). "Texas Gov. Greg Abbott rules out running for president – in 2020, at least". Dallas News.
- https://results.texas-election.com/races
- Taylor, Kate (February 9, 2019). "Elizabeth Warren Formally Announces 2020 Presidential Bid in Lawrence, Mass". The New York Times. Retrieved February 10, 2019.
- Herndon, Astead W.; Burns, Alexander (December 31, 2018). "Elizabeth Warren Announces Iowa Trip as She Starts Running for President in 2020". The New York Times. Retrieved January 3, 2019.
- Arlette Saenz. "Joe Biden announces he is running for president in 2020". CNN. Retrieved May 18, 2019.
- "2020 MARCH 3RD DEMOCRATIC PRIMARY". Texas Secretary of State. Retrieved April 7, 2020.
- "Delegate Tracker". Associated Press. June 7, 2020. Retrieved June 7, 2020.
- "2020 Electoral College Ratings" (PDF). The Cook Political Report. Retrieved October 30, 2020.
- "POTUS Ratings | Inside Elections". insideelections.com. Retrieved October 28, 2020.
- "Larry J. Sabato's Crystal Ball » 2020 President". crystalball.centerforpolitics.org. Retrieved May 21, 2019.
- "2020 Election Forecast". Politico. November 19, 2019.
- "Battle for White House". RCP. April 19, 2019.
- Niskanen Center Electoral Map, Niskanen Center, March 24, 2020, retrieved: April 19, 2020
- David Chalian; Terence Burlij. "Road to 270". CNN. Retrieved October 30, 2020.
- "Forecasting the US elections". The Economist. Retrieved July 7, 2020.
- "2020 Election Battleground Tracker". CBS News. July 12, 2020. Retrieved July 13, 2020.
- "2020 Presidential Election Interactive Map". 270 to Win.
- "ABC News Race Ratings". CBS News. July 24, 2020. Retrieved July 24, 2020.
- "Final NPR Electoral Map: Biden Has The Edge, But Trump Retains Narrow Path". NPR.org. Retrieved October 30, 2020.
- "Road to 270: Choose potential paths to a White House victory". NBC News. Retrieved October 30, 2020.
- "2020 Election Forecast". FiveThirtyEight. Retrieved August 14, 2020.
- Harper, Karen Brooks (October 15, 2020). "Harris County tried to make voting easier during the pandemic. Texas Republicans fought every step of the way". Texas Tribune. Retrieved October 15, 2020.
- Rosenthal, Abigail (September 11, 2020). "Harris County implementing 24-hour polling locations for one day of early voting". Houston Chronicle. Retrieved October 15, 2020.
- Platoff, Emma (October 1, 2020). "Gov. Greg Abbott limits counties to one absentee ballot drop-off location, bolstering GOP efforts to restrict voting". The Texas Tribune. Retrieved November 23, 2020.
- McGuinness, Dylan (October 15, 2020). "Harris County, Texas GOP take drive-thru voting challenge to state Supreme Court". Houston Chronicle. Retrieved October 15, 2020.
- "Harris County Clerk's Drive-Thru Voting Pilot Is Highly Successful" (PDF). Harris County Clerk.
- Stern, Mark Joseph (October 31, 2020). "Texas Republicans Ask Federal Judge to Throw Out 117,000 Legally Cast Ballots". Slate. Retrieved October 31, 2002.
- Despart, Zach (October 22, 2020). "Texas Supreme Court allows Harris County drive-thru voting to continue". Houston Chronicle. Retrieved October 25, 2020.
- Medley, Alison (October 29, 2020). "Last-minute challenge threatens to reject thousands of drive-thru votes in Harris County". Houston Chronicle. Retrieved October 30, 2020.
- Scherer, Jasper (November 1, 2020). "Texas Supreme Court rejects GOP attempt to toss drive-thru votes; federal case remains pending". Houston Chronicle. Retrieved November 1, 2020.
- Montgomery, David; Corasaniti, Nick (November 1, 2020). "Texas' top court denies a G.O.P. push to throw out over 120,000 votes; a federal case is pending". The New York Times. ISSN 0362-4331. Retrieved November 1, 2020.
- Medley, Alison (November 2, 2020). "Federal judge rejects GOP-led challenge to toss out over 127,000 drive-thru ballots in Harris County". Houston Chronicle. Retrieved November 2, 2020.
- Hiller, Jennifer (November 2, 2020). "Texas Drive-Through Voting Upheld". Reuters. Retrieved November 3, 2020.
- Ferman, Mitchell (November 3, 2020). "Harris County voters will only have one drive-thru polling site on Election Day". The Texas Tribune. Retrieved November 23, 2020.
- "Federal judge rejects GOP push to toss 127,000 ballots in Texas". POLITICO. Retrieved November 23, 2020.
- Plasencia, Ariel (October 13, 2020). "Tarrant County launches new website that allows voters to check wait times at county polling locations". WFAA. Retrieved October 15, 2020.
- Ashley Killough, Ed Lavandera and Paul LeBlanc. "Texas governor limits election drop boxes to one per county in sprawling state". CNN.
- Ross Levitt and Chandelis Duster. "Federal judge blocks Texas governor's directive limiting ballot drop boxes to one per county". CNN.
- Goldenstein, Taylor (October 10, 2020). "Fifth Circuit stays lower court ruling allowing multiple ballot dropoff sites". HoustonChronicle.com.
- Abbot v. Anti-Defamation League Austin, Sw., & Texoma Regions, No. 20-0846, 2020 WL 6295076 (Tex. Oct. 27, 2020)(per curiam).
- Lindell, Chuck. "Appeals court upholds order against Abbott's limit on ballot drop sites". Austin American-Statesman.
- McCullough, Jolie (October 27, 2020). "Texas counties will only be allowed one drop-off location for mail-in ballots, state Supreme Court rules". The Texas Tribune.
- Wallace, Jeremy (October 14, 2020). "Texas surpassed 1 million votes on first day of early voting". Houston Chronicle. Retrieved October 15, 2020.
- Harris, Cayla (October 15, 2020). "Texas nears 2 million ballots cast as early voting surge continues". Houston Chronicle. Retrieved October 15, 2020.
- Lozano-Moreno, Luz (October 16, 2020). "Travis County early voting: 41,328 cast ballots Friday, clerk says". Austin American-Statesman. Retrieved October 17, 2020.
- Ahmed, Amal (November 2, 2020). "Millennials and Gen Zers are Breaking Voter Turnout Records in Texas". Texas Observer. Retrieved November 2, 2020.
- Joy, William (October 13, 2020). "Dallas County sees record turnout for first day of early voting, Tarrant County falls just short of 2016". WFAA. Retrieved October 15, 2020.
- Debenedetto, Paul (October 13, 2020). "Harris County Shatters Single-Day Early Voting Record". Houston Public Media. Retrieved October 15, 2020.
- Despart, Zach; Morris, Mike (October 14, 2020). "Harris County continues to set records with second day of 100,000-plus early voters". Houston Chronicle. Retrieved October 15, 2020.
- McGuinness, Dylan (October 15, 2020). "Harris County on pace for another 100,000 ballots cast today". Houston Chronicle. Retrieved October 15, 2020.
- "Another day, another 100,000 Harris County ballots cast Friday". Houston Chronicle. October 16, 2020. Retrieved October 16, 2020.
- Rosenthal, Abigail (October 23, 2020). "Harris County reaches 1 million ballots cast during early voting, breaking record". Houston Chronicle. Retrieved October 25, 2020.
- "Travis County early voting: 35,873 people cast ballots on first day". Austin American-Statesman. October 13, 2020. Retrieved October 15, 2020.
- Cobler, Nicole; Bradshaw, Kelsey (October 14, 2020). "Travis County breaks another record on 2nd day of early voting". Retrieved October 15, 2020.
- "Travis County early voting: More than 26,000 ballots cast by 3 p.m Thursday". Austin American Statesman. October 15, 2020. Retrieved October 15, 2020.
- Osborn, Claire (October 15, 2020). "Williamson County voter turnout reaches 17% in third day of early voting". Austin American Statesman. Retrieved October 15, 2020.
- Villarreal, Alexandra (October 26, 2020). "How Texas went from low voter turnout to nation's top early voting state". The Guardian. ISSN 0261-3077. Retrieved October 27, 2020.
- Cohen, Ethan; Stracqualursi, Veronica (October 30, 2020). "Texas' 2020 early voting surpasses total turnout in 2016 election". CNN. Retrieved October 30, 2020.
- "Official Canvass Report - 2020 November 3rd General Election" (PDF). Texas Secretary of State. November 2020.
- Solis, Dianne; Corchado, Alfredo; Morris, Allie; Cobler, Paul (November 6, 2020). "With the Latino vote up for grabs, how did Trump make inroads in South Texas?". The Dallas Morning News. Retrieved November 10, 2020.
Further reading
- "Democrats eye Arizona, Georgia and Texas as potentially winnable", Theguardian.com, UK, September 5, 2020
- Nick Corasaniti; Stephanie Saul; Patricia Mazzei (September 13, 2020), "Big Voting Decisions in Florida, Wisconsin, Texas: What They Mean for November", The New York Times, archived from the original on September 13, 2020,
Both parties are waging legal battles around the country over who gets to vote and how
- David Weigel; Lauren Tierney (October 4, 2020), "The seven political states of Texas", Washingtonpost.com, archived from the original on October 5, 2020
- David Wasserman (October 6, 2020), "The 10 Bellwether Counties That Show How Trump Is in Serious Trouble", Nytimes.com. (Describes bellwether Collin County, Texas)
- Carrasco, Luis (November 8, 2020). "Essay: What happened in the Valley? Latino voters were for Democrats to lose — and they did". Houston Chronicle. - Opinion piece
External links
- Elections Division at the Texas Secretary of State official website
- Texas at Ballotpedia
- Government Documents Round Table of the American Library Association, "Texas", Voting & Elections Toolkits
- "Texas: Election Tools, Deadlines, Dates, Rules, and Links", Vote.org, Oakland, CA
- University of Texas Libraries, "Voting and Elections", Research Guides
- "League of Women Voters of Texas". (State affiliate of the U.S. League of Women Voters)
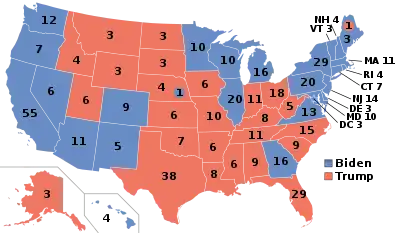
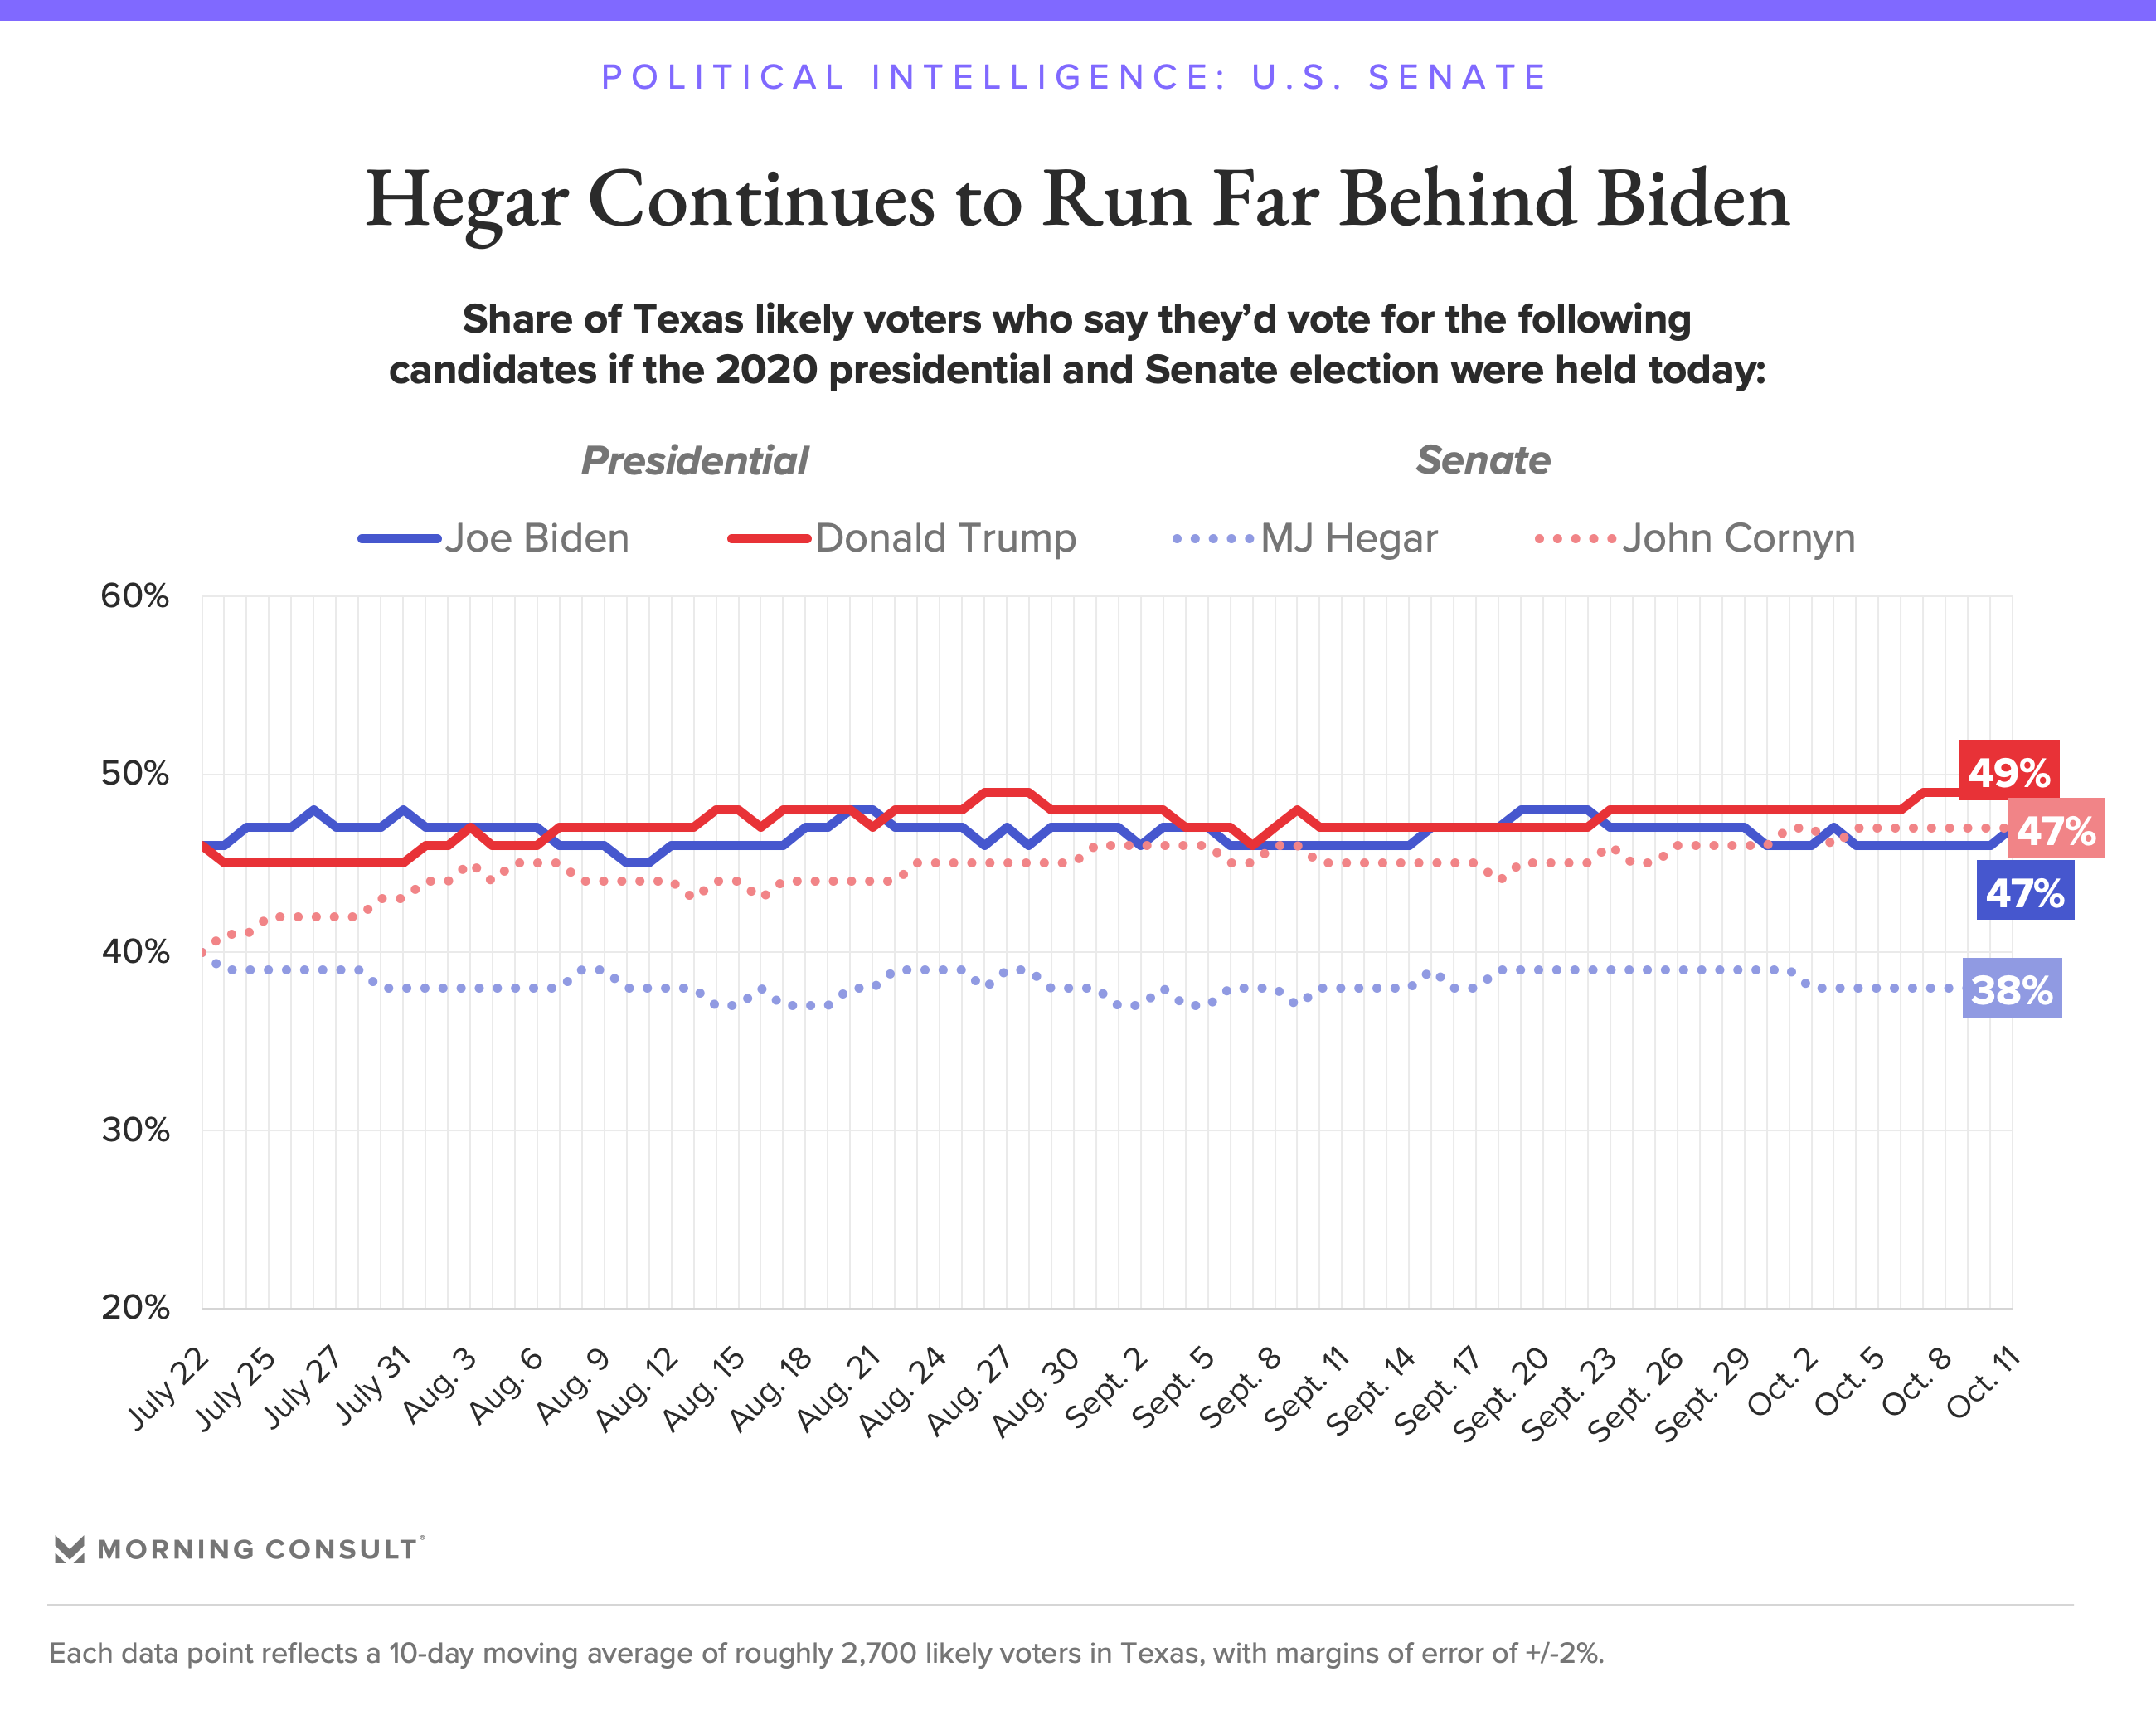