Toronto—St. Paul's
Toronto—St. Paul's is a federal electoral district in Toronto, Ontario, Canada, that has been represented in the House of Commons of Canada since 1935. Its current MP is Carolyn Bennett. Prior to the 2015 election, the riding was known as St. Paul's.[3]
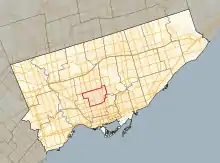 Location in Toronto | |||
| Federal electoral district | |||
| Legislature | House of Commons | ||
| MP |
Liberal | ||
| District created | 1933 | ||
| First contested | 1935 | ||
| Last contested | 2019 | ||
| District webpage | profile, map | ||
| Demographics | |||
| Population (2011)[1] | 103,983 | ||
| Electors (2015) | 75,852 | ||
| Area (km²)[2] | 14 | ||
| Pop. density (per km²) | 7,427.4 | ||
| Census division(s) | Toronto | ||
| Census subdivision(s) | Toronto | ||
.gif)
The small but densely populated riding covers the area to the north and northeast of Downtown Toronto (often called "Midtown" Toronto). In the past, it had been considered a bellwether riding, having been represented by only three opposition MPs. However, like most Toronto-based ridings, the Liberals have dominated recent elections. Since the Liberals won all but one seat in Ontario in their 1993 landslide, they have won all but one election in St. Paul's by 10,000 votes or more.
As of 2015, it includes the southern two-thirds of the wealthy Toronto neighbourhood of Forest Hill, plus the neighbourhoods of Deer Park, Davisville Village, Chaplin Estates, South Hill, Humewood-Cedarvale, the southern two-thirds of Fairbank, and the northern half of Summerhill.
Demographics
- According to the Canada 2006 Census
Ethnic groups: 76.08% White, 5.31% Black, 4.04% Filipino, 3.73% Chinese, 2.85% Latin American, 2.46% South Asian
Languages: 67.47% English, 1.87% French, 30.47% Others
Religions (2001): 29.28% Catholic, 25.01% Protestant, 19.60% Non religious, 14.03% Jewish, 4.18% Christian Orthodox, 2.62% Other Christian, 2.52% Muslim, 1.35% Buddhist
Average income: $34,617
History
It was created in 1933 from parts of Toronto East Centre, Toronto Northeast, Toronto South and Toronto West Centre ridings.
It consisted initially of the central part of the City of Toronto ("Downtown Toronto") It was bounded on the south by Toronto Bay, on the east by Sherbourne Street and on the north and west by a line drawn from Sherbourne Street west along Bloor Street, north along Yonge Street, northwest along the belt line railway, south and west along the western limit of the city, south along Dunvegan Road, east along St. Clair Avenue, south along Poplar Plains Road, west along Dupont Street, south along St. George and Beverley Streets, east along Queen Street, south along John Street.
In 1947, it was redefined to consist of the part of the city of Toronto bounded on the south by Toronto Bay, on the east by a line drawn from the Bay north along Sherbourne Street, west along Bloor Street East and north along Yonge Street, on the north by the south boundary of Ward Nine of the city of Toronto, and on the west by a line drawn from the Bay north on John Street, west along Queen Street West, north on Beverley Street and along St. George Street, east along Dupont Street, north along Davenport Road and Poplar Plains Road, west along St. Clair Avenue West, north along Dunvegan Road, east and north along the city limit to the southern boundary of Ward Nine.
In 1966, the southern part of the riding, what would be considered to be "Downtown Toronto" was removed from the electoral district (added to Rosedale electoral district) and the riding was shifted northward redefined to consist of the part of Metropolitan Toronto bounded by a line drawn from Bloor Street, north along Yonge Street, northwest along the Canadian National Railway line, north along Elmsthorpe Avenue, west along Eglinton Avenue, north along Castlewood Road, west along Briar Hill Avenue, south along Old Park Road and Glen Cedar Road, southeast along Claxton Boulevard, south along Bathurst Street and east along Bloor Street to Yonge Street.
In 1987, it was redefined to consist of the part of the cities of Toronto and York bounded by a line drawn from the Canadian Pacific Railway line north along Ossington Avenue, east along Davenport Road, north along Winona Drive, west along Eglinton Avenue West, north and east along the eastern limit of the City of York, east and north along the northern limit of the City of Toronto, south along Yonge Street and westerly along the CPR line to Ossington Avenue (removing lands between the CPR lands and Bloor Street).
In 1996, it was redefined to consist of the part of the cities of Toronto and York bounded by a line drawn from the Canadian Pacific Railway north along Ossington Avenue, east along Davenport Road, north along Winona Drive, west along Eglinton Avenue West, north along the eastern limit of the City of York, east along the northern limit of the City of Toronto, south along Bathurst Street, southeast along the Belt Line (formerly the Canadian National Railway), east along Eglinton Avenue West, north along Yonge Street, east along Broadway Avenue, south and east along the eastern limit of the City of Toronto, west along the south side of the Mount Pleasant Cemetery, south along the ravine situated east of Avoca Avenue, west along Rosehill Avenue, south and east along the west side of the Rosehill Reservoir, west along Woodlawn Avenue East, south along Yonge Street, and west along the Canadian Pacific Railway to Ossington Avenue.
In 2003, it was redefined to consist of the part of the City of Toronto bounded by a line drawn from the Canadian Pacific Railway north along Ossington Avenue, east along Davenport Road, north along Winona Drive, west along Holland Park Avenue, north along Oakwood Avenue, west along Rogers Road, north along Dufferin Street, east along Eglinton Avenue West, north along Yonge Street, east along Broadway Avenue, south along the former eastern limit of the City of Toronto, west along the south side of the Mount Pleasant Cemetery, southeast along the Don River Tributary situated east of Avoca Avenue, west along Rosehill Avenue, south along the west side of the Rosehill Reservoir, west along Jackes Avenue, south along Yonge Street and west along the Canadian Pacific Railway to Ossington Avenue.
In the 2012 electoral redistribution, St. Paul's lost territory to Don Valley West, gained a small fraction from Davenport and was renamed Toronto—St. Paul's.
Churches named for St Paul in the electoral district
From its creation until 1966, the electoral district included two prominent churches named for St Paul the apostle: St. Paul's, Bloor Street at 227 Bloor Street East, which is the largest Anglican church in Toronto by seating capacity; and St. Paul's-Avenue Road United Church at Avenue Road and Webster Avenue, which was the church of many of Toronto's elite. The electoral district ceased to include 227 Bloor Street East after a redefinition of the district's boundaries in 1966. In 1980, the congregation at St. Paul's-Avenue Road United Church moved to 427 Bloor Street West during a church merger creating Trinity-St. Paul's United Church. The electoral district ceased to include 427 Bloor Street West after a boundary redefinition in 1987. Therefore, Toronto—St Paul's no longer contains a St Paul's.
Members of Parliament
This riding has elected the following Members of Parliament:
| Parliament | Years | Member | Party | |
|---|---|---|---|---|
| St. Paul's Riding created from Toronto East Centre, Toronto Northeast, Toronto South and Toronto West Centre |
||||
| 18th | 1935–1940 | Douglas Ross | Conservative | |
| 19th | 1940–1945 | National Government | ||
| 20th | 1945–1949 | Progressive Conservative | ||
| 21st | 1949–1953 | James Rooney | Liberal | |
| 22nd | 1953–1957 | Roland Michener | Progressive Conservative | |
| 23rd | 1957–1958 | |||
| 24th | 1958–1962 | |||
| 25th | 1962–1963 | Ian Wahn | Liberal | |
| 26th | 1963–1965 | |||
| 27th | 1965–1968 | |||
| 28th | 1968–1972 | |||
| 29th | 1972–1974 | Ron Atkey | Progressive Conservative | |
| 30th | 1974–1979 | John Roberts | Liberal | |
| 31st | 1979–1980 | Ron Atkey | Progressive Conservative | |
| 32nd | 1980–1984 | John Roberts | Liberal | |
| 33rd | 1984–1988 | Barbara McDougall | Progressive Conservative | |
| 34th | 1988–1993 | |||
| 35th | 1993–1997 | Barry Campbell | Liberal | |
| 36th | 1997–2000 | Carolyn Bennett | ||
| 37th | 2000–2004 | |||
| 38th | 2004–2006 | |||
| 39th | 2006–2008 | |||
| 40th | 2008–2011 | |||
| 41st | 2011–2015 | |||
| Toronto—St. Paul's | ||||
| 42nd | 2015–2019 | Carolyn Bennett | Liberal | |
| 43rd | 2019–present | |||
Election results
Toronto—St. Paul's, 2015–present
| 2019 Canadian federal election | ||||||||
|---|---|---|---|---|---|---|---|---|
| Party | Candidate | Votes | % | ±% | Expenditures | |||
| Liberal | Carolyn Bennett | 32,494 | 54.3 | -0.96 | $88,263.67 | |||
| Conservative | Jae Truesdell | 12,933 | 21.6 | -5.39 | $95,161.27 | |||
| New Democratic | Alok Mukherjee | 9,442 | 15.8 | +1.08 | none listed | |||
| Green | Sarah Climenhaga | 4,042 | 6.8 | +3.77 | $447.10 | |||
| People's | John Kellen | 923 | 1.5 | - | $0.00 | |||
| Total valid votes/Expense limit | 59,834 | 100.00 | ||||||
| Total rejected ballots | 384 | |||||||
| Turnout | 60,218 | 71.6 | -2.3 | |||||
| Eligible voters | 84,110 | |||||||
| Source: Elections Canada[4][5] | ||||||||
| 2015 Canadian federal election | ||||||||
|---|---|---|---|---|---|---|---|---|
| Party | Candidate | Votes | % | ±% | Expenditures | |||
| Liberal | Carolyn Bennett | 31,481 | 55.26 | +15.34 | $128,256.52 | |||
| Conservative | Marnie MacDougall | 15,376 | 26.99 | -5.43 | $186,719.71 | |||
| New Democratic | Noah Richler | 8,386 | 14.72 | -7.91 | $53,022.76 | |||
| Green | Kevin Farmer | 1,729 | 3.03 | -1.45 | $3,643.09 | |||
| Total valid votes/Expense limit | 56,972 | 100.0 | $210,412.41 | |||||
| Total rejected ballots | 252 | – | – | |||||
| Turnout | 57,224 | 73.9 | – | |||||
| Eligible voters | 77,433 | |||||||
| Source: Elections Canada[6][7][8] | ||||||||
| 2011 federal election redistributed results[9] | |||
|---|---|---|---|
| Party | Vote | % | |
| Liberal | 19,563 | 39.92 | |
| Conservative | 15,887 | 32.42 | |
| New Democratic | 11,088 | 22.63 | |
| Green | 2,195 | 4.48 | |
| Others | 267 | 0.54 | |
St. Paul's, 1935–2015
| 2011 Canadian federal election | ||||||||
|---|---|---|---|---|---|---|---|---|
| Party | Candidate | Votes | % | ±% | Expenditures | |||
| Liberal | Carolyn Bennett | 22,409 | 40.6 | -9.9 | ||||
| Conservative | Maureen Harquail | 17,864 | 32.4 | +5.8 | ||||
| New Democratic | William Molls | 12,124 | 22.0 | +8.7 | ||||
| Green | Jim McGarva | 2,495 | 4.5 | -4.6 | ||||
| Libertarian | John Kittredge | 303 | 0.5 | -0.1 | ||||
| Total valid votes/Expense limit | 55,195 | 100.0 | ||||||
| Total rejected ballots | 276 | 0.5 | – | |||||
| Turnout | 55,471 | 68.2 | – | |||||
| Eligible voters | 81,288 | – | – | |||||
| 2008 Canadian federal election | ||||||||
|---|---|---|---|---|---|---|---|---|
| Party | Candidate | Votes | % | ±% | Expenditures | |||
| Liberal | Carolyn Bennett | 26,326 | 50.5 | +0.2 | $69,331 | |||
| Conservative | Heather Jewell | 13,800 | 26.6 | +0.8 | $53,617 | |||
| New Democratic | Anita Agrawal | 6,880 | 13.3 | -5.9 | $13,606 | |||
| Green | Justin Erdman | 4,713 | 9.1 | +4.3 | $3,526 | |||
| Libertarian | John Kittredge | 313 | 0.6 | – | $182 | |||
| Total valid votes/Expense limit | 52,032 | 100.0 | $86,488 | |||||
| 2006 Canadian federal election | ||||||||
|---|---|---|---|---|---|---|---|---|
| Party | Candidate | Votes | % | ±% | ||||
| Liberal | Carolyn Bennett | 29,295 | 50.3 | -8.1 | ||||
| Conservative | Peter Kent | 15,021 | 25.8 | +5.4 | ||||
| New Democratic | Paul Summerville | 11,189 | 19.2 | +3.5 | ||||
| Green | Kevin Farmer | 2,785 | 4.8 | -0.7 | ||||
| Total valid votes | 58,290 | 100.0 | ||||||
| 2004 Canadian federal election | ||||||||
|---|---|---|---|---|---|---|---|---|
| Party | Candidate | Votes | % | ±% | ||||
| Liberal | Carolyn Bennett | 32,171 | 58.4 | +4.1 | ||||
| Conservative | Barry Cline | 11,226 | 20.4 | -13.1* | ||||
| New Democratic | Norman Tobias | 8,667 | 15.7 | +6.3 | ||||
| Green | Peter Elgie | 3,031 | 5.5 | +3.9 | ||||
| Total valid votes | 55,095 | 100.0 | ||||||
*Comparison to total of Progressive Conservative and Canadian Alliance vote in 2000.
| 2000 Canadian federal election | ||||||||
|---|---|---|---|---|---|---|---|---|
| Party | Candidate | Votes | % | ±% | ||||
| Liberal | Carolyn Bennett | 25,358 | 54.0 | -0.3 | ||||
| Progressive Conservative | Barry Cline | 10,099 | 21.5 | -2.2 | ||||
| Alliance | Theo Caldwell | 5,457 | 11.6 | +4.3 | ||||
| New Democratic | Guy Hunter | 4,451 | 9.5 | -2.9 | ||||
| Green | Don Roebuck | 769 | 1.6 | +0.4 | ||||
| Marijuana | Andrew Potter | 514 | 1.1 | |||||
| Canadian Action | Mark Till | 128 | 0.3 | -0.1 | ||||
| Marxist–Leninist | Barbara Seed | 88 | 0.2 | -0.1 | ||||
| Natural Law | Ron Parker | 83 | 0.2 | -0.3 | ||||
| Total valid votes | 46,947 | 100.0 | ||||||
Note: Canadian Alliance vote is compared to the Reform vote in 1997 election.
| 1997 Canadian federal election | ||||||||
|---|---|---|---|---|---|---|---|---|
| Party | Candidate | Votes | % | ±% | ||||
| Liberal | Carolyn Bennett | 26,389 | 54.3 | -0.1 | ||||
| Progressive Conservative | Peter Atkins | 11,520 | 23.7 | -0.7 | ||||
| New Democratic | Michael Halewood | 6,028 | 12.4 | +7.3 | ||||
| Reform | Francis Floszmann | 3,564 | 7.3 | -3.8 | ||||
| Green | Don Roebuck | 597 | 1.2 | +0.3 | ||||
| Natural Law | Neil Dickie | 221 | 0.5 | -0.2 | ||||
| Canadian Action | Daniel Widdicombe | 182 | 0.4 | |||||
| Marxist–Leninist | Fernand Deschamps | 135 | 0.3 | +0.1 | ||||
| Total valid votes | 48,636 | 100.0 | ||||||
| 1993 Canadian federal election | ||||||||
|---|---|---|---|---|---|---|---|---|
| Party | Candidate | Votes | % | ±% | ||||
| Liberal | Barry Campbell | 27,878 | 54.4 | +13.6 | ||||
| Progressive Conservative | Isabel Bassett | 12,500 | 24.4 | -23.1 | ||||
| Reform | Paul Chaplin | 5,707 | 11.1 | |||||
| New Democratic | David Jacobs | 2,629 | 5.1 | -4.9 | ||||
| National | Mario Godlewski | 1,253 | 2.4 | |||||
| Green | Jim Harris | 491 | 1.0 | +0.3 | ||||
| Natural Law | Rick C. Weberg | 314 | 0.6 | |||||
| Independent | Jim Conrad | 262 | 0.5 | |||||
| Libertarian | Rick Stenhouse | 107 | 0.2 | -0.4 | ||||
| Marxist–Leninist | David Gershuny | 87 | 0.2 | |||||
| Abolitionist | Marion Velma Joyce | 19 | 0.0 | |||||
| Commonwealth of Canada | Mike Twose | 10 | 0.0 | |||||
| Total valid votes | 51,257 | 100.0 | ||||||
| 1988 Canadian federal election | ||||||||
|---|---|---|---|---|---|---|---|---|
| Party | Candidate | Votes | % | ±% | ||||
| Progressive Conservative | Barbara McDougall | 25,206 | 47.5 | 0.0 | ||||
| Liberal | Aideen Nicholson | 21,655 | 40.8 | +3.0 | ||||
| New Democratic | Diane Bull | 5,303 | 10.0 | -2.6 | ||||
| Green | Philip Sarazen | 348 | 0.7 | -0.5 | ||||
| Libertarian | Christian P. Sorensen | 346 | 0.7 | +0.2 | ||||
| Communist | John MacClennan | 171 | 0.3 | +0.1 | ||||
| Total valid votes | 53,029 | 100.0 | ||||||
| 1984 Canadian federal election | ||||||||
|---|---|---|---|---|---|---|---|---|
| Party | Candidate | Votes | % | ±% | ||||
| Progressive Conservative | Barbara McDougall | 20,914 | 47.6 | +8.0 | ||||
| Liberal | John Roberts | 16,659 | 37.9 | -7.4 | ||||
| New Democratic | John Webb | 5,545 | 12.6 | -0.8 | ||||
| Green | Joell Vanderwagen | 514 | 1.2 | |||||
| Libertarian | Jocelyne Demers | 210 | 0.5 | +0.1 | ||||
| Communist | Gerry Van Houten | 99 | 0.2 | 0.0 | ||||
| Commonwealth of Canada | William Gerby | 36 | 0.1 | |||||
| Total valid votes | 43,977 | 100.0 | ||||||
| 1980 Canadian federal election | ||||||||
|---|---|---|---|---|---|---|---|---|
| Party | Candidate | Votes | % | ±% | ||||
| Liberal | John Roberts | 17,905 | 45.3 | +4.0 | ||||
| Progressive Conservative | Ron Atkey | 15,643 | 39.5 | -4.6 | ||||
| New Democratic | James Lockyer | 5,301 | 13.4 | +0.1 | ||||
| Rhinoceros | Liza Armour | 311 | 0.8 | +0.5 | ||||
| Libertarian | Dan A. Kornitzer | 162 | 0.4 | -0.3 | ||||
| Independent | Robert Smith | 108 | 0.3 | |||||
| Communist | Mel Doig | 76 | 0.2 | 0.0 | ||||
| Independent | Naomi Jolliffe | 37 | 0.1 | |||||
| Marxist–Leninist | Keith Ramdeen | 22 | 0.1 | 0.0 | ||||
| Total valid votes | 39,565 | 100.0 | ||||||
| 1979 Canadian federal election | ||||||||
|---|---|---|---|---|---|---|---|---|
| Party | Candidate | Votes | % | ±% | ||||
| Progressive Conservative | Ron Atkey | 19,161 | 44.1 | +1.7 | ||||
| Liberal | John Roberts | 17,949 | 41.3 | -4.2 | ||||
| New Democratic | James Lockyer | 5,779 | 13.3 | +2.2 | ||||
| Libertarian | Ronald F. Bailey | 325 | 0.7 | |||||
| Rhinoceros | Jacques Gauthier | 117 | 0.3 | |||||
| Communist | Ruth Fitzgerald | 97 | 0.2 | -0.2 | ||||
| Marxist–Leninist | Nola Moore | 29 | 0.1 | -0.1 | ||||
| Total valid votes | 43,457 | 100.0 | ||||||
| 1974 Canadian federal election | ||||||||
|---|---|---|---|---|---|---|---|---|
| Party | Candidate | Votes | % | ±% | ||||
| Liberal | John Roberts | 16,124 | 45.5 | +6.2 | ||||
| Progressive Conservative | Ron Atkey | 15,010 | 42.4 | -0.1 | ||||
| New Democratic | Lukin Robinson | 3,913 | 11.1 | -0.8 | ||||
| Communist | Barbara Cameron | 165 | 0.5 | |||||
| Independent | Richard Carl Bolster | 138 | 0.4 | |||||
| Marxist–Leninist | Crawford McNair | 56 | 0.2 | |||||
| Total valid votes | 35,406 | 100.0 | ||||||
| 1972 Canadian federal election | ||||||||
|---|---|---|---|---|---|---|---|---|
| Party | Candidate | Votes | % | ±% | ||||
| Progressive Conservative | Ron Atkey | 15,676 | 42.5 | +11.7 | ||||
| Liberal | Ian Wahn | 14,484 | 39.3 | -20.1 | ||||
| New Democratic | Mary Boyce | 4,376 | 11.9 | +4.1 | ||||
| Independent | Kay Macpherson | 2,044 | 5.5 | |||||
| Independent | Elizabeth Hill | 133 | 0.4 | |||||
| Social Credit | John Bilan | 87 | 0.2 | |||||
| Independent | Crawford McNair | 48 | 0.1 | |||||
| Total valid votes | 36,848 | 100.0 | ||||||
| 1968 Canadian federal election | ||||||||
|---|---|---|---|---|---|---|---|---|
| Party | Candidate | Votes | % | ±% | ||||
| Liberal | Ian Wahn | 20,981 | 59.4 | +10.9 | ||||
| Progressive Conservative | Barry Lowes | 10,882 | 30.8 | -1.6 | ||||
| New Democratic | Robert Fenn | 2,743 | 7.8 | -11.3 | ||||
| Independent | W.J. Russell Taylor | 420 | 1.2 | |||||
| Communist | Rae Allan Murphy | 292 | 0.8 | |||||
| Total valid votes | 35,318 | 100.0 | ||||||
| 1965 Canadian federal election | ||||||||
|---|---|---|---|---|---|---|---|---|
| Party | Candidate | Votes | % | ±% | ||||
| Liberal | Ian Wahn | 12,251 | 48.5 | -8.2 | ||||
| Progressive Conservative | Ward Markle | 8,204 | 32.5 | +4.6 | ||||
| New Democratic | Alan Rimmer | 4,821 | 19.1 | +5.5 | ||||
| Total valid votes | 25,276 | 100.0 | ||||||
| 1963 Canadian federal election | ||||||||
|---|---|---|---|---|---|---|---|---|
| Party | Candidate | Votes | % | ±% | ||||
| Liberal | Ian Wahn | 15,891 | 56.7 | +14.8 | ||||
| Progressive Conservative | Joel W. Aldred | 7,795 | 27.8 | -13.6 | ||||
| New Democratic | Don Stevenson | 3,794 | 13.5 | +0.2 | ||||
| Social Credit | Neil Carmichael | 543 | 1.9 | -0.2 | ||||
| Total valid votes | 28,023 | 100.0 | ||||||
| 1962 Canadian federal election | ||||||||
|---|---|---|---|---|---|---|---|---|
| Party | Candidate | Votes | % | ±% | ||||
| Liberal | Ian Wahn | 11,140 | 41.9 | +16.3 | ||||
| Progressive Conservative | Roland Michener | 11,013 | 41.4 | -23.4 | ||||
| New Democratic | Don Stevenson | 3,533 | 13.3 | +3.7 | ||||
| Social Credit | Neil Carmichael | 563 | 2.1 | |||||
| Independent | Douglas Campbell | 328 | 1.2 | |||||
| Total valid votes | 26,577 | 100.0 | ||||||
Note: NDP vote is compared to CCF vote in 1958 election.
| 1958 Canadian federal election | ||||||||
|---|---|---|---|---|---|---|---|---|
| Party | Candidate | Votes | % | ±% | ||||
| Progressive Conservative | Roland Michener | 18,213 | 64.8 | +7.9 | ||||
| Liberal | Joseph S. Williams | 7,212 | 25.7 | -2.6 | ||||
| Co-operative Commonwealth | Margot Thompson | 2,686 | 9.6 | -2.9 | ||||
| Total valid votes | 28,111 | 100.0 | ||||||
| 1957 Canadian federal election | ||||||||
|---|---|---|---|---|---|---|---|---|
| Party | Candidate | Votes | % | ±% | ||||
| Progressive Conservative | Roland Michener | 13,243 | 56.9 | +15.4 | ||||
| Liberal | James Rooney | 6,586 | 28.3 | -11.0 | ||||
| Co-operative Commonwealth | Margot Thompson | 2,906 | 12.5 | -3.6 | ||||
| Social Credit | Burton Ford | 533 | 2.3 | +0.7 | ||||
| Total valid votes | 23,268 | 100.0 | ||||||
| 1953 Canadian federal election | ||||||||
|---|---|---|---|---|---|---|---|---|
| Party | Candidate | Votes | % | ±% | ||||
| Progressive Conservative | Roland Michener | 9,738 | 41.5 | +3.0 | ||||
| Liberal | James Rooney | 9,223 | 39.3 | -2.4 | ||||
| Co-operative Commonwealth | Andrew Brewin | 3,786 | 16.1 | -3.7 | ||||
| Communist | Annie Buller Guralnick | 369 | 1.6 | |||||
| Social Credit | Neil Carmichael | 363 | 1.5 | |||||
| Total valid votes | 23,479 | 100.0 | ||||||
| 1949 Canadian federal election | ||||||||
|---|---|---|---|---|---|---|---|---|
| Party | Candidate | Votes | % | ±% | ||||
| Liberal | James Rooney | 14,000 | 41.7 | +1.6 | ||||
| Progressive Conservative | Roland Michener | 12,922 | 38.5 | -2.2 | ||||
| Co-operative Commonwealth | Andrew F. Brewin | 6,677 | 19.9 | +3.6 | ||||
| Total valid votes | 33,599 | 100.0 | ||||||
| 1945 Canadian federal election | ||||||||
|---|---|---|---|---|---|---|---|---|
| Party | Candidate | Votes | % | ±% | ||||
| Progressive Conservative | Douglas Ross | 12,390 | 40.7 | -10.6 | ||||
| Liberal | James Rooney | 12,211 | 40.1 | -8.6 | ||||
| Co-operative Commonwealth | Andrew F. Brewin | 4,958 | 16.3 | |||||
| Communist | William Kashtan | 895 | 2.9 | |||||
| Total valid votes | 30,454 | 100.0 | ||||||
Note: Progressive Conservative vote is compared to "National Government" vote in 1940 election.
| 1940 Canadian federal election | ||||||||
|---|---|---|---|---|---|---|---|---|
| Party | Candidate | Votes | % | ±% | ||||
| National Government | Douglas Ross | 15,591 | 51.3 | +10.3 | ||||
| Liberal | James Rooney | 14,816 | 48.7 | +9.8 | ||||
| Total valid votes | 30,407 | 100.0 | ||||||
Note: "National Government" vote is compared to Conservative vote in 1935 election.
| 1935 Canadian federal election | ||||||||
|---|---|---|---|---|---|---|---|---|
| Party | Candidate | Votes | % | |||||
| Conservative | Douglas Ross | 10,852 | 40.9 | |||||
| Liberal | Salter Hayden | 10,322 | 38.9 | |||||
| Reconstruction | James Robertson | 2,713 | 10.2 | |||||
| Co-operative Commonwealth | Ted Jolliffe | 2,628 | 9.9 | |||||
| Total valid votes | 26,515 | 100.0 | ||||||
References
- "(Code 35077) Census Profile". 2011 census. Statistics Canada. 2012. Retrieved 2011-03-03.
Notes
- Statistics Canada: 2011
- Statistics Canada: 2011
- http://www.parl.gc.ca/HousePublications/Publication.aspx?Language=E&Mode=1&DocId=6654879&File=4
- "Result of voting, certificate of returning officer". 23 October 2019. Cite journal requires
|journal=(help) - "Election Night Results". Elections Canada. Retrieved November 6, 2019.
- Elections Canada – Confirmed candidates for Toronto—St. Paul's, 30 September 2015
- Elections Canada – Preliminary Election Expenses Limits for Candidates
- Pundits' Guide to Canadian Elections
External links
- 1933–1966 Riding history from the Library of Parliament
- 1966-present Riding history from the Library of Parliament
- 2011 results from Elections Canada
- Campaign expense data from Elections Canada