Cochran County, Texas
Cochran County is a county located in the U.S. state of Texas. As of the 2010 census, its population was 3,127.[1] The county seat is Morton.[2] The county was created in 1876 and later organized in 1924.[3] It is named for Robert E. Cochran, a defender of the Alamo.[4]
Cochran County | |
|---|---|
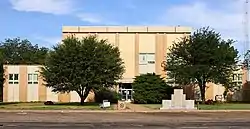 The Cochran County Courthouse in Morton. | |
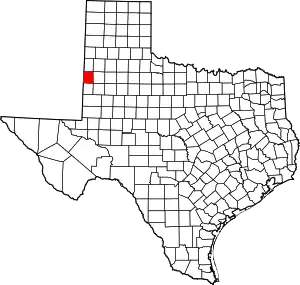 Location within the U.S. state of Texas | |
 Texas's location within the U.S. | |
| Coordinates: 33°36′N 102°50′W | |
| Country | |
| State | |
| Founded | 1924 |
| Named for | Robert E. Cochran |
| Seat | Morton |
| Largest city | Morton |
| Area | |
| • Total | 775 sq mi (2,010 km2) |
| • Land | 775 sq mi (2,010 km2) |
| • Water | 0.09 sq mi (0.2 km2) 0.01%% |
| Population (2010) | |
| • Total | 3,127 |
| • Density | 4.0/sq mi (1.5/km2) |
| Congressional district | 19th |
| Website | www |
Geography
According to the U.S. Census Bureau, the county has a total area of 775 square miles (2,010 km2), of which 775 square miles (2,010 km2) are land and 0.09 square miles (0.23 km2) (0.01%) is covered by water.[5] Cochran County lies on the high plains of the Llano Estacado. The western border of the county lies along the border of Texas and New Mexico.
Major highways
Adjacent counties
- Bailey County (north)
- Hockley County (east)
- Yoakum County (south)
- Lea County, New Mexico (southwest/Mountain Time Zone)
- Roosevelt County, New Mexico (northwest/Mountain Time Zone)
Demographics
| Historical population | |||
|---|---|---|---|
| Census | Pop. | %± | |
| 1900 | 25 | — | |
| 1910 | 65 | 160.0% | |
| 1920 | 67 | 3.1% | |
| 1930 | 1,963 | 2,829.9% | |
| 1940 | 3,735 | 90.3% | |
| 1950 | 5,928 | 58.7% | |
| 1960 | 6,417 | 8.2% | |
| 1970 | 5,326 | −17.0% | |
| 1980 | 4,825 | −9.4% | |
| 1990 | 4,377 | −9.3% | |
| 2000 | 3,730 | −14.8% | |
| 2010 | 3,127 | −16.2% | |
| 2019 (est.) | 2,853 | [6] | −8.8% |
| U.S. Decennial Census[7] 1850–2010[8] 2010–2014[1] | |||
As of the census[9] of 2000, there were 3,730 people, 1,309 households, and 1,017 families living in the county. The population density was 5 people per square mile (2/km2). There were 1,587 housing units at an average density of 2 per square mile (1/km2). The racial makeup of the county was 64.48% White, 4.53% Black or African American, 0.83% Native American, 0.21% Asian, 0.05% Pacific Islander, 27.35% from other races, and 2.55% from two or more races. 44.13% of the population were Hispanic or Latino of any race.
There were 1,309 households, out of which 38.10% had children under the age of 18 living with them, 63.80% were married couples living together, 9.90% had a female householder with no husband present, and 22.30% were non-families. 20.90% of all households were made up of individuals, and 11.10% had someone living alone who was 65 years of age or older. The average household size was 2.79 and the average family size was 3.25.
In the county, the population was spread out, with 31.50% under the age of 18, 8.00% from 18 to 24, 24.90% from 25 to 44, 21.20% from 45 to 64, and 14.40% who were 65 years of age or older. The median age was 35 years. For every 100 females there were 92.10 males. For every 100 females age 18 and over, there were 93.30 males.
The median income for a household in the county was $27,525, and the median income for a family was $31,163. Males had a median income of $25,064 versus $17,652 for females. The per capita income for the county was $13,125. About 21.40% of families and 27.00% of the population were below the poverty line, including 37.20% of those under age 18 and 11.70% of those age 65 or over.
Politics
| Year | Republican | Democratic | Third parties |
|---|---|---|---|
| 2016 | 75.4% 679 | 21.1% 190 | 3.6% 32 |
| 2012 | 70.8% 649 | 27.9% 256 | 1.3% 12 |
| 2008 | 71.7% 758 | 26.9% 284 | 1.4% 15 |
| 2004 | 77.1% 856 | 22.4% 249 | 0.5% 5 |
| 2000 | 68.9% 807 | 29.4% 344 | 1.7% 20 |
| 1996 | 49.9% 667 | 40.5% 541 | 9.6% 128 |
| 1992 | 51.3% 750 | 31.1% 454 | 17.6% 257 |
| 1988 | 52.7% 771 | 46.6% 681 | 0.7% 10 |
| 1984 | 66.1% 1,117 | 33.0% 557 | 0.9% 15 |
| 1980 | 66.2% 1,064 | 31.9% 513 | 1.9% 30 |
| 1976 | 40.3% 701 | 59.3% 1,031 | 0.4% 7 |
| 1972 | 72.0% 1,106 | 27.0% 415 | 1.0% 15 |
| 1968 | 33.6% 548 | 38.8% 633 | 27.6% 449 |
| 1964 | 28.2% 497 | 71.6% 1,260 | 0.2% 4 |
| 1960 | 38.6% 646 | 61.4% 1,028 | |
| 1956 | 39.3% 599 | 60.6% 923 | 0.1% 1 |
| 1952 | 46.1% 780 | 53.5% 906 | 0.4% 7 |
| 1948 | 10.0% 119 | 81.9% 971 | 8.1% 96 |
| 1944 | 12.3% 123 | 71.6% 716 | 16.1% 161 |
| 1940 | 13.7% 122 | 85.9% 765 | 0.5% 4 |
| 1936 | 7.7% 58 | 91.2% 683 | 1.1% 8 |
| 1932 | 8.0% 31 | 88.9% 345 | 3.1% 12 |
| 1928 | 64.4% 197 | 35.6% 109 | |
| 1924 | 12.5% 9 | 81.9% 59 | 5.6% 4 |
References
- "State & County QuickFacts". United States Census Bureau. Archived from the original on September 5, 2015. Retrieved December 9, 2013.
- "Find a County". National Association of Counties. Archived from the original on 2011-05-31. Retrieved 2011-06-07.
- "Texas: Individual County Chronologies". Texas Atlas of Historical County Boundaries. The Newberry Library. 2008. Retrieved May 21, 2015.
- Local Option Elections, TABC Archived 2014-05-16 at the Wayback Machine
- "2010 Census Gazetteer Files". United States Census Bureau. August 22, 2012. Retrieved April 20, 2015.
- "Population and Housing Unit Estimates". United States Census Bureau. May 24, 2020. Retrieved May 27, 2020.
- "U.S. Decennial Census". United States Census Bureau. Retrieved April 20, 2015.
- "Texas Almanac: Population History of Counties from 1850–2010" (PDF). Texas Almanac. Retrieved April 20, 2015.
- "U.S. Census website". United States Census Bureau. Retrieved 2011-05-14.
- Leip, David. "Dave Leip's Atlas of U.S. Presidential Elections". uselectionatlas.org. Retrieved 11 April 2018.
External links
| Wikimedia Commons has media related to Cochran County, Texas. |
- Cochran County government's website
- Cochran County in Handbook of Texas Online at the University of Texas
- Cochran County Profile from the Texas Association of Counties
- Photos of West Texas and Eastern New Mexico
Places adjacent to Cochran County, Texas | ||||||||||
|---|---|---|---|---|---|---|---|---|---|---|
| ||||||||||
Municipalities and communities of Cochran County, Texas, United States | ||
|---|---|---|
| City | Cochran County map | |
| Town | ||
| Unincorporated community | ||
| ||

| Authority control |
|---|