Colorado County, Texas
Colorado County is a county located in the U.S. state of Texas. As of the 2010 census, its population was 20,874.[1] Its county seat is Columbus.[2] It is named for the Colorado River of Texas. The county was founded in 1836 and organized the next year.[3][4]
Colorado County | |
|---|---|
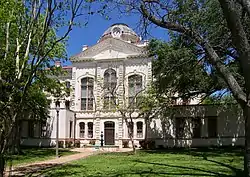 Colorado County Courthouse in Columbus | |
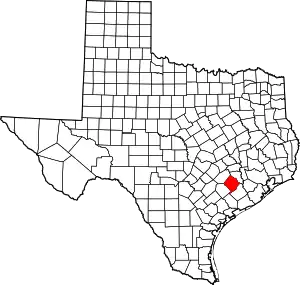 Location within the U.S. state of Texas | |
 Texas's location within the U.S. | |
| Coordinates: 29°37′N 96°31′W | |
| Country | |
| State | |
| Founded | 1837 |
| Named for | Colorado River |
| Seat | Columbus |
| Largest city | Eagle Lake |
| Area | |
| • Total | 974 sq mi (2,520 km2) |
| • Land | 960 sq mi (2,500 km2) |
| • Water | 13 sq mi (30 km2) 1.4%% |
| Population (2010) | |
| • Total | 20,874 |
| • Density | 22/sq mi (8/km2) |
| Time zone | UTC−6 (Central) |
| • Summer (DST) | UTC−5 (CDT) |
| Congressional district | 10th |
| Website | www |
History
The territory that is now Colorado County has been continually inhabited by humans for about 12,000 years. The Coco branch of the Karaknawa are said to have hunted in the area, while Tonkawa crossed the area from the south.


The first record of an Anglo settler coming through the area that is now Colorado County was January 20, 1687, when René Robert Cavelier, Sieur de La Salle camped along Skull Creek. The party located an Indigenous village and named it Hebemes. The fourth expedition of Alonso De León may have crossed in to the county while looking for Fort St. Louis in 1689.[5]
The area was settled by Anglo colonists who were part of Stephen F. Austin's Old Three Hundred starting in 1821. Some families settled near Beeson's Ford, a few miles south of Columbus' present day location. The area was active during the days of the Texas Revolution.[5] Dilue Rose Harris wrote her memoir of the Runaway Scrape from within the boundaries of Colorado County.[6]
The county was one of the original Republic of Texas Counties when it formed in 1836.[5] Following the American Civil War, the county had one of the larger populations of African American freedmen in the state, and was granted a Freedmen's Bureau office in Columbus.[7]
Many European settlers, particularly Germans as well as Moravians and Bohemians from what became Czechoslovakia, began to settle in the county after the civil war, although Germans had settled in the area as early as 1830.[5]
Geography
According to the U.S. Census Bureau, the county has a total area of 974 square miles (2,520 km2), of which 960 square miles (2,500 km2) is land and 13 square miles (34 km2) (1.4%) is water.[8]
Major highways
.svg.png.webp) Interstate 10
Interstate 10 U.S. Highway 90
 U.S. Highway 90 Alternate
 State Highway 71
Adjacent counties
- Austin County (northeast)
- Wharton County (southeast)
- Jackson County (south)
- Lavaca County (southwest)
- Fayette County (northwest)
National protected area
Demographics
| Historical population | |||
|---|---|---|---|
| Census | Pop. | %± | |
| 1850 | 2,257 | — | |
| 1860 | 7,885 | 249.4% | |
| 1870 | 8,326 | 5.6% | |
| 1880 | 16,673 | 100.3% | |
| 1890 | 19,512 | 17.0% | |
| 1900 | 22,203 | 13.8% | |
| 1910 | 18,897 | −14.9% | |
| 1920 | 19,013 | 0.6% | |
| 1930 | 19,129 | 0.6% | |
| 1940 | 17,812 | −6.9% | |
| 1950 | 17,576 | −1.3% | |
| 1960 | 18,463 | 5.0% | |
| 1970 | 17,638 | −4.5% | |
| 1980 | 18,823 | 6.7% | |
| 1990 | 18,383 | −2.3% | |
| 2000 | 20,390 | 10.9% | |
| 2010 | 20,874 | 2.4% | |
| 2019 (est.) | 21,493 | [9] | 3.0% |
| U.S. Decennial Census[10] 1850–2010[11] 2010–2014[1] | |||
As of the census[12] of 2000, there were 20,390 people, 7,641 households, and 5,402 families residing in the county. The population density was 21 people per square mile (8/km2). There were 9,431 housing units at an average density of 10 per square mile (4/km2). The racial makeup of the county was 72.79% White, 14.80% Black or African American, 0.37% Native American, 0.21% Asian, 0.02% Pacific Islander, 10.04% from other races, and 1.78% from two or more races. 19.74% of the population were Hispanic or Latino of any race.
There were 7,641 households, out of which 31.10% had children under the age of 18 living with them, 56.30% were married couples living together, 10.90% had a female householder with no husband present, and 29.30% were non-families. 26.20% of all households were made up of individuals, and 14.40% had someone living alone who was 65 years of age or older. The average household size was 2.56 and the average family size was 3.08.
In the county, the population was spread out, with 25.60% under the age of 18, 8.90% from 18 to 24, 23.80% from 25 to 44, 23.10% from 45 to 64, and 18.60% who were 65 years of age or older. The median age was 39 years. For every 100 females there were 95.30 males. For every 100 females age 18 and over, there were 92.40 males.
The median income for a household in the county was $32,425, and the median income for a family was $41,388. Males had a median income of $30,063 versus $20,014 for females. The per capita income for the county was $16,910. About 12.30% of families and 16.20% of the population were below the poverty line, including 21.00% of those under age 18 and 15.80% of those age 65 or over.
Communities
Cities
- Columbus (county seat)
- Eagle Lake
- Weimar
Census-designated place
Other unincorporated communities
Ghost towns
Politics
Like many southern counties, Colorado County was predominantly Democratic prior to the 1960s and predominantly Republican since then. The last Democrat to carry the state was Jimmy Carter in 1976; George W. Bush, Mitt Romney and Donald Trump all received more than 70 percent of the vote in the county.
| Year | Republican | Democratic | Third parties |
|---|---|---|---|
| 2020 | 74.9% 7,472 | 24.3% 2,420 | 0.8% 83 |
| 2016 | 74.3% 6,325 | 23.3% 1,987 | 2.4% 201 |
| 2012 | 74.2% 6,026 | 25.0% 2,029 | 0.8% 62 |
| 2008 | 69.4% 5,795 | 30.0% 2,508 | 0.6% 50 |
| 2004 | 71.4% 5,488 | 28.1% 2,161 | 0.5% 41 |
| 2000 | 67.8% 4,913 | 30.8% 2,229 | 1.5% 107 |
| 1996 | 49.9% 3,381 | 41.3% 2,795 | 8.8% 599 |
| 1992 | 45.9% 3,286 | 34.1% 2,442 | 20.0% 1,434 |
| 1988 | 56.4% 3,723 | 43.1% 2,847 | 0.5% 30 |
| 1984 | 65.0% 4,528 | 34.8% 2,428 | 0.2% 15 |
| 1980 | 58.8% 3,520 | 39.7% 2,377 | 1.6% 94 |
| 1976 | 49.2% 2,991 | 49.8% 3,028 | 0.9% 56 |
| 1972 | 69.7% 3,495 | 29.9% 1,502 | 0.4% 20 |
| 1968 | 42.2% 2,296 | 36.3% 1,976 | 21.5% 1,166 |
| 1964 | 34.4% 1,918 | 65.5% 3,650 | 0.1% 6 |
| 1960 | 45.0% 1,909 | 54.1% 2,299 | 0.9% 39 |
| 1956 | 61.6% 2,691 | 37.7% 1,648 | 0.6% 28 |
| 1952 | 61.2% 3,237 | 38.6% 2,043 | 0.2% 10 |
| 1948 | 28.5% 900 | 41.7% 1,316 | 29.8% 939 |
| 1944 | 20.6% 638 | 49.0% 1,517 | 30.4% 943 |
| 1940 | 41.0% 1,166 | 58.9% 1,674 | 0.1% 4 |
| 1936 | 20.5% 372 | 79.1% 1,435 | 0.4% 8 |
| 1932 | 10.8% 331 | 88.5% 2,715 | 0.8% 23 |
| 1928 | 33.2% 891 | 66.6% 1,787 | 0.2% 4 |
| 1924 | 21.5% 681 | 66.6% 2,105 | 11.9% 376 |
| 1920 | 19.3% 477 | 30.9% 765 | 49.8% 1,233 |
| 1916 | 24.2% 358 | 70.3% 1,041 | 5.5% 82 |
| 1912 | 7.2% 106 | 82.2% 1,204 | 10.6% 155 |
See also
References
- "State & County QuickFacts". United States Census Bureau. Archived from the original on November 5, 2015. Retrieved December 9, 2013.
- "Find a County". National Association of Counties. Archived from the original on 2011-05-31. Retrieved 2011-06-07.
- Mark Odintz (June 12, 2010). "Colorado County". Handbook of Texas Online. Texas State Historical Association. Retrieved June 20, 2015.
- "Colorado County". Texas Almanac. Texas State Historical Association. Retrieved June 20, 2015.
- ODINTZ, MARK (2010-06-12). "COLORADO COUNTY". tshaonline.org. Retrieved 2019-06-04.
- LANG, HERBERT H. (2010-06-15). "HARRIS, DILUE ROSE". tshaonline.org. Retrieved 2019-06-04.
- Crouch, Barry A., 1941- (1992). The Freedmen's Bureau and Black Texans (1st ed.). Austin: University of Texas Press. ISBN 0292724756. OCLC 24320568.CS1 maint: multiple names: authors list (link)
- "2010 Census Gazetteer Files". United States Census Bureau. August 22, 2012. Retrieved April 21, 2015.
- "Population and Housing Unit Estimates". United States Census Bureau. May 24, 2020. Retrieved May 27, 2020.
- "U.S. Decennial Census". United States Census Bureau. Retrieved April 21, 2015.
- "Texas Almanac: Population History of Counties from 1850–2010" (PDF). Texas Almanac. Retrieved April 21, 2015.
- "U.S. Census website". United States Census Bureau. Retrieved 2011-05-14.
- Leip, David. "Dave Leip's Atlas of U.S. Presidential Elections". uselectionatlas.org. Retrieved 2018-07-20.
External links
| Wikisource has the text of an 1879 American Cyclopædia article about Colorado County, Texas. |
- Colorado County government’s website
- Colorado County in Handbook of Texas Online at the University of Texas
- Weimar Information and Events
- Columbus Information and Events
Places adjacent to Colorado County, Texas | ||||||||||
|---|---|---|---|---|---|---|---|---|---|---|
| ||||||||||
Municipalities and communities of Colorado County, Texas, United States | ||
|---|---|---|
| Cities | Colorado County map | |
| CDP | ||
| Other unincorporated communities | ||
| Ghost towns | ||
| ||

| Authority control |
|---|