Parmer County, Texas
Parmer County is a county located in the southwestern Texas Panhandle on the High Plains of the Llano Estacado in the U.S. state of Texas. As of the 2010 census, the population was 10,269.[1] The county seat is Farwell.[2] The county was created in 1876 and later organized in 1907.[3] It is named in honor of Martin Parmer, a signer of the Texas Declaration of Independence and early judge. Parmer County was one of 10[4] prohibition, or entirely dry, counties in the state of Texas, but is now a wet county.
Parmer County | |
|---|---|
 The Parmer County Courthouse in Farwell | |
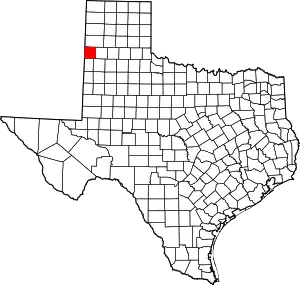 Location within the U.S. state of Texas | |
 Texas's location within the U.S. | |
| Coordinates: 34°32′N 102°47′W | |
| Country | |
| State | |
| Founded | 1907 |
| Named for | Martin Parmer |
| Seat | Farwell |
| Largest city | Friona |
| Area | |
| • Total | 885 sq mi (2,290 km2) |
| • Land | 881 sq mi (2,280 km2) |
| • Water | 4.4 sq mi (11 km2) 0.5%% |
| Population (2010) | |
| • Total | 10,269 |
| • Density | 12/sq mi (5/km2) |
| Time zone | UTC−6 (Central) |
| • Summer (DST) | UTC−5 (CDT) |
| Congressional district | 19th |
| Website | parmercounty |
Geography
According to the U.S. Census Bureau, the county has a total area of 885 square miles (2,290 km2), of which 881 square miles (2,280 km2) are land and 4.4 square miles (11 km2) (0.5%) are covered by water.[5]
Major highways
 U.S. Highway 60
 U.S. Highway 70
 U.S. Highway 84
 State Highway 86
 State Highway 214
Adjacent counties
- Deaf Smith County (north)
- Castro County (east)
- Lamb County (southeast)
- Bailey County (south)
- Curry County, New Mexico (west/Mountain Time Zone)
Demographics
| Historical population | |||
|---|---|---|---|
| Census | Pop. | %± | |
| 1890 | 7 | — | |
| 1900 | 34 | 385.7% | |
| 1910 | 1,555 | 4,473.5% | |
| 1920 | 1,699 | 9.3% | |
| 1930 | 5,869 | 245.4% | |
| 1940 | 5,890 | 0.4% | |
| 1950 | 5,787 | −1.7% | |
| 1960 | 9,583 | 65.6% | |
| 1970 | 10,509 | 9.7% | |
| 1980 | 11,038 | 5.0% | |
| 1990 | 9,863 | −10.6% | |
| 2000 | 10,016 | 1.6% | |
| 2010 | 10,269 | 2.5% | |
| 2019 (est.) | 9,605 | [6] | −6.5% |
| U.S. Decennial Census[7] 1850–2010[8] 2010–2014[1] | |||
As of the census[9] of 2000, 10,016 people, 3,322 households, and 2,614 families resided in the county. The population density was 11 people per square mile (4/km2). The 3,732 housing units averaged four per square mile (2/km2). The racial makeup of the county was 66.01% White, 1.01% Black or African American, 0.76% Native American, 0.32% Asian, 0.04% Pacific Islander, 29.51% from other races, and 2.35% from two or more races. About 49.19% of the population was Hispanic or Latino of any race.
Of the 3,322 households, 42.9% had children under the age of 18 living with them, 67.0% were married couples living together, 8.3% had a female householder with no husband present, and 21.3% were not families. About 19.3% of all households were made up of individuals, and 10.5% had someone living alone who was 65 years of age or older. The average household size was 2.97 and the average family size was 3.43.
In the county, the population was distributed as 32.9% under the age of 18, 8.5% from 18 to 24, 26.2% from 25 to 44, 19.6% from 45 to 64, and 12.7% who were 65 years of age or older. The median age was 32 years. For every 100 females, there were 97.90 males. For every 100 females age 18 and over, there were 93.90 males.
The median income for a household in the county was $30,813, and for a family was $34,149. Males had a median income of $26,966 versus $19,650 for females. The per capita income for the county was $14,184. About 14.2% of families and 17.0% of the population were below the poverty line, including 20.9% of those under age 18 and 14.2% of those age 65 or over.
Gallery


Politics
| Year | Republican | Democratic | Third parties |
|---|---|---|---|
| 2020 | 80.6% 2,135 | 18.4% 488 | 1.0% 27 |
| 2016 | 77.7% 1,915 | 19.7% 485 | 2.7% 66 |
| 2012 | 78.7% 2,011 | 20.7% 529 | 0.6% 14 |
| 2008 | 80.0% 2,969 | 19.4% 719 | 0.7% 25 |
| 2004 | 85.7% 2,375 | 14.0% 389 | 0.3% 9 |
| 2000 | 82.9% 2,274 | 16.3% 447 | 0.8% 23 |
| 1996 | 70.7% 2,042 | 23.4% 676 | 5.9% 170 |
| 1992 | 60.3% 1,829 | 21.0% 637 | 18.7% 567 |
| 1988 | 72.6% 2,061 | 26.9% 764 | 0.5% 14 |
| 1984 | 81.4% 2,524 | 18.3% 567 | 0.4% 11 |
| 1980 | 77.7% 2,640 | 20.8% 707 | 1.5% 51 |
| 1976 | 43.5% 1,487 | 56.0% 1,914 | 0.5% 16 |
| 1972 | 81.6% 2,304 | 17.5% 495 | 0.9% 24 |
| 1968 | 49.6% 1,539 | 26.9% 833 | 23.5% 730 |
| 1964 | 43.8% 1,216 | 56.0% 1,556 | 0.3% 7 |
| 1960 | 60.1% 1,674 | 39.1% 1,090 | 0.8% 22 |
| 1956 | 42.8% 1,028 | 56.7% 1,362 | 0.6% 14 |
| 1952 | 69.4% 1,503 | 30.6% 663 | |
| 1948 | 19.7% 280 | 76.8% 1,091 | 3.5% 50 |
| 1944 | 30.0% 415 | 58.5% 810 | 11.5% 159 |
| 1940 | 25.8% 370 | 74.0% 1,062 | 0.2% 3 |
| 1936 | 12.5% 135 | 86.8% 936 | 0.7% 7 |
| 1932 | 11.2% 148 | 87.5% 1,154 | 1.3% 17 |
| 1928 | 65.8% 620 | 33.4% 315 | 0.9% 8 |
| 1924 | 26.7% 91 | 62.8% 214 | 10.6% 36 |
| 1920 | 41.1% 140 | 55.4% 189 | 3.5% 12 |
| 1916 | 23.4% 64 | 70.8% 194 | 5.8% 16 |
| 1912 | 3.4% 6 | 59.8% 107 | 36.9% 66 |
See also
References
- "State & County QuickFacts". United States Census Bureau. Archived from the original on October 18, 2011. Retrieved December 22, 2013.
- "Find a County". National Association of Counties. Archived from the original on May 31, 2011. Retrieved 2011-06-07.
- "Texas: Individual County Chronologies". Texas Atlas of Historical County Boundaries. The Newberry Library. 2008. Retrieved May 26, 2015.
- "TABC Local Option Elections". Retrieved May 3, 2014.
- "2010 Census Gazetteer Files". United States Census Bureau. August 22, 2012. Retrieved May 6, 2015.
- "Population and Housing Unit Estimates". United States Census Bureau. May 24, 2020. Retrieved May 27, 2020.
- "U.S. Decennial Census". United States Census Bureau. Retrieved May 6, 2015.
- "Texas Almanac: Population History of Counties from 1850–2010" (PDF). Texas Almanac. Retrieved May 6, 2015.
- "U.S. Census website". United States Census Bureau. Retrieved 2011-05-14.
- Leip, David. "Dave Leip's Atlas of U.S. Presidential Elections". uselectionatlas.org. Retrieved 2018-07-28.
External links
- Parmer County government’s website
- Parmer County from the Handbook of Texas Online
- Parmer County Profile from the Texas Association of Counties
Places adjacent to Parmer County, Texas | ||||||||||
|---|---|---|---|---|---|---|---|---|---|---|
| ||||||||||
Municipalities and communities of Parmer County, Texas, United States | ||
|---|---|---|
| Cities | Parmer County map | |
| Unincorporated community | ||
| Ghost towns | ||
| ||

| Authority control |
|---|